Hanover: Fire Incidents, New Hampshire (NH)
Where are fire incidents reported in Hanover, NH
Something went wrong! Please refresh the page.
|
| |||||||||||||||||||||||||||||||||||||||||||||||||||||||||||||||||||||||||||||||||||||||||||||||||||||||||||||
2002 - 2018 National Fire Incident Reporting System (NFIRS) incidents
- Incident types reported to NFIRS in Hanover, NH
- 3,29845.4%Rescue & EMS
- 1,67523.0%False Alarm
- 89212.3%Hazardous Condition
- 5747.9%Service Call
- 4526.2%Fire
- 3404.7%Good Intent Call
- 200.3%Special Incident
- 130.2%Severe Weather
- 80.1%Overpressure Rupture
- Fire incident types reported to NFIRS in Hanover, NH
- 28763.5%Structure Fires
- 7416.4%Outside Fires
- 4910.8%Other
- 429.3%Mobile Property/Vehicle Fires
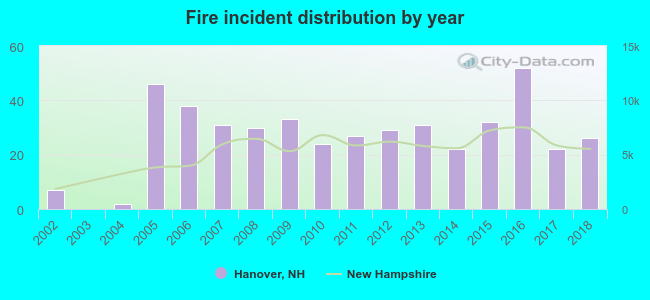 Based on the data from the years 2002 - 2018 the average number of fire incidents per year is 27. The highest number of reported fire incidents - 52 took place in 2016, and the least - 0 in 2003. The data has a rising trend.
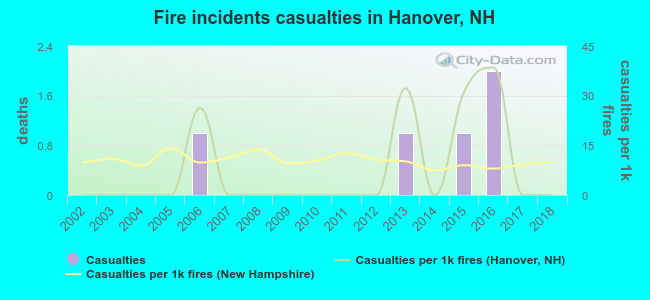 According to the data from the years 2002 - 2018 the average number of fire-related casualties per year is 0. The highest number of reported injuries - 2 took place in 2016, and the lowest - 0 in 2002. The data has a constant trend.
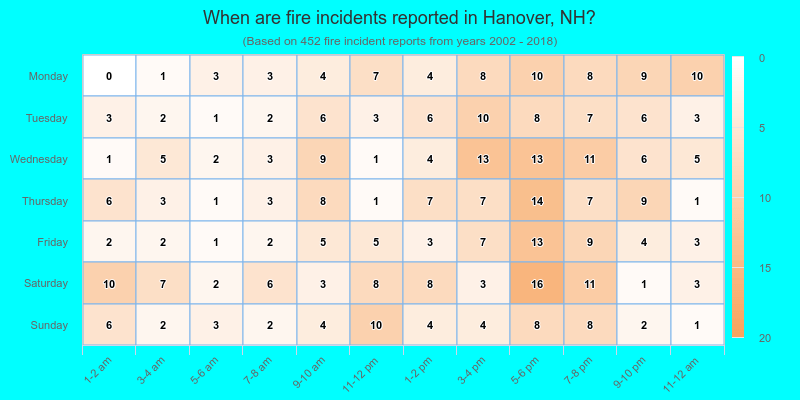
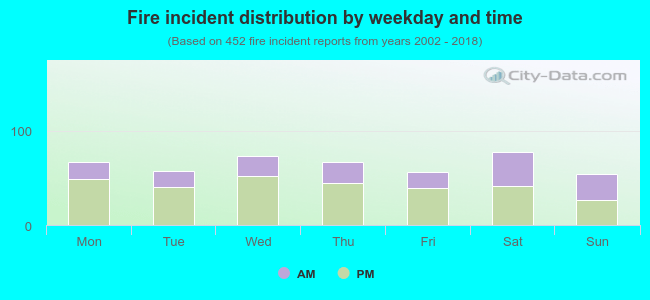 35.0% incidents where reported in the morning and 65.0% in the evening. The most fires (17.3%) took place on Saturday, and the least (11.9%) on Sunday.
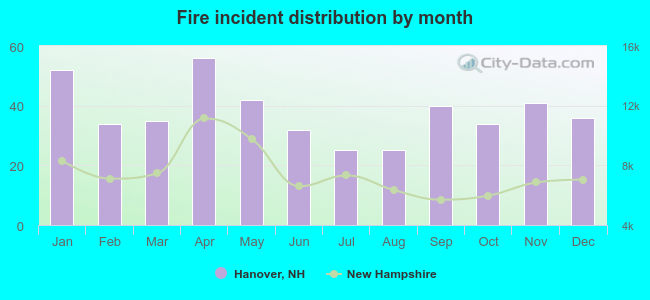 According to the 452 fire incident reports from years 2002 - 2018 most fires (12.4%) took place during April, and the least (5.5%) in July.
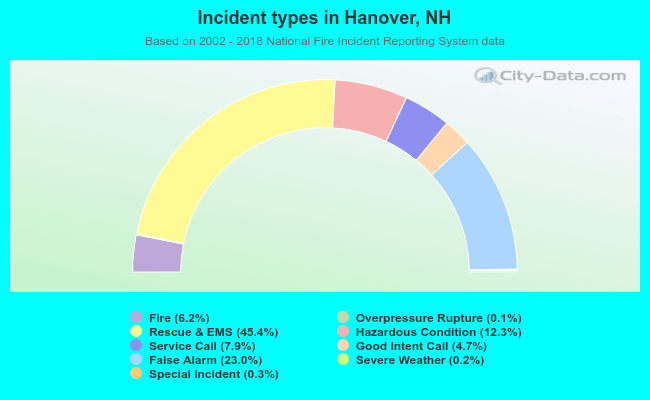 Out of all 7,272 cases reported during the years 2002 - 2018, the most belonged to the categories: Rescue & EMS (45.4%), False Alarm (23.0%), and Hazardous Condition (12.3%).
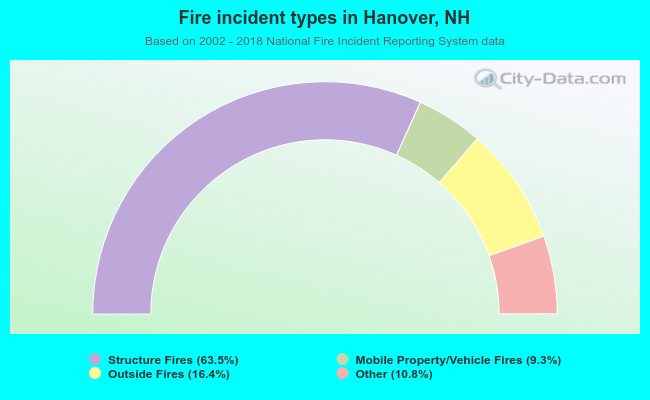 When looking into fire subcategories, the most incidents belonged to: Structure Fires (63.5%), and Outside Fires (16.4%).