Claremont: Fire Incidents, New Hampshire (NH)
Where are fire incidents reported in Claremont, NH
Something went wrong! Please refresh the page.
| Fire incidents reported | |
|---|---|
| Sreet name | Count |
| WASHINGTON ST | 102 |
| SULLIVAN ST | 76 |
| MAIN ST | 70 |
| MAPLE AVE | 64 |
| BROAD ST | 60 |
| PLEASANT ST | 56 |
| RIVER RD | 38 |
| HANOVER ST | 34 |
| MULBERRY ST | 28 |
| MYRTLE ST | 26 |
| WINTER ST | 26 |
| CENTRAL ST | 24 |
| NORTH ST | 24 |
| SUGAR RIVER DR | 24 |
| CAT HOLE RD | 22 |
| CHESTNUT ST | 22 |
| ELM ST | 22 |
| SOUTH ST | 22 |
| PEARL ST | 20 |
| THRASHER RD | 20 |
| OLD NEWPORT RD | 18 |
| TWISTBACK RD | 18 |
| CHARLESTOWN RD | 16 |
| HERITAGE DR | 16 |
| PROSPECT ST | 16 |
| BOWEN ST | 12 |
| LAFAYETTE ST | 12 |
| ANDERSON ST | 10 |
| BIBLE HILL RD | 10 |
| BOND ST | 10 |
2002 - 2018 National Fire Incident Reporting System (NFIRS) incidents
- Incident types reported to NFIRS in Claremont, NH
- 2,38129.3%Hazardous Condition
- 2,20427.1%Rescue & EMS
- 1,08013.3%False Alarm
- 80910.0%Fire
- 80810.0%Good Intent Call
- 8019.9%Service Call
- 170.2%Overpressure Rupture
- 120.1%Special Incident
- Fire incident types reported to NFIRS in Claremont, NH
- 45956.7%Structure Fires
- 16820.8%Outside Fires
- 12315.2%Mobile Property/Vehicle Fires
- 597.3%Other
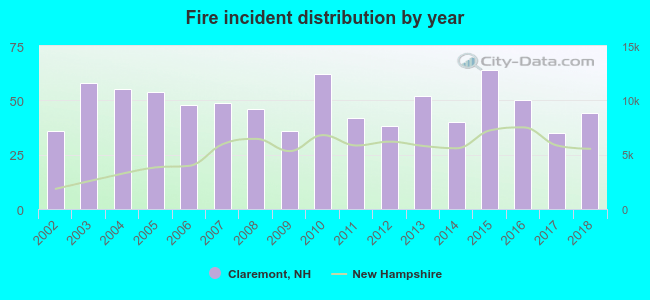 According to the data from the years 2002 - 2018 the average number of fires per year is 48. The highest number of fires - 64 took place in 2015, and the least - 35 in 2017. The data has a growing trend.
 The median response time based on all reported fire incidents is 4 minutes. This is lower than the state median value.
 Based on the reports from the years 2002 - 2018 the average number of fire-related yearly deaths is 0. The highest number of reported deaths - 3 took place in 2008, and the lowest - 0 in 2002. The data has a constant trend.
 According to the data from the years 2002 - 2018 the average number of fire-related casualties per year is 1. The highest number of injuries - 6 took place in 2007, and the lowest - 0 in 2002. The data has a constant trend.
The average number of injuries per 1,000 fire incidents is 25. This indicator was the highest - 122 in 2007, and the lowest 0 in 2002. The trend for casualties per 1,000 fires is constant. Compared to the New Hampshire value the number of casualties per 1,000 fire incidents is much higher.
According to the data from the years 2002 - 2018 the average number of fire-related casualties per year is 1. The highest number of injuries - 6 took place in 2007, and the lowest - 0 in 2002. The data has a constant trend.
The average number of injuries per 1,000 fire incidents is 25. This indicator was the highest - 122 in 2007, and the lowest 0 in 2002. The trend for casualties per 1,000 fires is constant. Compared to the New Hampshire value the number of casualties per 1,000 fire incidents is much higher.
 29.9% incidents where reported in the morning and 70.1% in the evening. The most fires (15.9%) took place on Thursday, and the least (13.1%) on Tuesday.
 According to the 809 incident reports from years 2002 - 2018 most fires (12.1%) took place during April, and the least (5.2%) in September.
 Out of all 8,120 cases reported during the years 2002 - 2018, the most belonged to the categories: Hazardous Condition (29.3%), Rescue & EMS (27.1%), and False Alarm (13.3%).
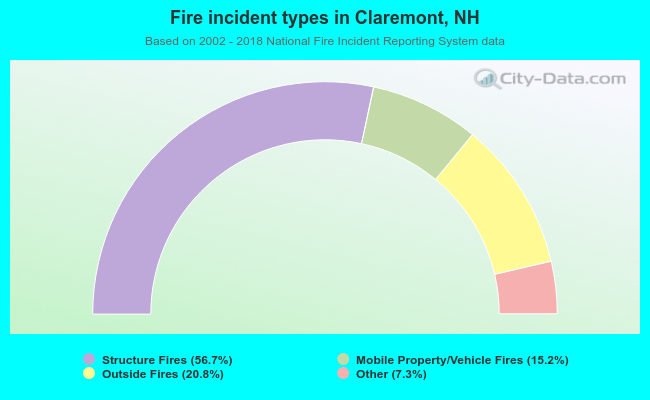 When looking into fire subcategories, the most reports belonged to: Structure Fires (56.7%), and Outside Fires (20.8%).