Gillespie: Fire Incidents, Illinois (IL)
Where are fire incidents reported in Gillespie, IL
Something went wrong! Please refresh the page.
|
| |||||||||||||||||||||||||||||||||||||||||||||||||||||||||||||||||||||||||||||||||||||||||||||||||||||||||||||
2004 - 2018 National Fire Incident Reporting System (NFIRS) incidents
- Incident types reported to NFIRS in Gillespie, IL
- 34648.9%Fire
- 17825.1%Hazardous Condition
- 10514.8%Rescue & EMS
- 263.7%Good Intent Call
- 233.2%False Alarm
- 223.1%Service Call
- 71.0%Severe Weather
- 10.1%Overpressure Rupture
- Fire incident types reported to NFIRS in Gillespie, IL
- 16246.8%Outside Fires
- 11934.4%Structure Fires
- 6017.3%Mobile Property/Vehicle Fires
- 51.4%Other
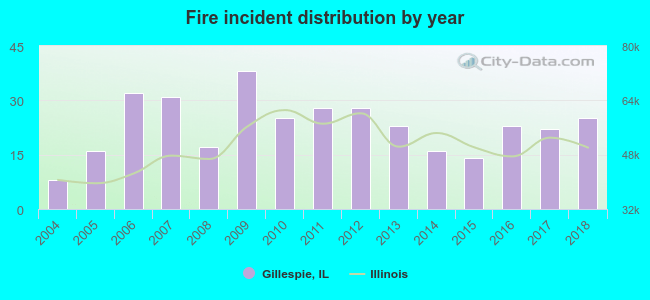 According to the data from the years 2004 - 2018 the average number of fires per year is 23. The highest number of fire incidents - 38 took place in 2009, and the least - 8 in 2004. The data has an increasing trend.
 According to the reports from the years 2004 - 2018 the average number of fire-related yearly casualties is 0. The highest number of reported casualties - 2 took place in 2016, and the lowest - 0 in 2004. The data has a constant trend.
 26.9% incidents where reported in the morning and 73.1% in the evening. The most fires (17.1%) took place on Saturday, and the least (12.1%) on Monday.
 According to the 346 incident reports from years 2004 - 2018 most fires (12.4%) took place during March, and the least (5.2%) in June.
 Out of all 708 cases reported during the years 2004 - 2018, the most belonged to the categories: Fire (48.9%), Hazardous Condition (25.1%), and Rescue & EMS (14.8%).
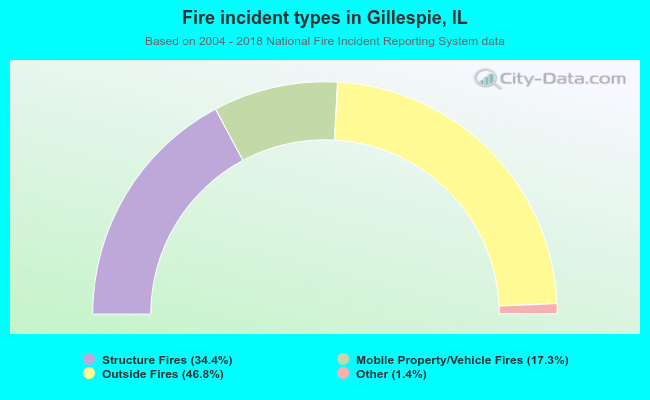 When looking into fire subcategories, the most reports belonged to: Outside Fires (46.8%), and Structure Fires (34.4%).