| Fire incidents reported |
|---|
| Sreet name | Count |
|---|
| MUTUAL AID GIVEN | 114 | | MAIN ST | 94 | | MUTUAL AID RAYMOND | 36 | | MUTUAL AID | 22 | | SHIRKIN RD | 20 | | WHITTIER DR | 20 | | SCRIBNER RD | 18 | | BEAN RD | 16 | | MUTUAL AID KINGSTON | 16 | | BEEDE HILL RD | 14 | | SANDOWN RD | 14 | | BRENTWOOD RD | 12 | | MUTUAL AID EPPING | 10 | | CAVIL MILL RD | 8 | | CHESTER RD | 8 | | COPP DR | 8 | | JACKIE BERNIER DR | 8 | | MARTIN RD | 8 | | MUTUAL AID - CHESTER | 8 | | MUTUAL AID - OTHER TOWN | 8 | | RIVERSIDE DR | 8 | | ROGERS RD | 8 | | SOUTH RD | 8 | | MEETINGHOUSE RD | 6 | | MUTUAL AID - KINGSTON | 6 |
| | | Fire incidents reported |
|---|
| Sreet name | Count |
|---|
| MUTUAL AID BRENTWOOD | 6 | | MUTUAL AID CHESTER | 6 | | MUTUAL AID DANVILLE | 6 | | NORTH RD | 6 | | ROWE DR | 6 | | SUNNY LANE | 6 | | TIBBETTS RD | 6 | | DANVILLE RD | 4 | | DEER RUN | 4 | | KARLIN RD | 4 | | MAIN | 4 | | MIDNIGHT SUN DR | 4 | | MUTUAL AID - BRENTWOOD | 4 | | MUTUAL AID - DANVILLE | 4 | | MUTUAL AID - DEERFIELD | 4 | | MUTUAL AID SANDOWN | 4 | | MUTUAL AID- EPPING | 4 | | PULASKI DR | 4 | | TAYLOR LANE | 4 | | 217 MAIN ST | 2 | | 38 BRENTWOOD RD | 2 | | 6 POLLINGER | 2 | | ANDRESKI DR | 2 | | ANDRESSKI DR | 2 | | |
|
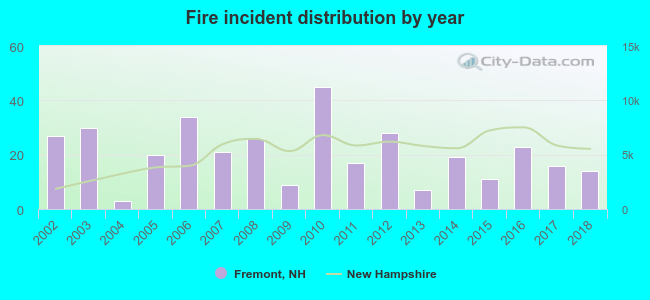 Based on the data from the years 2002 - 2018 the average number of fires per year is 21. The highest number of reported fires - 45 took place in 2010, and the least - 3 in 2004. The data has a dropping trend.
 33.4% incidents where reported in the morning and 66.6% in the evening. The most fires (18.0%) took place on Sunday, and the least (10.6%) on Tuesday.
 According to the 350 reports from years 2002 - 2018 most fires (13.4%) took place during April, and the least (4.3%) in September.
 Out of all 1,702 cases reported during the years 2002 - 2018, the most belonged to the categories: Rescue & EMS (44.8%), Fire (20.6%), and Hazardous Condition (15.5%).
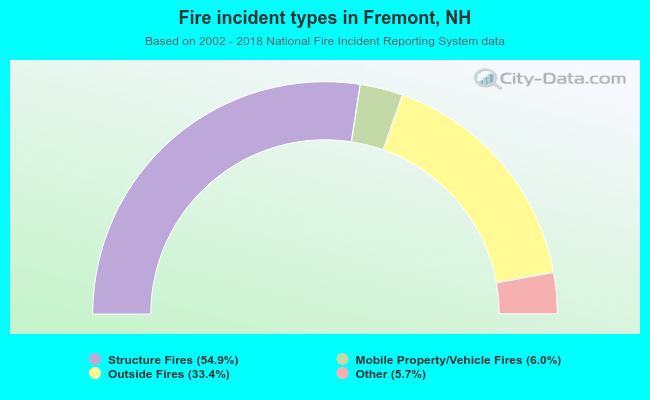 When looking into fire subcategories, the most incidents belonged to: Structure Fires (54.9%), and Outside Fires (33.4%).