| Fire incidents reported |
|---|
| Sreet name | Count |
|---|
| GREENFIELD RD | 14 | | MOUNTAIN RD | 12 | | POOR FARM RD | 12 | | BIBLE HILL RD | 10 | | SECOND NEW HAMPSHIRE TPKE | 10 | | WOODWARD HILL RD | 10 | | CAMPBELL HILL RD | 8 | | FRANCESTOWN ROAD | 8 | | MAIN ST | 8 | | PLEASANT POND RD | 8 | | 2ND NH TPKE | 6 | | EASTSIDE LN | 6 | | OAK HILL RD | 6 | | OLD COUNTY RD N | 6 | | RUSSELL STATION RD | 6 | | BENNINGTON RD | 4 | | JOURNEYS END RD | 4 | | MAIN STREET | 4 | | MOUNTAIN RD | 4 | | NEW BOSTON RD | 4 | | PERLEY RD | 4 | | POOR FARM ROAD | 4 | | POTASH RD | 4 | | SHATTUCK POND RD | 4 | | 2ND NEW HAMPSHIRE TPKE | 2 |
| | | Fire incidents reported |
|---|
| Sreet name | Count |
|---|
| AVERY RD | 2 | | AVERY RD | 2 | | BACK MOUNTAIN RD | 2 | | BENNINGTON RD | 2 | | BENNINGTON ROAD | 2 | | CAMBELL HILL RD. | 2 | | CAMPBELL HILL RD | 2 | | CAMPBELL HILL RDS | 2 | | CAMPBELL HILL ROAD | 2 | | CLARKEVILLE ROAD | 2 | | DENNISON POND RD | 2 | | DENNISON POND RD | 2 | | DODGE HILL RD | 2 | | DODGE HILL RD | 2 | | EAST RD | 2 | | EASTSIDE LANE | 2 | | FARRINGTON RD | 2 | | FERSON RD | 2 | | FRANCESTOWN | 2 | | FRANCESTOWN FIRE STATION | 2 | | KING HILL | 2 | | KING HILL RD | 2 | | MOUNT CROTCHED DR | 2 | | MOUNTAIN ROAD | 2 | | |
|
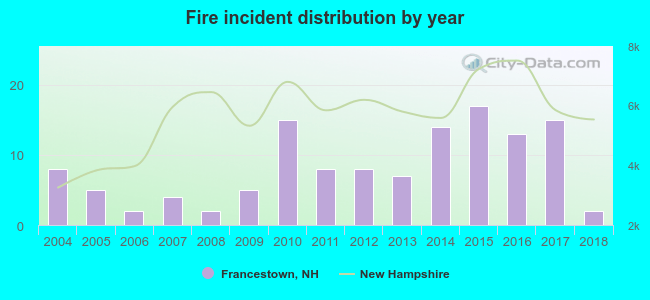 Based on the data from the years 2004 - 2018 the average number of fires per year is 8. The highest number of reported fires - 17 took place in 2015, and the least - 2 in 2006. The data has a dropping trend.
 30.4% incidents where reported in the morning and 69.6% in the evening. The most fires (20.8%) took place on Saturday, and the least (8.8%) on Tuesday.
 According to the 125 reports from years 2004 - 2018 most fires (23.2%) took place during January, and the least (2.4%) in August.
 Out of all 848 cases reported during the years 2004 - 2018, the most belonged to the categories: Overpressure Rupture (50.2%), Rescue & EMS (20.8%), and Fire (14.7%).
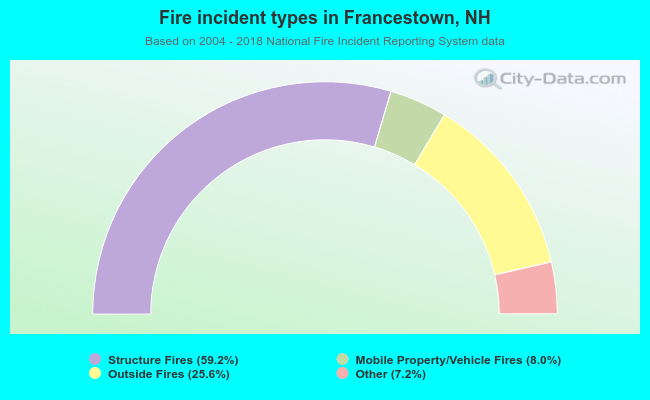 When looking into fire subcategories, the most incidents belonged to: Structure Fires (59.2%), and Outside Fires (25.6%).