Farr West: Fire Incidents, Utah (UT)
Where are fire incidents reported in Farr West, UT
Something went wrong! Please refresh the page.
|
| |||||||||||||||||||||||||||||||||||||||||||||||||||||||||||||||||||||||||||||||||||||||||||||||||||||||||||||
2002 - 2018 National Fire Incident Reporting System (NFIRS) incidents
- Incident types reported to NFIRS in Farr West, UT
- 1,95256.9%Rescue & EMS
- 61417.9%Good Intent Call
- 46613.6%Fire
- 1564.6%False Alarm
- 1544.5%Hazardous Condition
- 661.9%Service Call
- 120.4%Special Incident
- 50.1%Overpressure Rupture
- Fire incident types reported to NFIRS in Farr West, UT
- 22448.1%Outside Fires
- 9119.5%Mobile Property/Vehicle Fires
- 7716.5%Structure Fires
- 7415.9%Other
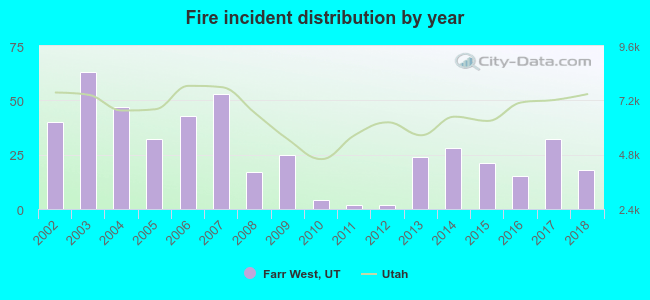 According to the data from the years 2002 - 2018 the average number of fire incidents per year is 27. The highest number of reported fires - 63 took place in 2003, and the least - 2 in 2011. The data has a dropping trend.
The average number of yearly fire incidents per 10k residents in Farr West, UT compared to nearest cities:
(Note: Based on data for the last 3 years, including only cities with population 5,000 and above)
| Farr West: | 34.2 |
| Harrisville: | 15.4 |
| Pleasant View: | 26.4 |
| Plain City: | 15.6 |
| North Ogden: | 12.1 |
| Ogden: | 35.9 |
| West Haven: | 40.6 |
| Riverdale: | 33.0 |
| Roy: | 20.1 |
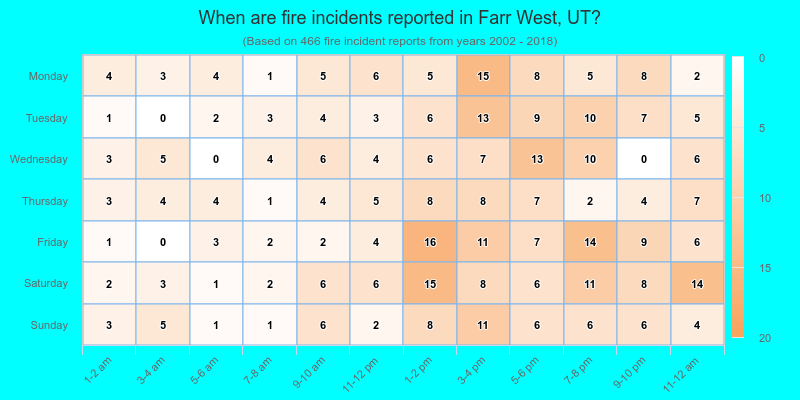
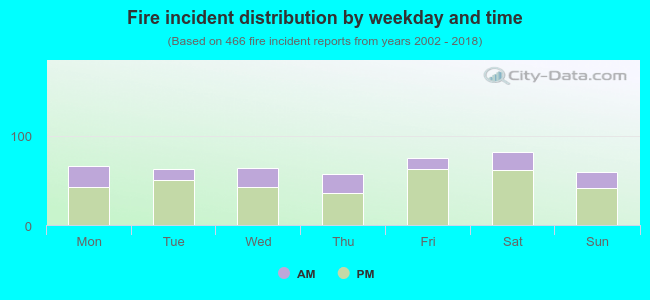 27.7% incidents where reported in the morning and 72.3% in the evening. The most fires (17.6%) took place on Saturday, and the least (12.2%) on Thursday.
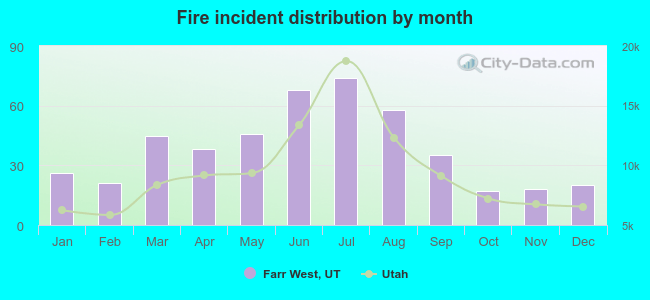 According to the 466 fire incidents from years 2002 - 2018 most fires (15.9%) took place during July, and the least (3.6%) in October.
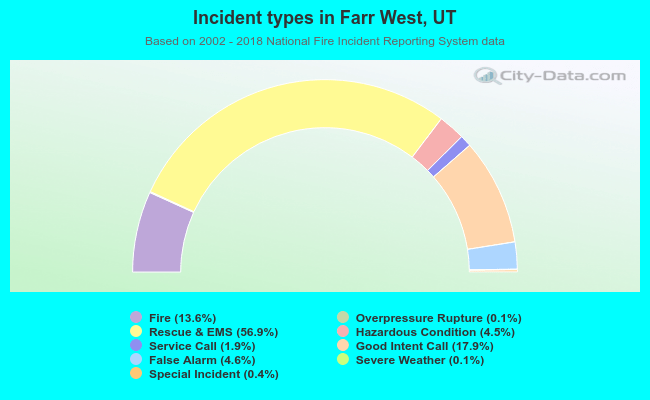 Out of all 3,428 cases reported during the years 2002 - 2018, the most belonged to the categories: Rescue & EMS (56.9%), Good Intent Call (17.9%), and Fire (13.6%).
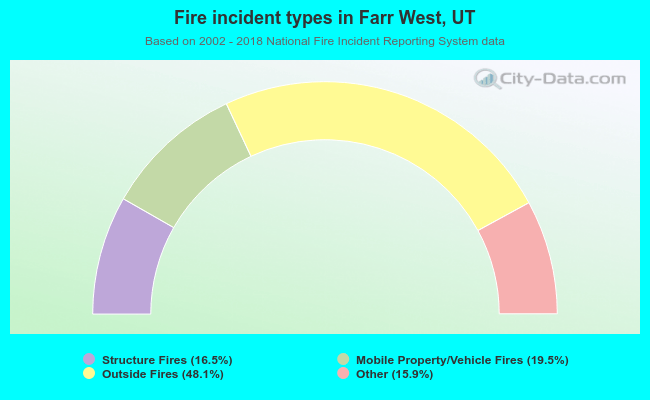 When looking into fire subcategories, the most incidents belonged to: Outside Fires (48.1%), and Mobile Property/Vehicle Fires (19.5%).