Elwood: Fire Incidents, Illinois (IL)
Where are fire incidents reported in Elwood, IL
Something went wrong! Please refresh the page.
|
| |||||||||||||||||||||||||||||||||||||||||||||||||||||||||||||||||||||||||||||||||||||||||||||||||||||||||||||
2002 - 2018 National Fire Incident Reporting System (NFIRS) incidents
- Incident types reported to NFIRS in Elwood, IL
- 1,57934.8%Rescue & EMS
- 75116.6%Service Call
- 74716.5%False Alarm
- 59113.0%Fire
- 4439.8%Good Intent Call
- 4119.1%Hazardous Condition
- 90.2%Special Incident
- Fire incident types reported to NFIRS in Elwood, IL
- 22838.6%Structure Fires
- 19933.7%Outside Fires
- 12521.2%Mobile Property/Vehicle Fires
- 396.6%Other
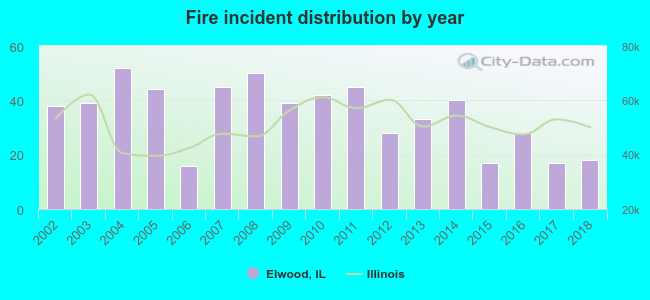 According to the data from the years 2002 - 2018 the average number of fires per year is 35. The highest number of fire incidents - 52 took place in 2004, and the least - 16 in 2006. The data has a dropping trend.
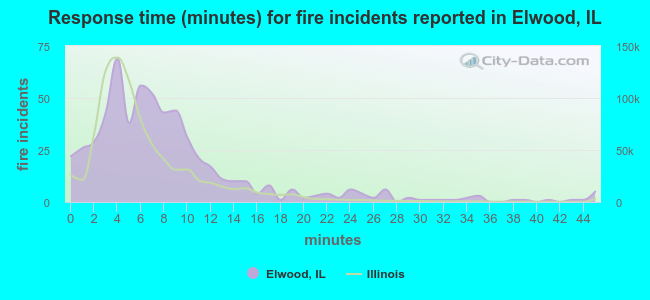 The median response time based on all reported fire incidents is 7 minutes. This is higher compared to the state median value.
The median response time in Elwood, IL compared to nearest cities:
(Note: Based on data for all years, including only cities with at least 500 fire incidents)
| Elwood: | 7 minutes |
| Channahon: | 7 minutes |
| Manhattan: | 6 minutes |
| Wilmington: | 9 minutes |
| Joliet: | 5 minutes |
| Minooka: | 7 minutes |
| Shorewood: | 5 minutes |
| New Lenox: | 6 minutes |
| Crest Hill: | 5 minutes |
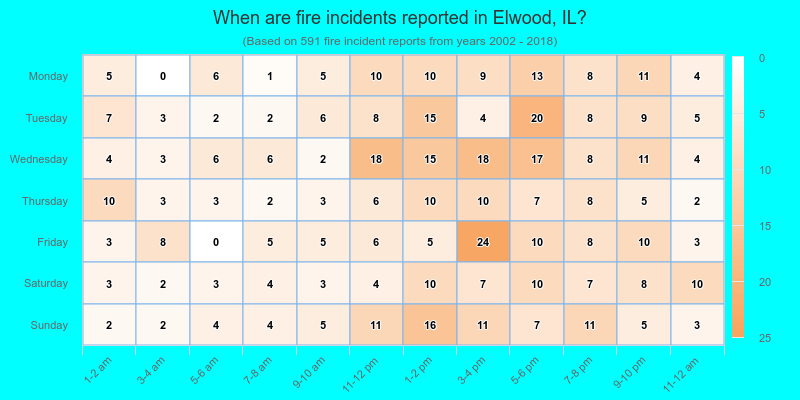
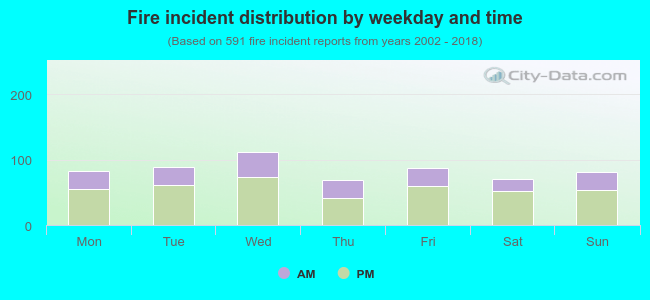 33.0% incidents where reported in the morning and 67.0% in the evening. The most fires (19.0%) took place on Wednesday, and the least (11.7%) on Thursday.
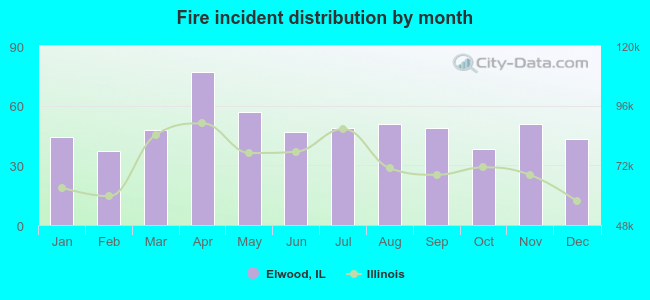 According to the 591 fire incident reports from years 2002 - 2018 most fires (13.0%) took place during April, and the least (6.3%) in February.
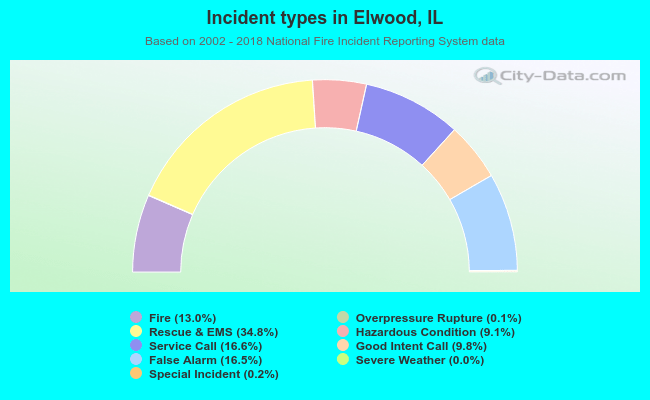 Out of all 4,537 cases reported during the years 2002 - 2018, the most belonged to the categories: Rescue & EMS (34.8%), Service Call (16.6%), and False Alarm (16.5%).
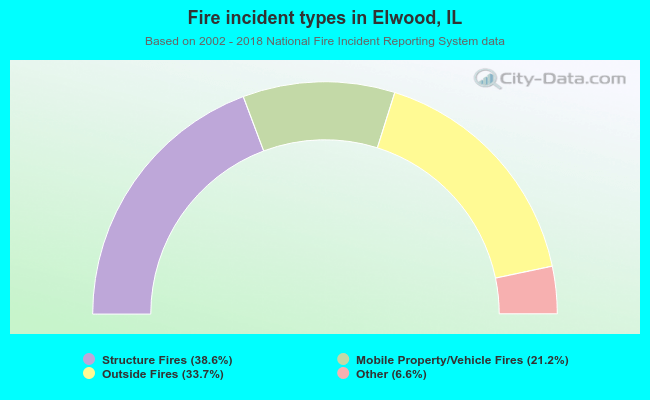 When looking into fire subcategories, the most incidents belonged to: Structure Fires (38.6%), and Outside Fires (33.7%).