Crest Hill: Fire Incidents, Illinois (IL)
Where are fire incidents reported in Crest Hill, IL
Something went wrong! Please refresh the page.
| Fire incidents reported | |
|---|---|
| Sreet name | Count |
| PLAINFIELD RD | 120 |
| CATON FARM RD | 114 |
| ARBOR LANE | 74 |
| LARKIN AVE | 62 |
| PIONEER RD | 60 |
| THEODORE ST | 52 |
| WILLOW CIRCLE DR | 52 |
| CEDARWOOD DR | 48 |
| BROADWAY ST | 42 |
| MARLBORO LANE | 40 |
| ARBOR LN | 32 |
| PIONEER | 32 |
| BRIAN DR | 30 |
| RENWICK RD | 30 |
| WEBER RD | 28 |
| CENTER ST | 20 |
| GAYLORD RD | 20 |
| KELLY AVE | 20 |
| BROADWAY | 18 |
| PASADENA AVE | 16 |
| WATERFORD DR | 16 |
| MARLBORO LN | 14 |
| ROCK RUN DR | 14 |
| ROOT ST | 14 |
| WILCOX ST | 14 |
| ASTER DR | 12 |
| BICENTENNIAL DR | 12 |
| CLUB CT | 12 |
| GENSTAR LANE | 12 |
| HICKORY ST | 12 |
2002 - 2018 National Fire Incident Reporting System (NFIRS) incidents
- Incident types reported to NFIRS in Crest Hill, IL
- 8,03663.1%Rescue & EMS
- 1,2379.7%False Alarm
- 1,1889.3%Service Call
- 9827.7%Hazardous Condition
- 8736.9%Fire
- 3893.1%Good Intent Call
- 190.1%Overpressure Rupture
- Fire incident types reported to NFIRS in Crest Hill, IL
- 38444.0%Structure Fires
- 32136.8%Outside Fires
- 13615.6%Mobile Property/Vehicle Fires
- 323.7%Other
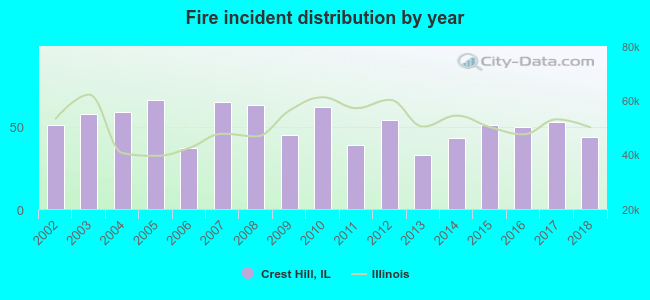 Based on the data from the years 2002 - 2018 the average number of fires per year is 51. The highest number of fire incidents - 66 took place in 2005, and the least - 33 in 2013. The data has a dropping trend.
The average number of yearly fire incidents per 10k residents in Crest Hill, IL compared to nearest cities:
(Note: Based on data for the last 3 years, including only cities with population 5,000 and above)
| Crest Hill: | 23.6 |
| Joliet: | 28.1 |
| Lockport: | 43.1 |
| Romeoville: | 31.3 |
| Plainfield: | 40.4 |
| Shorewood: | 36.6 |
| New Lenox: | 36.1 |
| Homer Glen: | 31.7 |
| Bolingbrook: | 23.8 |
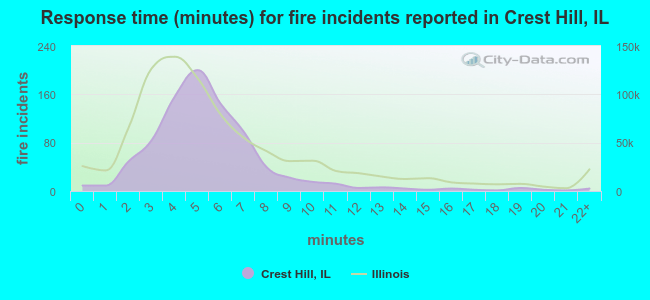 The median response time based on all reported fire incidents is 5 minutes. This is close to the state median value.
The median response time in Crest Hill, IL compared to nearest cities:
(Note: Based on data for all years, including only cities with at least 500 fire incidents)
| Crest Hill: | 5 minutes |
| Joliet: | 5 minutes |
| Lockport: | 5 minutes |
| Romeoville: | 5 minutes |
| Plainfield: | 6 minutes |
| Shorewood: | 5 minutes |
| New Lenox: | 6 minutes |
| Homer Glen: | 6 minutes |
| Bolingbrook: | 5 minutes |
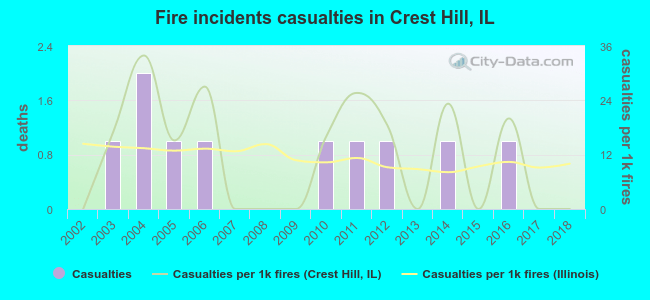 Based on the data from the years 2002 - 2018 the average number of fire-related yearly casualties is 1. The highest number of injuries - 2 took place in 2004, and the lowest - 0 in 2002. The data has a constant trend.
The average number of casualties per 1,000 fire incidents is 12. This indicator was the highest - 34 in 2004, and the lowest 0 in 2002. The trend for casualties per 1,000 fires is constant. Compared to the state value the number of casualties per 1,000 fires is about the same.
Based on the data from the years 2002 - 2018 the average number of fire-related yearly casualties is 1. The highest number of injuries - 2 took place in 2004, and the lowest - 0 in 2002. The data has a constant trend.
The average number of casualties per 1,000 fire incidents is 12. This indicator was the highest - 34 in 2004, and the lowest 0 in 2002. The trend for casualties per 1,000 fires is constant. Compared to the state value the number of casualties per 1,000 fires is about the same.Casualties per 1,000 incidents in Crest Hill, IL compared to nearest cities:
(Note: Based on data for all years, including only cities with at least 500 fire incidents)
| Crest Hill: | 11.5 |
| Joliet: | 4.2 |
| Lockport: | 16.0 |
| Romeoville: | 12.2 |
| Plainfield: | 8.0 |
| Shorewood: | 7.2 |
| New Lenox: | 3.6 |
| Homer Glen: | 8.4 |
| Bolingbrook: | 20.8 |
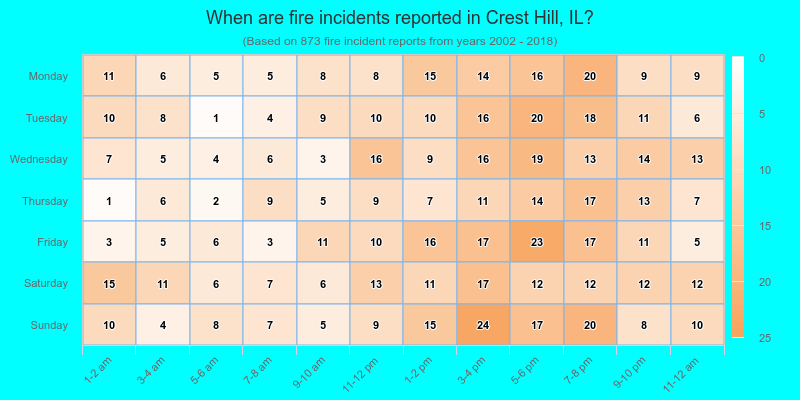
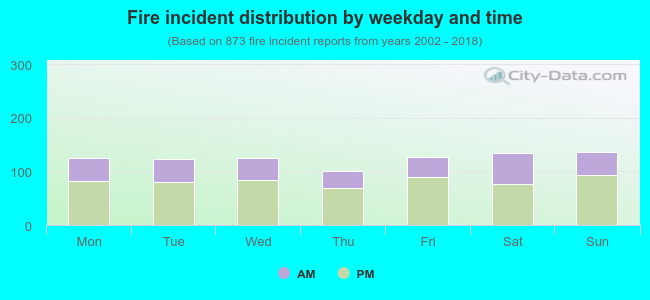 34.0% incidents where reported in the morning and 66.0% in the evening. The most fires (15.7%) took place on Sunday, and the least (11.6%) on Thursday.
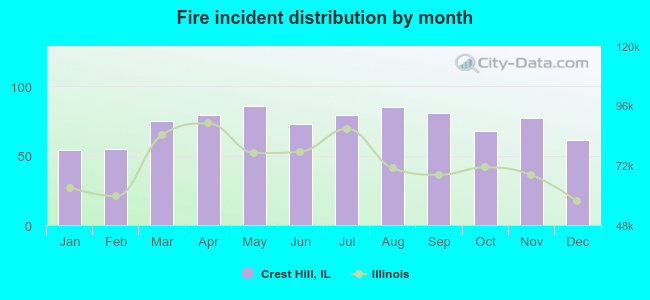 Based on the 873 incident reports from years 2002 - 2018 most fires (9.9%) took place during May, and the least (6.2%) in January.
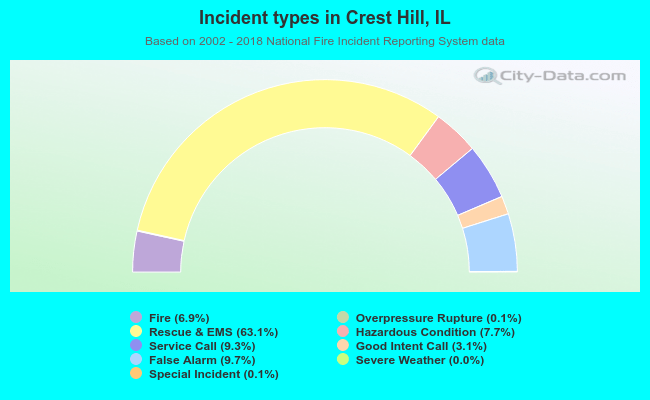 Out of all 12,733 cases reported during the years 2002 - 2018, the most belonged to the categories: Rescue & EMS (63.1%), False Alarm (9.7%), and Service Call (9.3%).
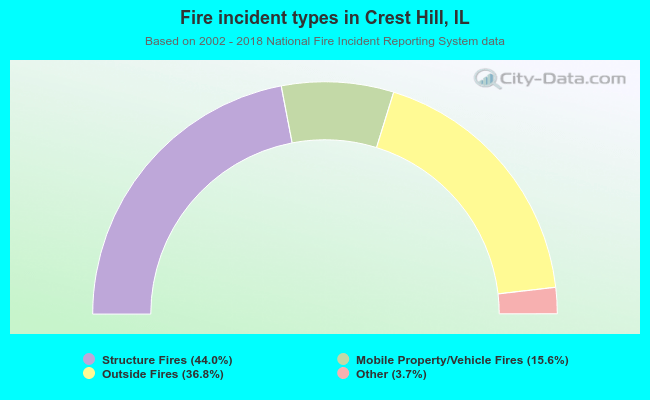 When looking into fire subcategories, the most incidents belonged to: Structure Fires (44.0%), and Outside Fires (36.8%).