Eloy: Fire Incidents, Arizona (AZ)
Where are fire incidents reported in Eloy, AZ
Something went wrong! Please refresh the page.
| Fire incidents reported | |
|---|---|
| Sreet name | Count |
| INTERSTATE 10 | 404 |
| SUNSHINE BLVD | 146 |
| HIGHWAY 87 | 124 |
| SUNLAND GIN RD | 108 |
| MAIN ST | 94 |
| TOLTEC RD | 72 |
| D ST | 70 |
| ALSDORF RD | 62 |
| ESTRELLA RD | 58 |
| BATTAGLIA RD | 56 |
| HOUSER RD | 52 |
| HANNA RD | 46 |
| HIGHWAY 84 | 46 |
| ALSDORF | 44 |
| 11 MILE CORNER RD | 42 |
| INTERSTATE 10 HWY | 38 |
| FRONTIER | 34 |
| BATTAGLIA | 30 |
| SHEDD RD | 30 |
| 14TH ST | 26 |
| 4TH ST | 26 |
| 5TH ST | 26 |
| 13TH ST | 24 |
| 1ST ST | 24 |
| LAPALMA | 24 |
| MYERS BLVD | 24 |
| PHOENIX AVE | 24 |
| CHAMBERS ST | 22 |
| SANTA CRUZ | 22 |
| 3RD PL | 18 |
2003 - 2018 National Fire Incident Reporting System (NFIRS) incidents
- Incident types reported to NFIRS in Eloy, AZ
- 8,01771.0%Rescue & EMS
- 1,64614.6%Fire
- 4574.0%False Alarm
- 4353.9%Hazardous Condition
- 3993.5%Service Call
- 3292.9%Good Intent Call
- Fire incident types reported to NFIRS in Eloy, AZ
- 96458.6%Outside Fires
- 35121.3%Mobile Property/Vehicle Fires
- 28617.4%Structure Fires
- 452.7%Other
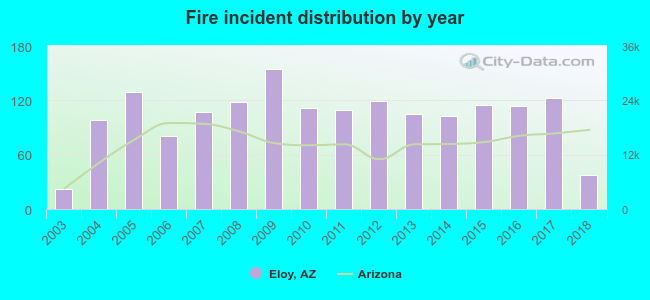 According to the data from the years 2003 - 2018 the average number of fire incidents per year is 103. The highest number of fire incidents - 155 took place in 2009, and the least - 22 in 2003. The data has a rising trend.
The average number of yearly fire incidents per 10k residents in Eloy, AZ compared to nearest cities:
(Note: Based on data for the last 3 years, including only cities with population 5,000 and above)
| Eloy: | 54.6 |
| Arizona City: | 29.1 |
| Casa Grande: | 35.5 |
| Coolidge: | 51.9 |
| Florence: | 5.7 |
| Gila River: | 1.4 |
| San Tan Valley: | 0.3 |
| Maricopa: | 8.4 |
| Queen Creek: | 21.4 |
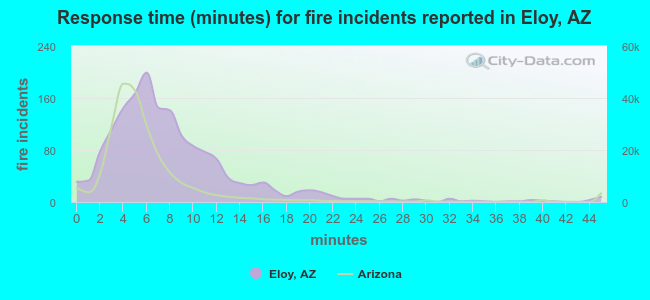 The median response time based on all reported fire incidents is 7 minutes. This is higher compared to the Arizona median value.
The median response time in Eloy, AZ compared to nearest cities:
(Note: Based on data for all years, including only cities with at least 500 fire incidents)
| Eloy: | 7 minutes |
| Casa Grande: | 6 minutes |
| Coolidge: | 6 minutes |
| Florence: | 7 minutes |
| Queen Creek: | 6 minutes |
| Marana: | 7 minutes |
| Chandler: | 5 minutes |
| Gilbert: | 5 minutes |
| Apache Junction: | 6 minutes |
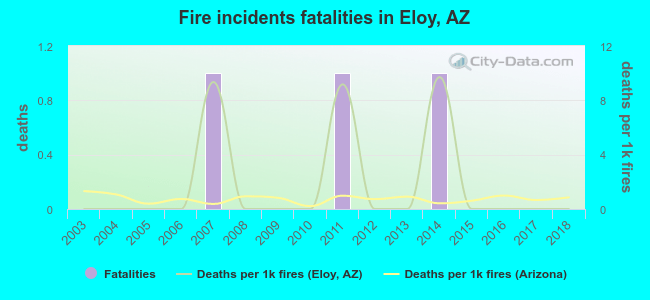 Based on the reports from the years 2003 - 2018 the average number of fire-related fatalities per year is 0. The highest number of deaths - 1 took place in 2007, and the lowest - 0 in 2003. The data has a constant trend.
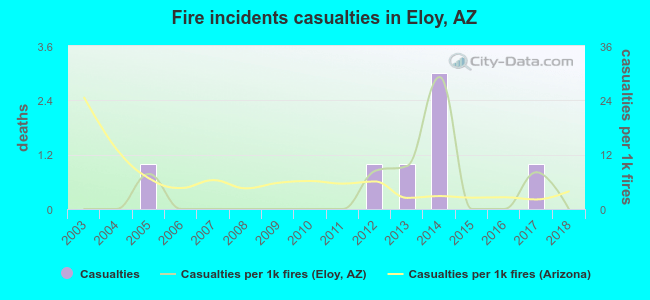 Based on the data from the years 2003 - 2018 the average number of fire-related casualties per year is 0. The highest number of casualties - 3 took place in 2014, and the lowest - 0 in 2003. The data has a constant trend.
The average number of casualties per 1,000 fire incidents is 4. This indicator was the highest - 29 in 2014, and the lowest 0 in 2003. The trend for injuries per 1,000 fires is constant. Compared to the Arizona value the number of injuries per 1,000 fires is lower.
Based on the data from the years 2003 - 2018 the average number of fire-related casualties per year is 0. The highest number of casualties - 3 took place in 2014, and the lowest - 0 in 2003. The data has a constant trend.
The average number of casualties per 1,000 fire incidents is 4. This indicator was the highest - 29 in 2014, and the lowest 0 in 2003. The trend for injuries per 1,000 fires is constant. Compared to the Arizona value the number of injuries per 1,000 fires is lower.Casualties per 1,000 incidents in Eloy, AZ compared to nearest cities:
(Note: Based on data for all years, including only cities with at least 500 fire incidents)
| Eloy: | 4.3 |
| Casa Grande: | 3.5 |
| Coolidge: | 5.1 |
| Florence: | 1.7 |
| Queen Creek: | 1.5 |
| Marana: | 2.8 |
| Chandler: | 1.8 |
| Gilbert: | 5.0 |
| Apache Junction: | 25.6 |
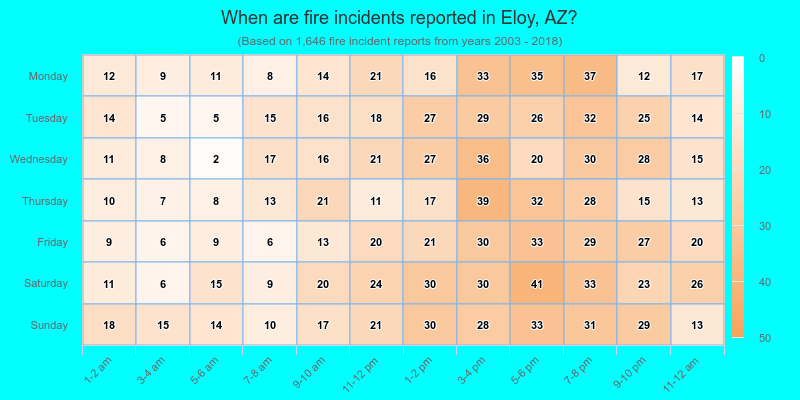
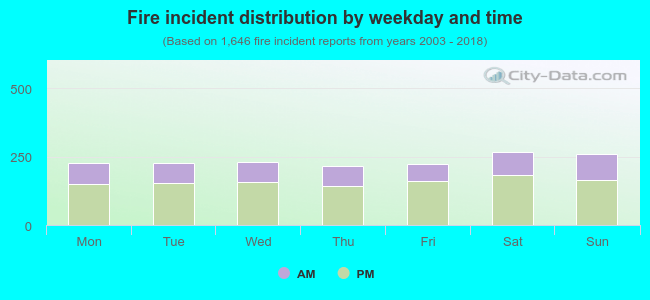 32.6% incidents where reported in the morning and 67.4% in the evening. The most fires (16.3%) took place on Saturday, and the least (13.0%) on Thursday.
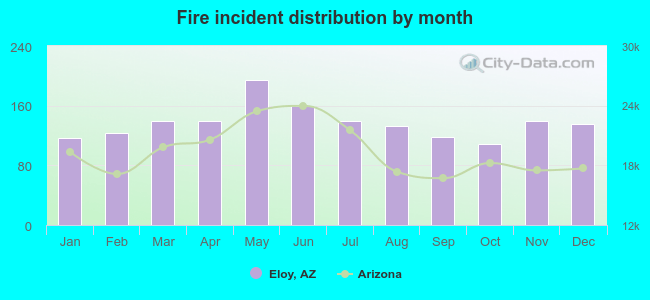 According to the 1,646 fires from years 2003 - 2018 most fires (11.8%) took place during May, and the least (6.6%) in October.
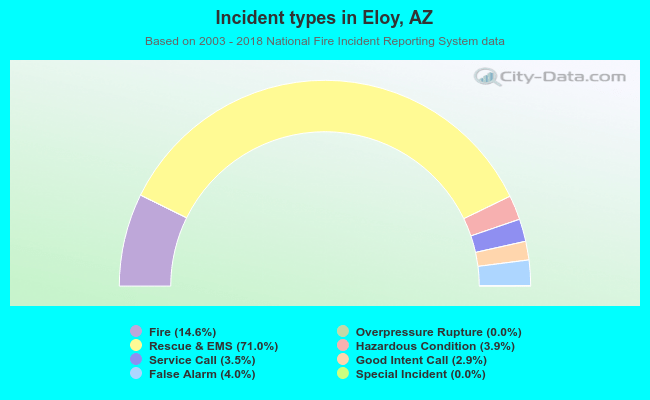 Out of all 11,286 cases reported during the years 2003 - 2018, the most belonged to the categories: Rescue & EMS (71.0%), Fire (14.6%), and False Alarm (4.0%).
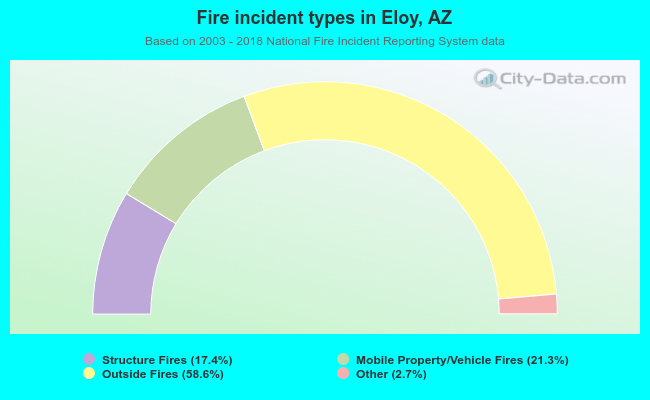 When looking into fire subcategories, the most incidents belonged to: Outside Fires (58.6%), and Mobile Property/Vehicle Fires (21.3%).