East Falmouth: Fire Incidents, Massachusetts (MA)
Where are fire incidents reported in East Falmouth, MA
Something went wrong! Please refresh the page.
|
| |||||||||||||||||||||||||||||||||||||||||||||||||||||||||||||||||||||||||||||||||||||||||||||||||||||||||||||
2002 - 2018 National Fire Incident Reporting System (NFIRS) incidents
- Incident types reported to NFIRS in East Falmouth, MA
- 4,63773.1%Rescue & EMS
- 4757.5%Fire
- 4236.7%False Alarm
- 3054.8%Good Intent Call
- 2814.4%Hazardous Condition
- 2063.2%Service Call
- 110.2%Special Incident
- Fire incident types reported to NFIRS in East Falmouth, MA
- 19641.3%Outside Fires
- 16835.4%Structure Fires
- 9319.6%Mobile Property/Vehicle Fires
- 183.8%Other
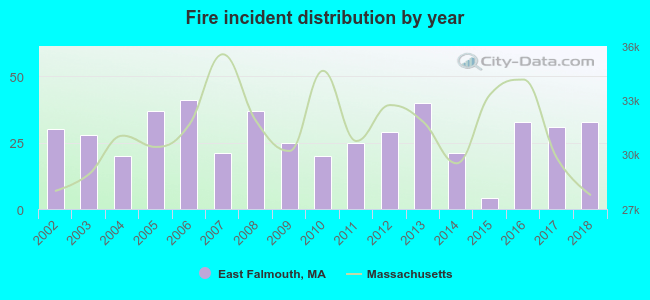 According to the data from the years 2002 - 2018 the average number of fires per year is 28. The highest number of fire incidents - 41 took place in 2006, and the least - 4 in 2015. The data has a growing trend.
The average number of yearly fire incidents per 10k residents in East Falmouth, MA compared to nearest cities:
(Note: Based on data for the last 3 years, including only cities with population 5,000 and above)
| East Falmouth: | 53.5 |
| Mashpee: | 34.7 |
| Mattapoisett: | 32.5 |
| Wareham: | 46.6 |
| West Yarmouth: | 31.6 |
| Fairhaven: | 30.2 |
| Yarmouth: | 2.4 |
| South Yarmouth: | 34.9 |
| Yarmouth Port: | 16.3 |
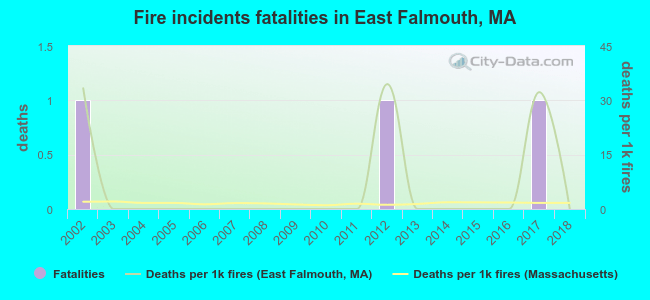 Based on the data from the years 2002 - 2018 the average number of fire-related yearly deaths is 0. The highest number of deaths - 1 took place in 2002, and the lowest - 0 in 2003. The data has a decreasing trend.
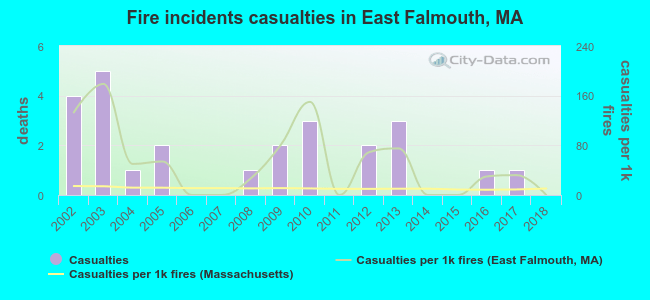 According to the data from the years 2002 - 2018 the average number of fire-related casualties per year is 1. The highest number of casualties - 5 took place in 2003, and the lowest - 0 in 2006. The data has a declining trend.
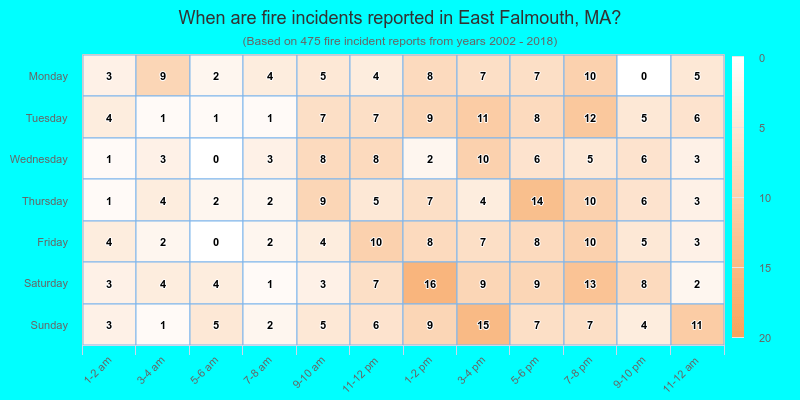
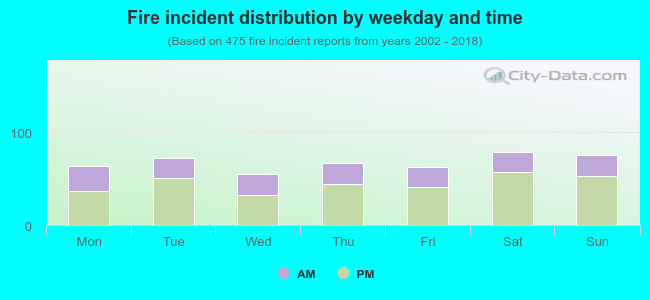 33.7% incidents where reported in the morning and 66.3% in the evening. The most fires (16.6%) took place on Saturday, and the least (11.6%) on Wednesday.
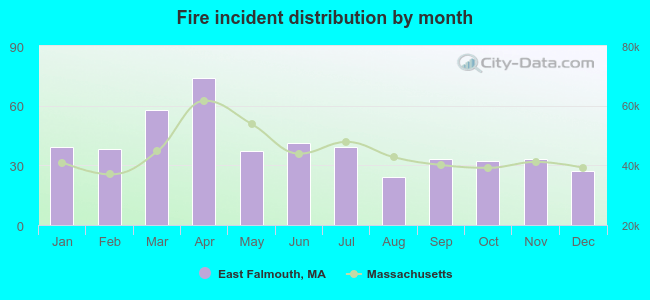 Based on the 475 reports from years 2002 - 2018 most fires (15.6%) took place during April, and the least (5.1%) in August.
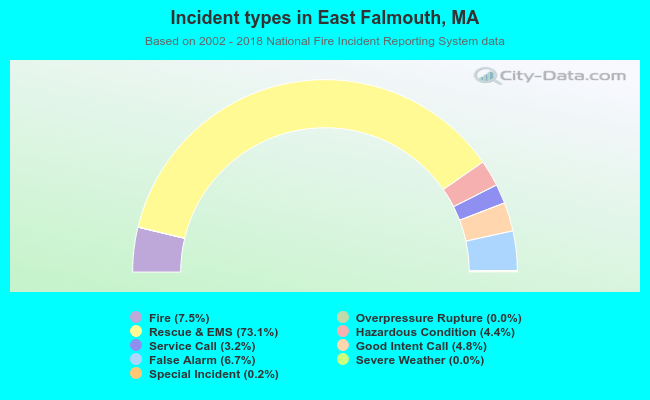 Out of all 6,342 cases reported during the years 2002 - 2018, the most belonged to the categories: Rescue & EMS (73.1%), Fire (7.5%), and False Alarm (6.7%).
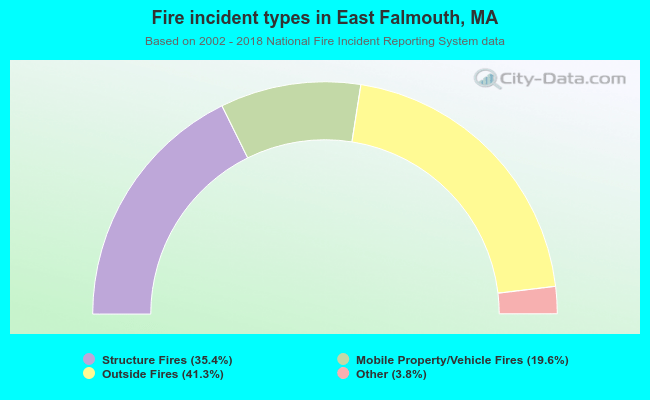 When looking into fire subcategories, the most reports belonged to: Outside Fires (41.3%), and Structure Fires (35.4%).