Wareham: Fire Incidents, Massachusetts (MA)
Where are fire incidents reported in Wareham, MA
Something went wrong! Please refresh the page.
| Fire incidents reported | |
|---|---|
| Sreet name | Count |
| CRANBERRY HWY | 604 |
| MAIN ST | 218 |
| MARION RD | 92 |
| 25 RT | 84 |
| HIGH ST | 68 |
| CHARGE POND RD | 62 |
| STATE ST | 62 |
| 495 RT | 60 |
| SANDWICH RD | 50 |
| 195 RT | 48 |
| SWIFTS BEACH RD | 48 |
| CRANBERRY HWY | 46 |
| MINOT AVE | 40 |
| GLEN CHARLIE RD | 38 |
| HATHAWAY ST | 36 |
| CROMESETT RD | 32 |
| SWIFT'S BEACH RD | 32 |
| KENDRICK RD | 30 |
| TOBEY RD | 28 |
| INDIAN NECK RD | 26 |
| GREAT NECK RD | 24 |
| GIBBS AVE | 20 |
| OAK ST | 20 |
| TIHONET RD | 20 |
| VIKING DR | 20 |
| BARKER RD | 18 |
| CHURCH AVE | 18 |
| WARR AVE | 18 |
| BROWN ST | 16 |
| DEPOT ST | 16 |
2002 - 2018 National Fire Incident Reporting System (NFIRS) incidents
- Incident types reported to NFIRS in Wareham, MA
- 6,46035.9%Rescue & EMS
- 4,92827.4%Hazardous Condition
- 1,7889.9%Service Call
- 1,6449.1%Fire
- 1,6108.9%False Alarm
- 1,4748.2%Good Intent Call
- 480.3%Special Incident
- 340.2%Overpressure Rupture
- 200.1%Severe Weather
- Fire incident types reported to NFIRS in Wareham, MA
- 67841.2%Structure Fires
- 60536.8%Outside Fires
- 28517.3%Mobile Property/Vehicle Fires
- 764.6%Other
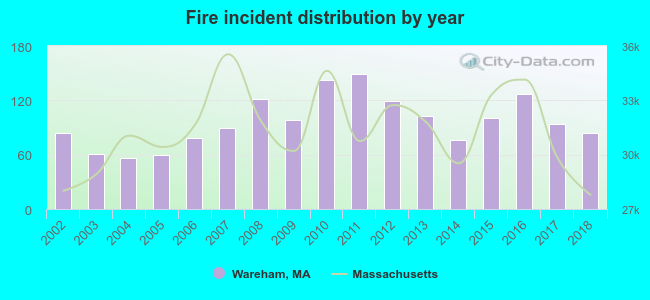 According to the data from the years 2002 - 2018 the average number of fire incidents per year is 97. The highest number of reported fire incidents - 149 took place in 2011, and the least - 56 in 2004. The data has a constant trend.
The average number of yearly fire incidents per 10k residents in Wareham, MA compared to nearest cities:
(Note: Based on data for the last 3 years, including only cities with population 5,000 and above)
| Wareham: | 46.6 |
| Rochester: | 13.4 |
| Carver: | 4.9 |
| Mattapoisett: | 32.5 |
| Acushnet: | 21.7 |
| Fairhaven: | 30.2 |
| Plymouth: | 294.0 |
| Middleborough: | 34.8 |
| Mashpee: | 34.7 |
 The median response time based on all reported fire incidents is 6 minutes. This is higher compared to the state median value.
The median response time in Wareham, MA compared to nearest cities:
(Note: Based on data for all years, including only cities with at least 500 fire incidents)
| Wareham: | 6 minutes |
| Onset: | 3 minutes |
| Sandwich: | 6 minutes |
| Fairhaven: | 3 minutes |
| Plymouth: | 5 minutes |
| East Sandwich: | 8 minutes |
| Middleborough: | 5 minutes |
| Mashpee: | 7 minutes |
| New Bedford: | 4 minutes |
 Based on the reports from the years 2002 - 2018 the average number of fire-related yearly casualties is 2. The highest number of reported injuries - 8 took place in 2011, and the lowest - 0 in 2003. The data has a constant trend.
The average number of casualties per 1,000 fires is 23. This indicator was the highest - 54 in 2011, and the lowest 0 in 2003. The trend for injuries per 1,000 fire incidents is constant. Compared to the Massachusetts value the number of casualties per 1,000 fire incidents is much higher.
Based on the reports from the years 2002 - 2018 the average number of fire-related yearly casualties is 2. The highest number of reported injuries - 8 took place in 2011, and the lowest - 0 in 2003. The data has a constant trend.
The average number of casualties per 1,000 fires is 23. This indicator was the highest - 54 in 2011, and the lowest 0 in 2003. The trend for injuries per 1,000 fire incidents is constant. Compared to the Massachusetts value the number of casualties per 1,000 fire incidents is much higher.Casualties per 1,000 incidents in Wareham, MA compared to nearest cities:
(Note: Based on data for all years, including only cities with at least 500 fire incidents)
| Wareham: | 25.5 |
| Onset: | 28.4 |
| Sandwich: | 18.4 |
| Fairhaven: | 25.7 |
| Plymouth: | 24.5 |
| East Sandwich: | 29.8 |
| Middleborough: | 7.5 |
| Mashpee: | 26.7 |
| New Bedford: | 21.2 |
 29.4% incidents where reported in the morning and 70.6% in the evening. The most fires (16.1%) took place on Saturday, and the least (12.9%) on Wednesday.
 Based on the 1,644 incident reports from years 2002 - 2018 most fires (12.6%) took place during July, and the least (5.5%) in October.
 Out of all 18,006 cases reported during the years 2002 - 2018, the most belonged to the categories: Rescue & EMS (35.9%), Hazardous Condition (27.4%), and Service Call (9.9%).
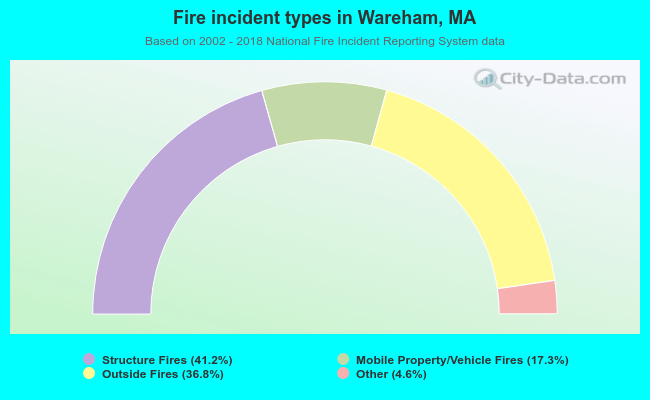 When looking into fire subcategories, the most reports belonged to: Structure Fires (41.2%), and Outside Fires (36.8%).