| Fire incidents reported |
|---|
| Sreet name | Count |
|---|
| SOMERS COVE APARTMENTS | 36 | | CRISFIELD HWY | 30 | | OLD STATE ROAD RD | 28 | | CASH CORNER RD | 26 | | SACKERTOWN ROAD RD | 24 | | LAWSON BARNES RD | 20 | | MAIN STREET ST | 20 | | OLD STATE RD | 20 | | SOMERSET AVENUE AVE | 20 | | CALVARY ROAD RD | 18 | | CASH CORNER ROAD RD | 18 | | JACKSONVILLE ROAD RD | 18 | | LAWSONIA RD | 18 | | COVE STREET | 16 | | JOHNSON CREEK ROAD RD | 16 | | LAWSON BARNES ROAD RD | 16 | | BOONE ROAD RD | 14 | | BYRDTOWN RD | 14 | | CRISFIELD HIGHWAY HWY | 14 | | JOHNSON CREEK RD | 14 | | MAIN ST | 14 | | MARYLAND AVENUE AVE | 14 | | SACKERTOWN RD | 14 | | BOONE RD | 10 | | BYRDTOWN ROAD | 10 |
| | | Fire incidents reported |
|---|
| Sreet name | Count |
|---|
| CHESAPEAKE AVENUE AVE | 10 | | COVE ST | 10 | | COVE STREET ST | 10 | | JACKSONVILLE RD | 10 | | LAWSONIA ROAD | 10 | | LAWSONIA ROAD RD | 10 | | PEAR STREET ST | 10 | | SOMERSET AVE | 10 | | WILLIAM MADDOX RD | 10 | | ASBURY AVE | 8 | | CALVARY RD | 8 | | CASH CORNER ROAD | 8 | | CRISFIELD/MARION RD | 8 | | MAPLE STREET ST | 8 | | OLD STATE ROAD | 8 | | PHOENIX CHURCH RD | 8 | | RICHARDSON AVE | 8 | | WILLIAM MADDOX ROAD RD | 8 | | 7TH ST | 6 | | APE HOLE ROAD RD | 6 | | BYRDTOWN ROAD RD | 6 | | CALVARY ROAD | 6 | | COUNTRY CLUB RD | 6 | | CRISFIELD HIGHWAY | 6 | | CRISFIELD MARION ROAD RD | 6 |
|
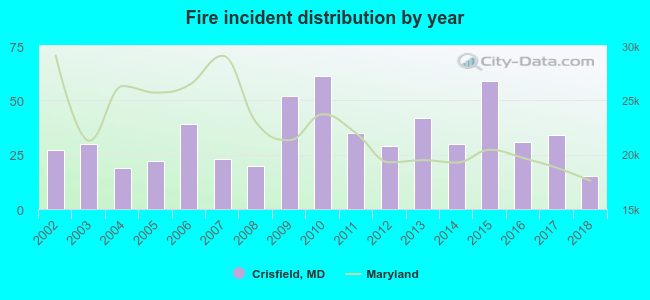 Based on the data from the years 2002 - 2018 the average number of fires per year is 33. The highest number of fires - 61 took place in 2010, and the least - 15 in 2018. The data has a declining trend.
 The median response time based on all reported fire incidents is 9 minutes. This is higher compared to the Maryland median value.
 33.1% incidents where reported in the morning and 66.9% in the evening. The most fires (15.7%) took place on Monday, and the least (12.0%) on Friday.
 Based on the 568 fire incident reports from years 2002 - 2018 most fires (12.0%) took place during September, and the least (4.6%) in December.
 Out of all 1,386 cases reported during the years 2002 - 2018, the most belonged to the categories: Fire (41.0%), Good Intent Call (26.2%), and Hazardous Condition (12.0%).
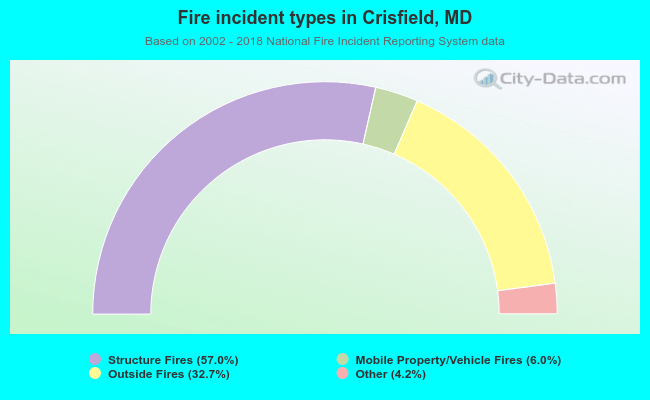 When looking into fire subcategories, the most reports belonged to: Structure Fires (57.0%), and Outside Fires (32.7%).