| Fire incidents reported |
|---|
| Sreet name | Count |
|---|
| HARDING BLVD | 18 | | COTTER RD | 12 | | SOUTH AVE | 12 | | WALNUT HILL LN | 12 | | MCLEAN AVE | 10 | | RAINBOW LANDING DR | 10 | | DENTON FERRY RD | 8 | | 1108 HARDING BLVD | 6 | | 152 LUCILLE STREET | 6 | | COMBS AVE | 6 | | CR 174 | 6 | | CR 703 | 6 | | DALTON AVE | 6 | | DENTON FERRY ROAD | 6 | | POWELL AVE | 6 | | POWELL ST | 6 | | WHITMILL AVE | 6 | | 144 SOUTH PLACE | 4 | | 1815 HARDING BLVD | 4 | | 1815 HARDING BLVD. | 4 | | 201 POWELL STREET | 4 | | 669 RAINBOW LANDING DRIVE | 4 | | BAYLESS ISLAND | 4 | | DENTON FERRY ROAD | 4 | | HIGHWAY 62 | 4 |
| | | Fire incidents reported |
|---|
| Sreet name | Count |
|---|
| MAIN ST | 4 | | POWELL | 4 | | SIXTH ST | 4 | | TYLER AVE | 4 | | WALLICK DR | 4 | | WHITMILL LN | 4 | | 0 COTTER ROAD | 2 | | 109 BAXTER COUNTY 889 | 2 | | 117 WOOD DUCK LN | 2 | | 1177 W MAIN STREET | 2 | | 119 WALLACE ORCH | 2 | | 1200 WEST MAIN STREET | 2 | | 1348 COTTER RD | 2 | | 1348 E COTTER RD | 2 | | 1420 HARDING | 2 | | 1420 HARDING BLVD | 2 | | 143 POWELL | 2 | | 148 CEDAR ST | 2 | | 152 LUCILLE ST | 2 | | 1715 BAXTER COUNTY 709 | 2 | | 179 MEMORY ACROSS FROM LN | 2 | | 207 SUNSET DR | 2 | | 2100 COTTER ROAD | 2 | | 221 RAINBOW HEIGHTS DRIVE | 2 | | |
|
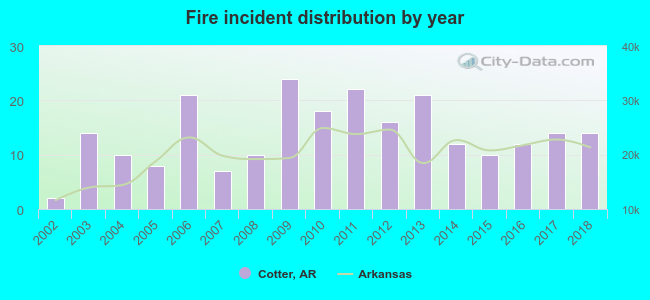 Based on the data from the years 2002 - 2018 the average number of fires per year is 14. The highest number of fire incidents - 24 took place in 2009, and the least - 2 in 2002. The data has a rising trend.
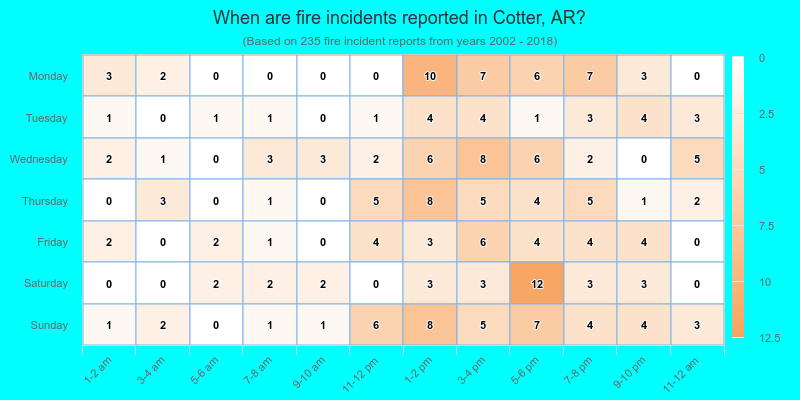
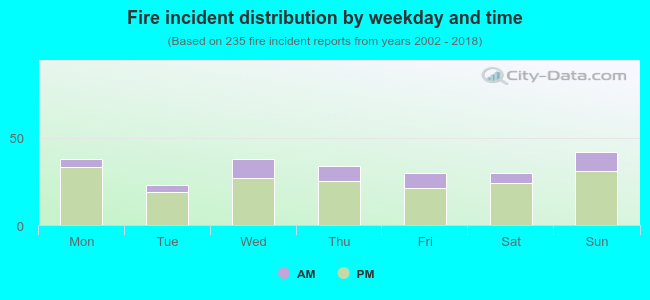 23.4% incidents where reported in the morning and 76.6% in the evening. The most fires (17.9%) took place on Sunday, and the least (9.8%) on Tuesday.
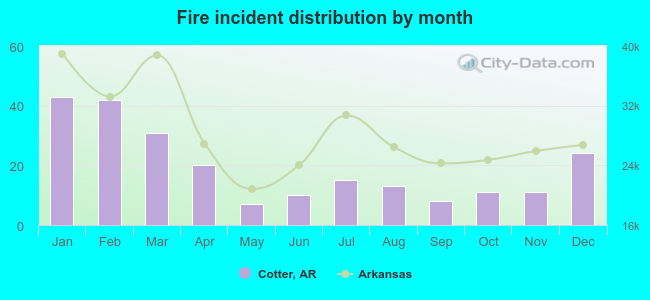 Based on the 235 reports from years 2002 - 2018 most fires (18.3%) took place during January, and the least (3.0%) in May.
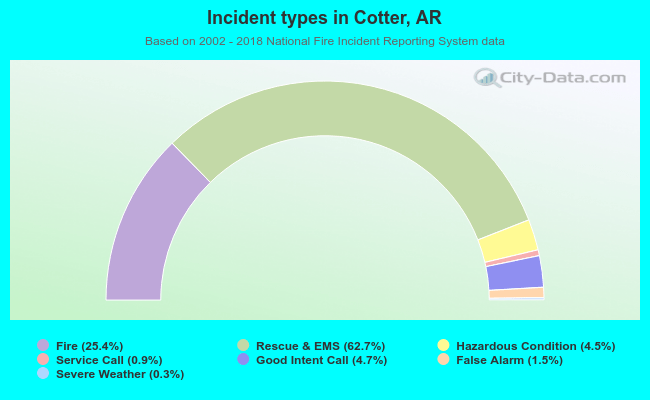 Out of all 924 cases reported during the years 2002 - 2018, the most belonged to the categories: Overpressure Rupture (62.7%), Fire (25.4%), and Service Call (4.7%).
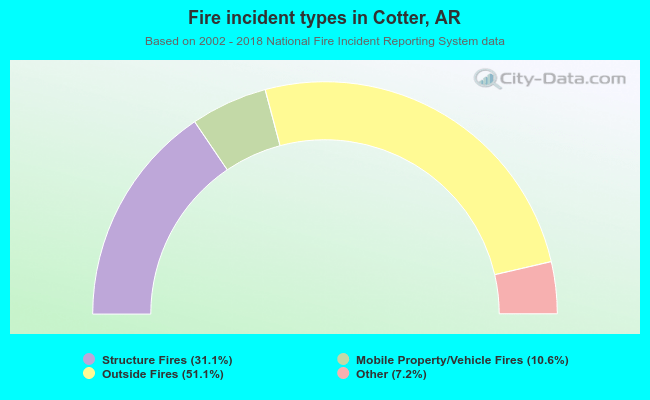 When looking into fire subcategories, the most reports belonged to: Outside Fires (51.1%), and Structure Fires (31.1%).