Center: Fire Incidents, Texas (TX)
Where are fire incidents reported in Center, TX
Something went wrong! Please refresh the page.
|
| |||||||||||||||||||||||||||||||||||||||||||||||||||||||||||||||||||||||||||||||||||||||||||||||||||||||||||||
| Other | 603 | |||||||||||||||||||||||||||||||||||||||||||||||||||||||||||||||||||||||||||||||||||||||||||||||||||||||||||||
2002 - 2018 National Fire Incident Reporting System (NFIRS) incidents
- Incident types reported to NFIRS in Center, TX
- 1,22959.9%Fire
- 23111.3%Hazardous Condition
- 21510.5%Rescue & EMS
- 1205.8%False Alarm
- 1145.6%Good Intent Call
- 1025.0%Service Call
- 351.7%Overpressure Rupture
- 50.2%Special Incident
- Fire incident types reported to NFIRS in Center, TX
- 64052.1%Outside Fires
- 37230.3%Structure Fires
- 18014.6%Mobile Property/Vehicle Fires
- 373.0%Other
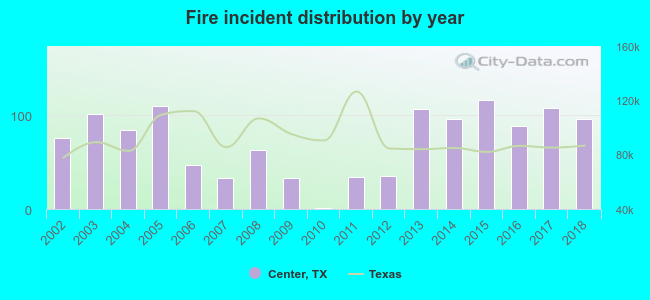 Based on the data from the years 2002 - 2018 the average number of fire incidents per year is 72. The highest number of fires - 116 took place in 2015, and the least - 1 in 2010. The data has a rising trend.
The average number of yearly fire incidents per 10k residents in Center, TX compared to nearest cities:
(Note: Based on data for the last 3 years, including only cities with population 5,000 and above)
| Center: | 186.7 |
| Carthage: | 64.5 |
| Nacogdoches: | 73.1 |
| Henderson: | 177.9 |
| Lufkin: | 50.6 |
| Pollok: | 3.7 |
| Marshall: | 79.8 |
| Diboll: | 1.9 |
| Rusk: | 1.8 |
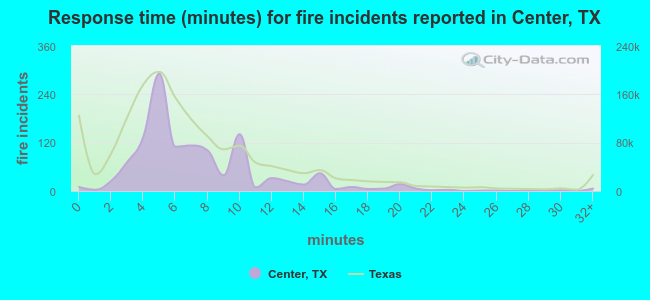 The median response time based on all reported fire incidents is 6 minutes. This is comparable to the Texas median value.
The median response time in Center, TX compared to nearest cities:
(Note: Based on data for all years, including only cities with at least 500 fire incidents)
| Center: | 6 minutes |
| San Augustine: | 10 minutes |
| Carthage: | 6 minutes |
| Nacogdoches: | 7 minutes |
| Mansfield: | 6 minutes |
| Henderson: | 7 minutes |
| Lufkin: | 5 minutes |
| Waskom: | 8 minutes |
| Coushatta: | 9 minutes |
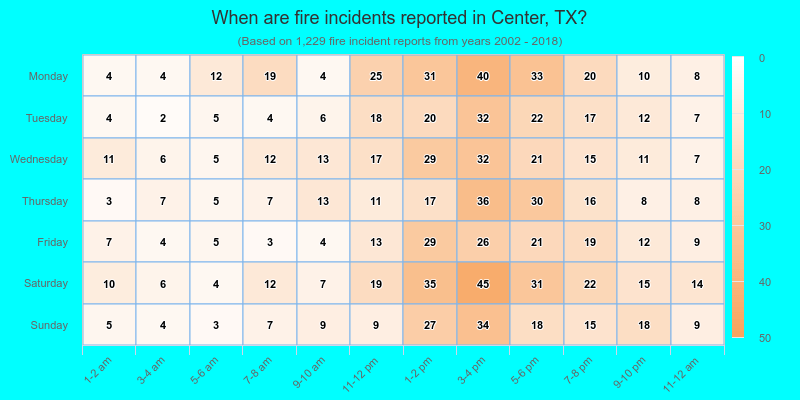
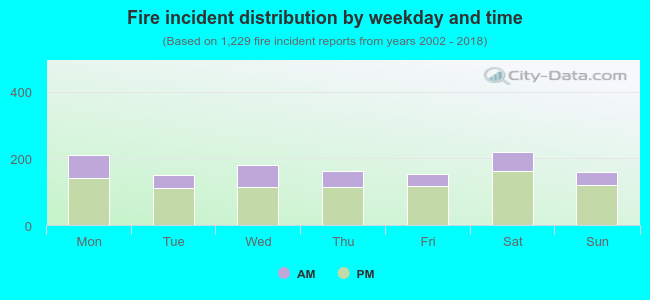 28.3% incidents where reported in the morning and 71.7% in the evening. The most fires (17.9%) took place on Saturday, and the least (12.1%) on Tuesday.
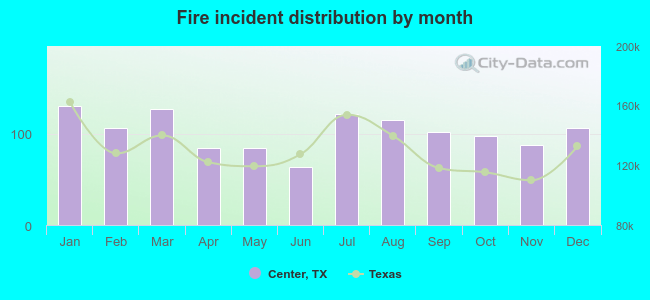 According to the 1,229 fires from years 2002 - 2018 most fires (10.7%) took place during January, and the least (5.2%) in June.
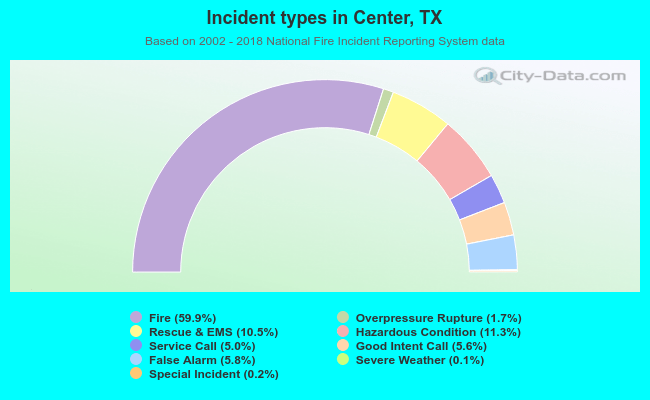 Out of all 2,053 cases reported during the years 2002 - 2018, the most belonged to the categories: Fire (59.9%), Hazardous Condition (11.3%), and Rescue & EMS (10.5%).
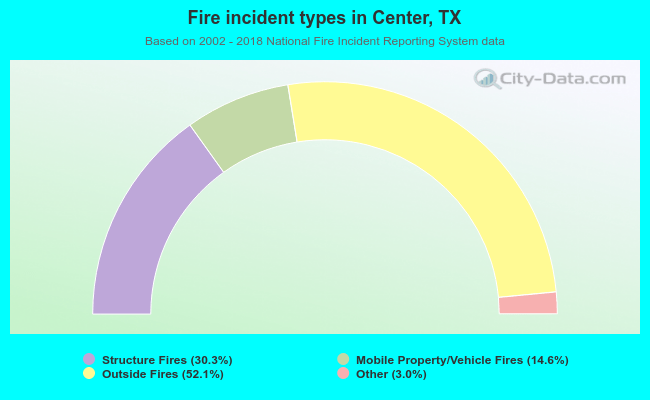 When looking into fire subcategories, the most reports belonged to: Outside Fires (52.1%), and Structure Fires (30.3%).