Henderson: Fire Incidents, Texas (TX)
Where are fire incidents reported in Henderson, TX
Something went wrong! Please refresh the page.
| Fire incidents reported | |
|---|---|
| Sreet name | Count |
| 79 HWY | 132 |
| FM 1716 | 130 |
| 259 HWY | 124 |
| 79 | 96 |
| LAKE CHEROKEE | 96 |
| 64 HWY | 90 |
| FM 840 | 90 |
| MAIN ST | 82 |
| FM 2867 | 72 |
| 259 | 70 |
| INDUSTRIAL DR | 60 |
| FM 225 | 54 |
| MARSHALL ST | 54 |
| FM 13 | 52 |
| 64 | 50 |
| KILGORE DR | 50 |
| FM 1798 | 44 |
| HWY 259 | 44 |
| SH 322 HWY | 44 |
| FM 2276 | 36 |
| 79 S | 34 |
| LONGVIEW DR | 34 |
| 317 | 32 |
| 323 | 32 |
| 43 | 32 |
| CR 317 | 32 |
| FM 3135 | 32 |
| HWY 79 | 32 |
| CR 476 | 30 |
| FM 782 FM | 30 |
| Other | 2,078 |
2002 - 2018 National Fire Incident Reporting System (NFIRS) incidents
- Incident types reported to NFIRS in Henderson, TX
- 3,86833.2%Fire
- 3,10026.6%Hazardous Condition
- 2,30019.8%Rescue & EMS
- 1,0729.2%Good Intent Call
- 8026.9%Service Call
- 4483.8%False Alarm
- 210.2%Overpressure Rupture
- 210.2%Severe Weather
- Fire incident types reported to NFIRS in Henderson, TX
- 2,28959.2%Outside Fires
- 93224.1%Structure Fires
- 3739.6%Mobile Property/Vehicle Fires
- 2747.1%Other
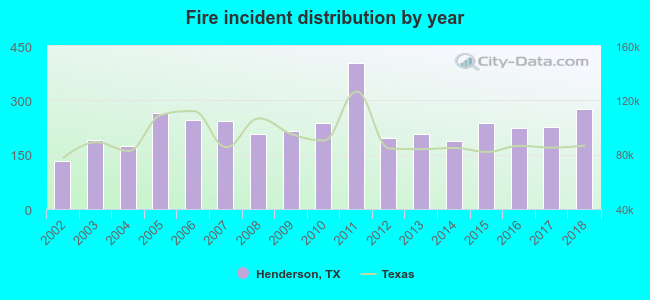 According to the data from the years 2002 - 2018 the average number of fires per year is 228. The highest number of fire incidents - 404 took place in 2011, and the least - 133 in 2002. The data has a rising trend.
The average number of yearly fire incidents per 10k residents in Henderson, TX compared to nearest cities:
(Note: Based on data for the last 3 years, including only cities with population 5,000 and above)
| Henderson: | 177.9 |
| Kilgore: | 113.1 |
| Longview: | 57.1 |
| Whitehouse: | 45.6 |
| White Oak: | 55.9 |
| Carthage: | 64.5 |
| Gladewater: | 86.0 |
| Jacksonville: | 25.2 |
| Tyler: | 29.8 |
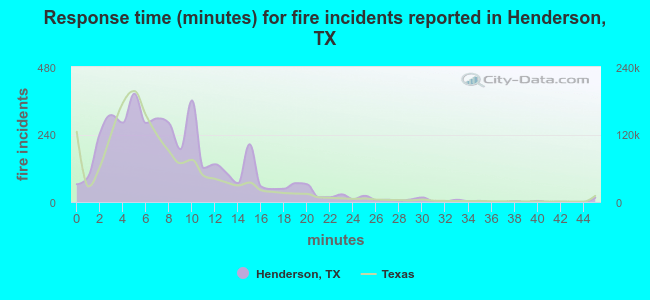 The median response time based on all reported fire incidents is 7 minutes. This is similar to the state median value.
The median response time in Henderson, TX compared to nearest cities:
(Note: Based on data for all years, including only cities with at least 500 fire incidents)
| Henderson: | 7 minutes |
| Overton: | 6 minutes |
| Arp: | 8 minutes |
| Kilgore: | 8 minutes |
| Troup: | 10 minutes |
| Longview: | 6 minutes |
| White Oak: | 6 minutes |
| Carthage: | 6 minutes |
| Hallsville: | 9 minutes |
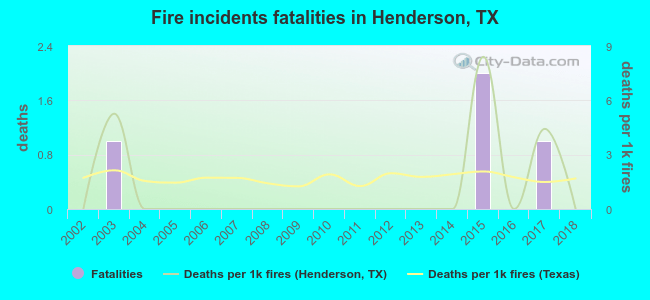 According to the data from the years 2002 - 2018 the average number of fire-related fatalities per year is 0. The highest number of deaths - 2 took place in 2015, and the lowest - 0 in 2002. The data has a constant trend.
The average number of fatalities per 1,000 fire incidents is 1. This indicator was the highest - 8 in 2015, and the lowest 0 in 2002. The trend for fatalities per 1,000 incidents is constant. Compared to the state value the number of fatalities per 1,000 fire incidents is lower.
According to the data from the years 2002 - 2018 the average number of fire-related fatalities per year is 0. The highest number of deaths - 2 took place in 2015, and the lowest - 0 in 2002. The data has a constant trend.
The average number of fatalities per 1,000 fire incidents is 1. This indicator was the highest - 8 in 2015, and the lowest 0 in 2002. The trend for fatalities per 1,000 incidents is constant. Compared to the state value the number of fatalities per 1,000 fire incidents is lower.
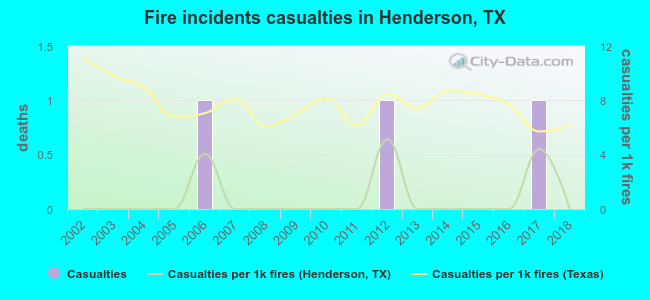 Based on the reports from the years 2002 - 2018 the average number of fire-related casualties per year is 0. The highest number of casualties - 1 took place in 2006, and the lowest - 0 in 2002. The data has a constant trend.
The average number of injuries per 1,000 fire incidents is 1. This indicator was the highest - 5 in 2012, and the lowest 0 in 2002. The trend for injuries per 1,000 incidents is constant. Compared to the state value the number of casualties per 1,000 fire incidents is much lower.
Based on the reports from the years 2002 - 2018 the average number of fire-related casualties per year is 0. The highest number of casualties - 1 took place in 2006, and the lowest - 0 in 2002. The data has a constant trend.
The average number of injuries per 1,000 fire incidents is 1. This indicator was the highest - 5 in 2012, and the lowest 0 in 2002. The trend for injuries per 1,000 incidents is constant. Compared to the state value the number of casualties per 1,000 fire incidents is much lower.
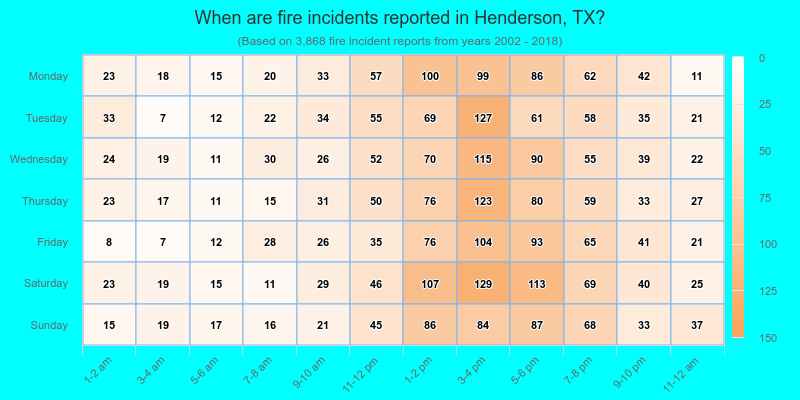
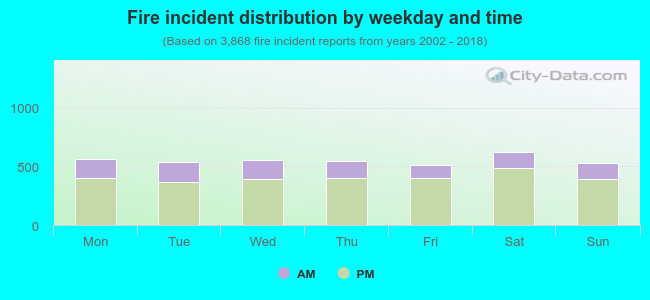 26.6% incidents where reported in the morning and 73.4% in the evening. The most fires (16.2%) took place on Saturday, and the least (13.3%) on Friday.
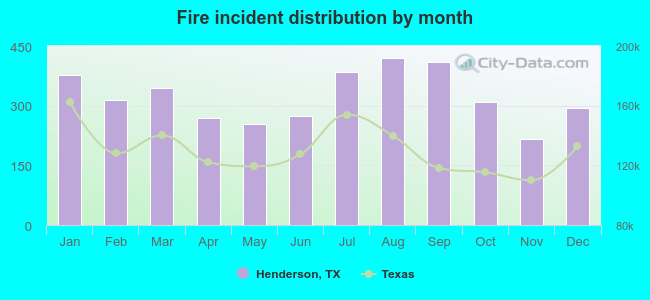 Based on the 3,868 incident reports from years 2002 - 2018 most fires (10.9%) took place during August, and the least (5.6%) in November.
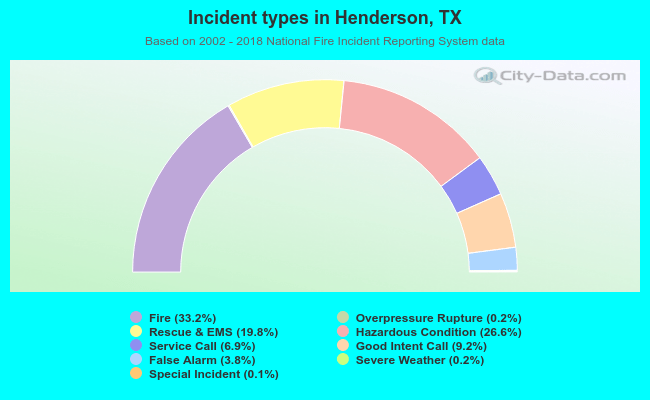 Out of all 11,640 cases reported during the years 2002 - 2018, the most belonged to the categories: Fire (33.2%), Hazardous Condition (26.6%), and Rescue & EMS (19.8%).
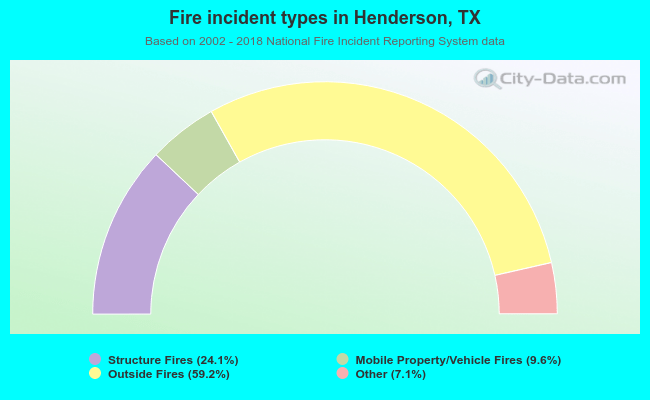 When looking into fire subcategories, the most reports belonged to: Outside Fires (59.2%), and Structure Fires (24.1%).