| Fire incidents reported |
|---|
| Sreet name | Count |
|---|
| 93 HWY | 32 | | BAPTIST HILL RD | 26 | | I 93 | 26 | | WEST RD | 26 | | SOUTHWEST RD | 22 | | INTERVALE RD | 20 | | BAPTIST RD | 18 | | SHAKER RD | 16 | | BRIAR BUSH RD | 14 | | NEW RD | 14 | | ROBIN SHORE DR | 12 | | CANTERBURY SHORE DR | 10 | | OLD TILTON RD | 10 | | BAPTIST HILLCANTERBURY RD | 8 | | HACKLEBORO RD | 8 | | HACKLEBORO ROAD | 8 | | MORRILL ROAD | 8 | | RANDALL RD | 8 | | BLUE BOAR LN | 6 | | BOROUGH RD | 6 | | CLOUGH POND RD | 6 | | HETHLON RD | 6 | | I-93 NB | 6 | | INTERVALE RD | 6 | | OLD TILTON RD | 6 |
| | | Fire incidents reported |
|---|
| Sreet name | Count |
|---|
| SHAKER RD | 6 | | ASBY RD | 4 | | BAPTIST HILL ROAD | 4 | | BAPTIST RD | 4 | | CANTERBURY SHORE DRIVE | 4 | | CLOUGH TAVERN RD | 4 | | FOSTER RD | 4 | | GOODWIN RD | 4 | | HACKLEBORO RD | 4 | | I-93 SB | 4 | | MORRILL RD | 4 | | NORTHWEST RD | 4 | | PICKARD RD | 4 | | ROBIN SHORE DR | 4 | | SHOESTRING RD | 4 | | ABBERTON RD | 2 | | ABBOTT RD | 2 | | AYERS RD | 2 | | BABTIST HILL RD | 2 | | BAPTIST (CANTERBURY) RD | 2 | | BAPTIST HILL | 2 | | BAPTIST HILL / SHAKER RD | 2 | | BAPTIST HILL RD | 2 | | BAPTIST ROAD | 2 | | |
|
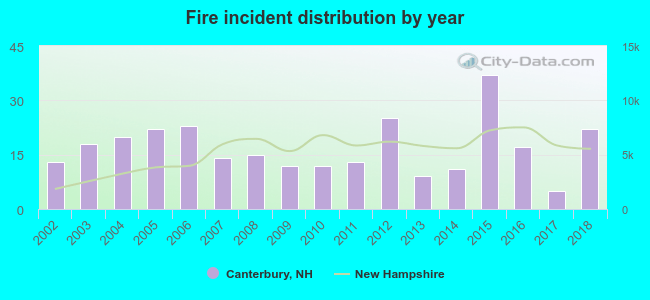 According to the data from the years 2002 - 2018 the average number of fires per year is 17. The highest number of fires - 37 took place in 2015, and the least - 5 in 2017. The data has a growing trend.
 32.6% incidents where reported in the morning and 67.4% in the evening. The most fires (20.8%) took place on Monday, and the least (8.3%) on Thursday.
 According to the 288 fire incident reports from years 2002 - 2018 most fires (16.0%) took place during January, and the least (3.1%) in August.
 Out of all 2,433 cases reported during the years 2002 - 2018, the most belonged to the categories: Rescue & EMS (44.5%), Hazardous Condition (20.1%), and Fire (11.8%).
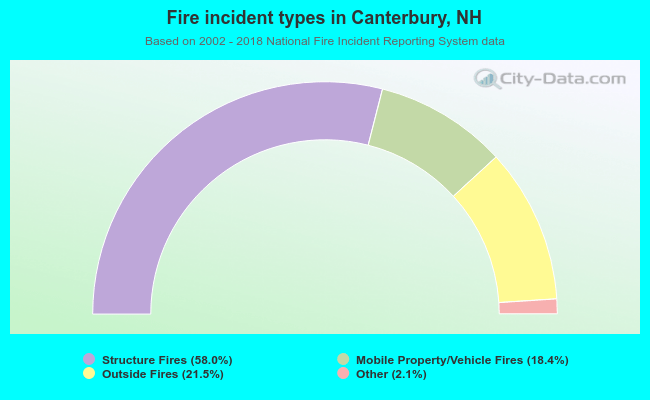 When looking into fire subcategories, the most incidents belonged to: Structure Fires (58.0%), and Outside Fires (21.5%).