Brownwood: Fire Incidents, Texas (TX)
Where are fire incidents reported in Brownwood, TX
Something went wrong! Please refresh the page.
| Fire incidents reported | |
|---|---|
| Sreet name | Count |
| COMMERCE ST | 108 |
| AUSTIN AVE | 82 |
| HWY 279 | 80 |
| FM 45 | 60 |
| 183 HWY | 42 |
| MAIN BLVD | 40 |
| DURHAM AVE | 38 |
| VINE ST | 38 |
| COGGIN AVE | 36 |
| 7TH ST | 32 |
| ELIZABETH DR | 32 |
| MAIN ST | 32 |
| 377 HWY | 30 |
| CENTER AVE | 30 |
| CR 234 | 30 |
| 279 HWY | 28 |
| AVE B | 28 |
| B AVE | 28 |
| FM 2125 | 28 |
| MILAM DR | 28 |
| 1ST ST | 26 |
| CR 267 | 26 |
| TERRACE DR | 26 |
| AVE D AVE | 24 |
| BELLE PLAIN AVE | 24 |
| 4TH ST | 22 |
| BRADY AVE | 22 |
| MAGNOLIA ST | 22 |
| VINCENT ST | 22 |
| 45 HWY | 20 |
| Other | 1,036 |
2002 - 2018 National Fire Incident Reporting System (NFIRS) incidents
- Incident types reported to NFIRS in Brownwood, TX
- 7,00055.6%Rescue & EMS
- 2,12016.8%Fire
- 1,59912.7%Hazardous Condition
- 7876.3%Good Intent Call
- 5724.5%Service Call
- 4523.6%False Alarm
- 210.2%Overpressure Rupture
- 210.2%Severe Weather
- 140.1%Special Incident
- Fire incident types reported to NFIRS in Brownwood, TX
- 1,25859.3%Outside Fires
- 55826.3%Structure Fires
- 2079.8%Mobile Property/Vehicle Fires
- 974.6%Other
 According to the data from the years 2002 - 2018 the average number of fire incidents per year is 125. The highest number of reported fires - 226 took place in 2011, and the least - 0 in 2004. The data has an increasing trend.
The average number of yearly fire incidents per 10k residents in Brownwood, TX compared to nearest cities:
(Note: Based on data for the last 3 years, including only cities with population 5,000 and above)
| Brownwood: | 74.8 |
| Brady: | 111.2 |
| Stephenville: | 50.1 |
| Lampasas: | 98.3 |
| Abilene: | 41.0 |
| Breckenridge: | 190.6 |
| Copperas Cove: | 38.1 |
| Gatesville: | 122.6 |
| Kingsland: | 7.7 |
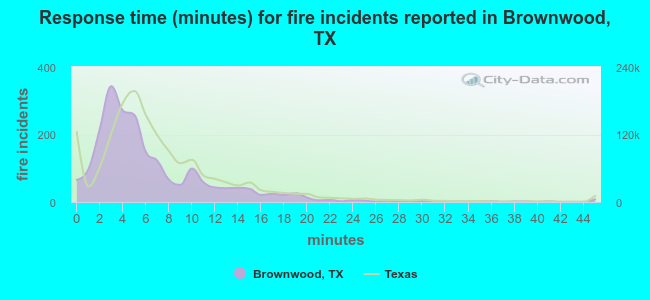 The median response time based on all reported fire incidents is 5 minutes. This is lower compared to the state median value.
The median response time in Brownwood, TX compared to nearest cities:
(Note: Based on data for all years, including only cities with at least 500 fire incidents)
| Brownwood: | 5 minutes |
| Bangs: | 9 minutes |
| Coleman: | 9 minutes |
| San Saba: | 10 minutes |
| Brady: | 7 minutes |
| Cisco: | 5 minutes |
| Eastland: | 7 minutes |
| Hamilton: | 12 minutes |
| Baird: | 15 minutes |
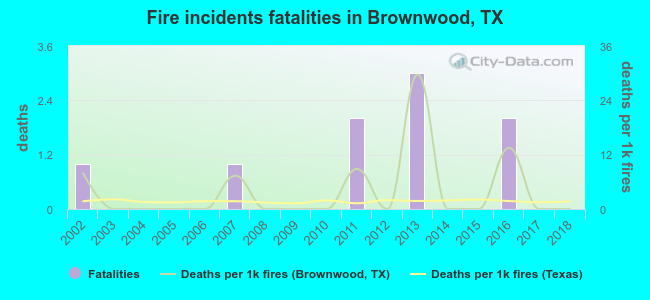 Based on the data from the years 2002 - 2018 the average number of fire-related yearly deaths is 1. The highest number of deaths - 3 took place in 2013, and the lowest - 0 in 2003. The data has a decreasing trend.
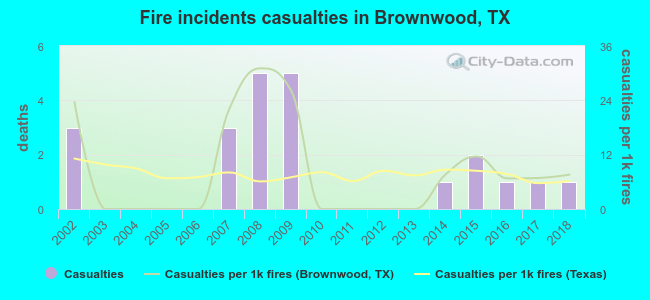 According to the reports from the years 2002 - 2018 the average number of fire-related casualties per year is 1. The highest number of reported casualties - 5 took place in 2008, and the lowest - 0 in 2003. The data has a declining trend.
The average number of injuries per 1,000 fires is 8. This indicator was the highest - 31 in 2008, and the lowest 0 in 2003. The trend for casualties per 1,000 fire incidents is declining. Compared to the state value the number of casualties per 1,000 fires is higher.
According to the reports from the years 2002 - 2018 the average number of fire-related casualties per year is 1. The highest number of reported casualties - 5 took place in 2008, and the lowest - 0 in 2003. The data has a declining trend.
The average number of injuries per 1,000 fires is 8. This indicator was the highest - 31 in 2008, and the lowest 0 in 2003. The trend for casualties per 1,000 fire incidents is declining. Compared to the state value the number of casualties per 1,000 fires is higher.
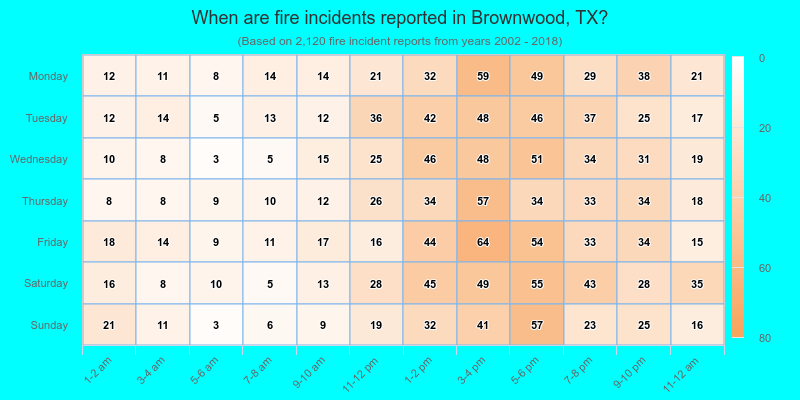
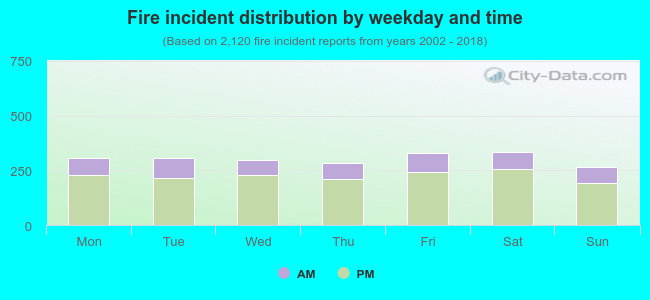 25.7% incidents where reported in the morning and 74.3% in the evening. The most fires (15.8%) took place on Saturday, and the least (12.4%) on Sunday.
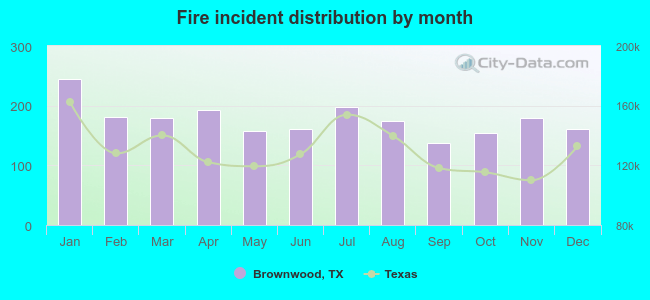 Based on the 2,120 incident reports from years 2002 - 2018 most fires (11.6%) took place during January, and the least (6.5%) in September.
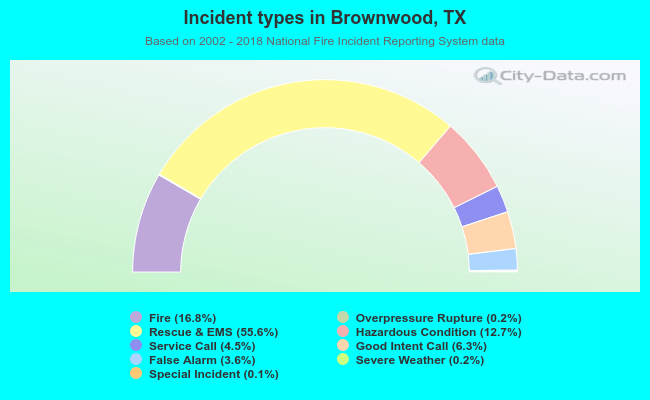 Out of all 12,586 cases reported during the years 2002 - 2018, the most belonged to the categories: Rescue & EMS (55.6%), Fire (16.8%), and Hazardous Condition (12.7%).
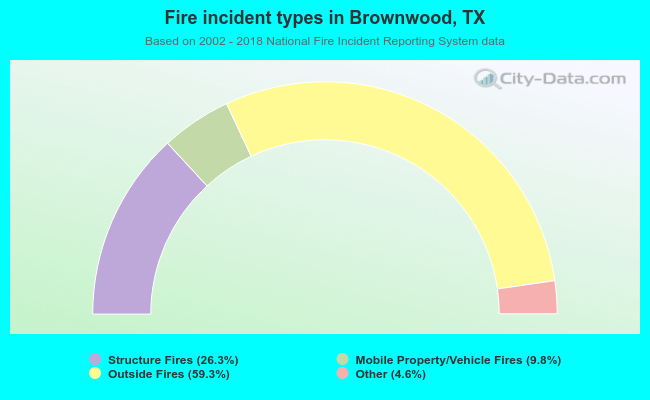 When looking into fire subcategories, the most reports belonged to: Outside Fires (59.3%), and Structure Fires (26.3%).