Boulder: Fire Incidents, Colorado (CO)
Where are fire incidents reported in Boulder, CO
Something went wrong! Please refresh the page.
| Fire incidents reported | |
|---|---|
| Sreet name | Count |
| BROADWAY | 418 |
| PEARL ST | 296 |
| ARAPAHOE AVE | 266 |
| 30TH ST | 240 |
| 28TH ST | 232 |
| 13TH ST | 228 |
| 14TH ST | 190 |
| VALMONT RD | 188 |
| 11TH ST | 168 |
| BASELINE RD | 166 |
| 19TH ST | 158 |
| 9TH ST | 126 |
| 10TH ST | 124 |
| 18TH ST | 120 |
| DIAGONAL HWY | 112 |
| 15TH ST | 100 |
| 63RD ST | 94 |
| CANYON BLVD | 94 |
| WALNUT ST | 90 |
| FLAGSTAFF RD | 88 |
| SUNSHINE CANYON DR | 84 |
| 17TH ST | 82 |
| COLORADO AVE | 80 |
| 75TH ST | 70 |
| FOLSOM ST | 70 |
| 29TH ST | 68 |
| WILLIAMS FORK TRL | 68 |
| MARINE ST | 66 |
| 12TH ST | 64 |
| SPRUCE ST | 64 |
| Other | 1,108 |
2002 - 2018 National Fire Incident Reporting System (NFIRS) incidents
- Incident types reported to NFIRS in Boulder, CO
- 32,41049.9%Rescue & EMS
- 10,26715.8%Good Intent Call
- 7,81912.0%Hazardous Condition
- 5,3228.2%Fire
- 4,9097.6%False Alarm
- 4,0106.2%Service Call
- 940.1%Overpressure Rupture
- Fire incident types reported to NFIRS in Boulder, CO
- 2,73151.3%Outside Fires
- 1,88935.5%Structure Fires
- 5029.4%Mobile Property/Vehicle Fires
- 2003.8%Other
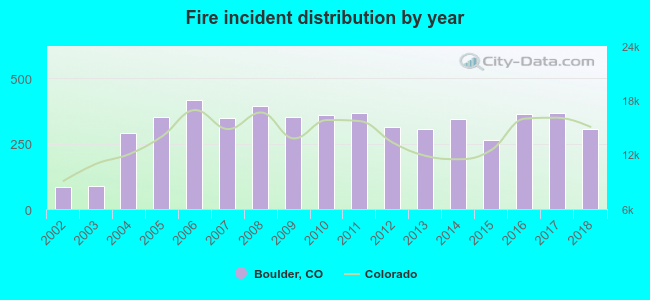 According to the data from the years 2002 - 2018 the average number of fires per year is 313. The highest number of fires - 416 took place in 2006, and the least - 85 in 2002. The data has a rising trend.
The average number of yearly fire incidents per 10k residents in Boulder, CO compared to nearest cities:
(Note: Based on data for the last 3 years, including only cities with population 5,000 and above)
| Boulder: | 32.8 |
| Gunbarrel: | 7.6 |
| Louisville: | 17.1 |
| Superior: | 9.3 |
| Lafayette: | 23.8 |
| Erie: | 26.0 |
| Broomfield: | 16.5 |
| Longmont: | 28.6 |
| Westminster: | 19.6 |
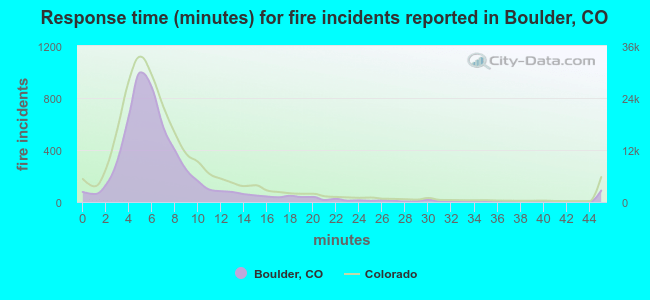 The median response time based on all reported fire incidents is 6 minutes. This is close to the Colorado median value.
The median response time in Boulder, CO compared to nearest cities:
(Note: Based on data for all years, including only cities with at least 500 fire incidents)
| Boulder: | 6 minutes |
| Lafayette: | 5 minutes |
| Erie: | 7 minutes |
| Broomfield: | 6 minutes |
| Longmont: | 7 minutes |
| Westminster: | 5 minutes |
| Arvada: | 5 minutes |
| Federal Heights: | 5 minutes |
| Northglenn: | 6 minutes |
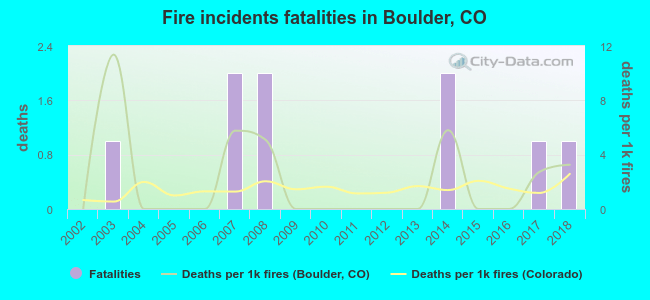 Based on the reports from the years 2002 - 2018 the average number of fire-related yearly deaths is 1. The highest number of deaths - 2 took place in 2007, and the lowest - 0 in 2002. The data has an increasing trend.
The average number of deaths per 1,000 fire incidents is 2. This indicator was the highest - 11 in 2003, and the lowest 0 in 2002. The trend for fatalities per 1,000 incidents is growing. Compared to the Colorado value the number of fatalities per 1,000 incidents is about the same.
Based on the reports from the years 2002 - 2018 the average number of fire-related yearly deaths is 1. The highest number of deaths - 2 took place in 2007, and the lowest - 0 in 2002. The data has an increasing trend.
The average number of deaths per 1,000 fire incidents is 2. This indicator was the highest - 11 in 2003, and the lowest 0 in 2002. The trend for fatalities per 1,000 incidents is growing. Compared to the Colorado value the number of fatalities per 1,000 incidents is about the same.
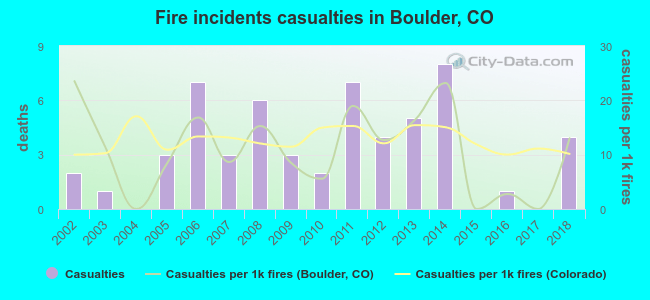 Based on the data from the years 2002 - 2018 the average number of fire-related yearly casualties is 3. The highest number of casualties - 8 took place in 2014, and the lowest - 0 in 2004. The data has a rising trend.
The average number of injuries per 1,000 fires is 11. This indicator was the highest - 24 in 2002, and the lowest 0 in 2004. The trend for injuries per 1,000 incidents is dropping. Compared to the Colorado value the number of injuries per 1,000 fire incidents is about the same.
Based on the data from the years 2002 - 2018 the average number of fire-related yearly casualties is 3. The highest number of casualties - 8 took place in 2014, and the lowest - 0 in 2004. The data has a rising trend.
The average number of injuries per 1,000 fires is 11. This indicator was the highest - 24 in 2002, and the lowest 0 in 2004. The trend for injuries per 1,000 incidents is dropping. Compared to the Colorado value the number of injuries per 1,000 fire incidents is about the same.Casualties per 1,000 incidents in Boulder, CO compared to nearest cities:
(Note: Based on data for all years, including only cities with at least 500 fire incidents)
| Boulder: | 10.5 |
| Lafayette: | 5.1 |
| Erie: | 4.6 |
| Broomfield: | 11.7 |
| Longmont: | 6.0 |
| Westminster: | 34.0 |
| Arvada: | 13.9 |
| Federal Heights: | 21.2 |
| Northglenn: | 9.4 |
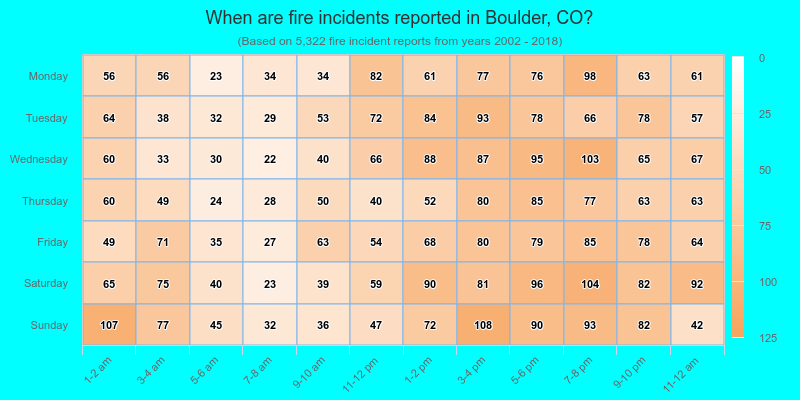
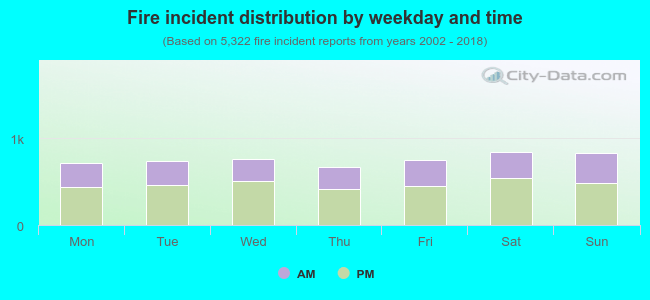 37.9% incidents where reported in the morning and 62.1% in the evening. The most fires (15.9%) took place on Saturday, and the least (12.6%) on Thursday.
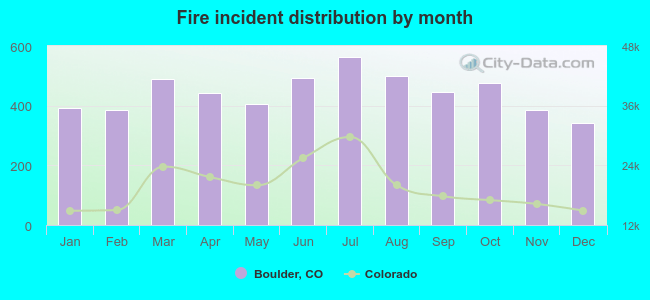 According to the 5,322 fires from years 2002 - 2018 most fires (10.6%) took place during July, and the least (6.4%) in December.
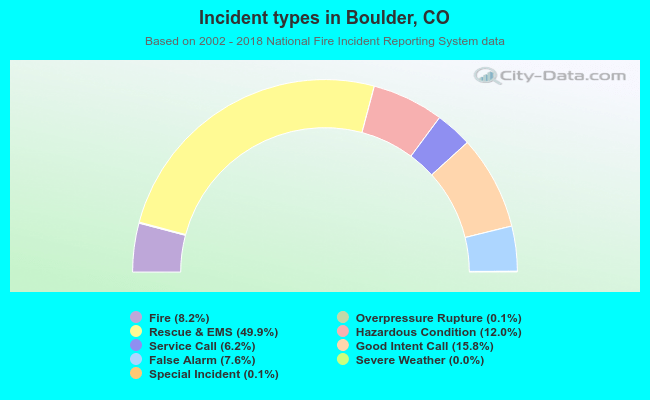 Out of all 64,898 cases reported during the years 2002 - 2018, the most belonged to the categories: Rescue & EMS (49.9%), Good Intent Call (15.8%), and Hazardous Condition (12.0%).
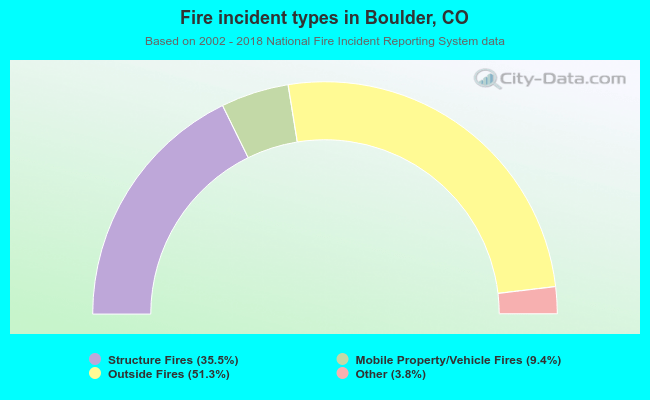 When looking into fire subcategories, the most reports belonged to: Outside Fires (51.3%), and Structure Fires (35.5%).