Lakewood: Fire Incidents, Colorado (CO)
Where are fire incidents reported in Lakewood, CO
Something went wrong! Please refresh the page.
| Fire incidents reported | |
|---|---|
| Sreet name | Count |
| COLFAX AVE | 668 |
| WADSWORTH BLVD | 506 |
| SHERIDAN BLVD | 216 |
| JEWELL AVE | 210 |
| ALAMEDA AVE | 208 |
| 6TH AVE | 174 |
| DEPEW ST | 168 |
| WRIGHT ST | 154 |
| HAMPDEN AVE | 146 |
| KIPLING PKY | 146 |
| KENDALL ST | 144 |
| MISSISSIPPI AVE | 142 |
| GARRISON ST | 132 |
| KIPLING ST | 128 |
| 14TH AVE | 126 |
| 20TH AVE | 120 |
| ALAMEDA PKY | 118 |
| 13TH AVE | 114 |
| HARLAN ST | 114 |
| VANCE ST | 108 |
| PIERCE ST | 106 |
| UNION BLVD | 106 |
| REED ST | 104 |
| EATON ST | 102 |
| TELLER ST | 100 |
| MANSFIELD PKY | 96 |
| CARR ST | 94 |
| 1ST AVE | 88 |
| AMMONS ST | 88 |
| INGALLS ST | 88 |
| Other | 693 |
2002 - 2018 National Fire Incident Reporting System (NFIRS) incidents
- Incident types reported to NFIRS in Lakewood, CO
- 83,35365.5%Rescue & EMS
- 15,72812.4%False Alarm
- 10,1938.0%Service Call
- 7,0455.5%Hazardous Condition
- 5,5074.3%Fire
- 5,2274.1%Good Intent Call
- Fire incident types reported to NFIRS in Lakewood, CO
- 2,33442.4%Structure Fires
- 1,96535.7%Outside Fires
- 93817.0%Mobile Property/Vehicle Fires
- 2704.9%Other
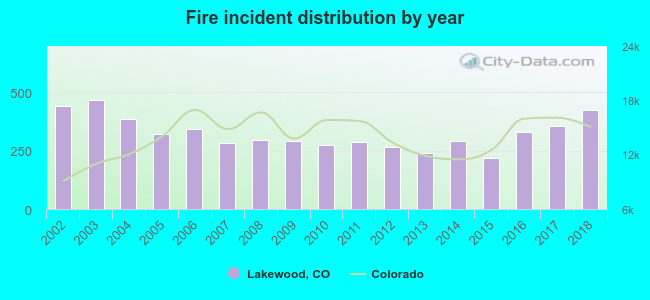 According to the data from the years 2002 - 2018 the average number of fires per year is 324. The highest number of reported fires - 465 took place in 2003, and the least - 217 in 2015. The data has a declining trend.
The average number of yearly fire incidents per 10k residents in Lakewood, CO compared to nearest cities:
(Note: Based on data for the last 3 years, including only cities with population 5,000 and above)
| Lakewood: | 24.8 |
| Wheat Ridge: | 29.3 |
| Sheridan: | 45.9 |
| Golden: | 100.7 |
| Englewood: | 46.5 |
| Denver: | 25.0 |
| Arvada: | 14.3 |
| Littleton: | 45.4 |
| Glendale: | 18.9 |
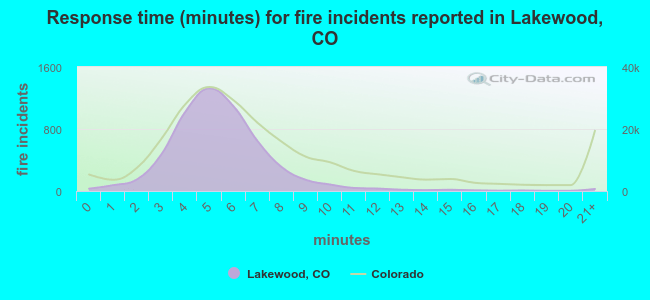 The median response time based on all reported fire incidents is 5 minutes. This is lower compared to the state median value.
The median response time in Lakewood, CO compared to nearest cities:
(Note: Based on data for all years, including only cities with at least 500 fire incidents)
| Lakewood: | 5 minutes |
| Wheat Ridge: | 5 minutes |
| Sheridan: | 4 minutes |
| Golden: | 7 minutes |
| Englewood: | 6 minutes |
| Denver: | 4 minutes |
| Arvada: | 5 minutes |
| Littleton: | 7 minutes |
| Westminster: | 5 minutes |
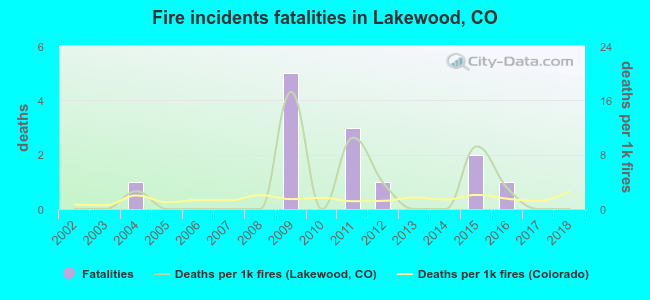 According to the reports from the years 2002 - 2018 the average number of fire-related yearly deaths is 1. The highest number of reported deaths - 5 took place in 2009, and the lowest - 0 in 2002. The data has a constant trend.
The average number of fatalities per 1,000 fire incidents is 3. This indicator was the highest - 17 in 2009, and the lowest 0 in 2002. The trend for deaths per 1,000 fire incidents is constant. Compared to the state value the number of deaths per 1,000 fire incidents is higher.
According to the reports from the years 2002 - 2018 the average number of fire-related yearly deaths is 1. The highest number of reported deaths - 5 took place in 2009, and the lowest - 0 in 2002. The data has a constant trend.
The average number of fatalities per 1,000 fire incidents is 3. This indicator was the highest - 17 in 2009, and the lowest 0 in 2002. The trend for deaths per 1,000 fire incidents is constant. Compared to the state value the number of deaths per 1,000 fire incidents is higher.
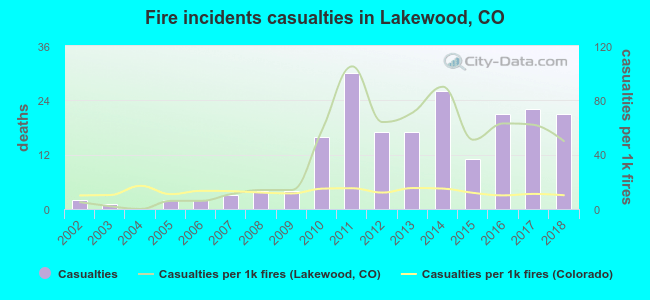 Based on the reports from the years 2002 - 2018 the average number of fire-related yearly casualties is 12. The highest number of reported injuries - 30 took place in 2011, and the lowest - 0 in 2004. The data has a rising trend.
The average number of casualties per 1,000 fire incidents is 40. This indicator was the highest - 105 in 2011, and the lowest 0 in 2004. The trend for casualties per 1,000 fires is rising. Compared to the Colorado value the number of injuries per 1,000 fire incidents is much higher.
Based on the reports from the years 2002 - 2018 the average number of fire-related yearly casualties is 12. The highest number of reported injuries - 30 took place in 2011, and the lowest - 0 in 2004. The data has a rising trend.
The average number of casualties per 1,000 fire incidents is 40. This indicator was the highest - 105 in 2011, and the lowest 0 in 2004. The trend for casualties per 1,000 fires is rising. Compared to the Colorado value the number of injuries per 1,000 fire incidents is much higher.Casualties per 1,000 incidents in Lakewood, CO compared to nearest cities:
(Note: Based on data for all years, including only cities with at least 500 fire incidents)
| Lakewood: | 36.1 |
| Wheat Ridge: | 9.2 |
| Sheridan: | 17.1 |
| Golden: | 12.7 |
| Englewood: | 10.1 |
| Denver: | 20.6 |
| Arvada: | 13.9 |
| Littleton: | 19.8 |
| Westminster: | 34.0 |
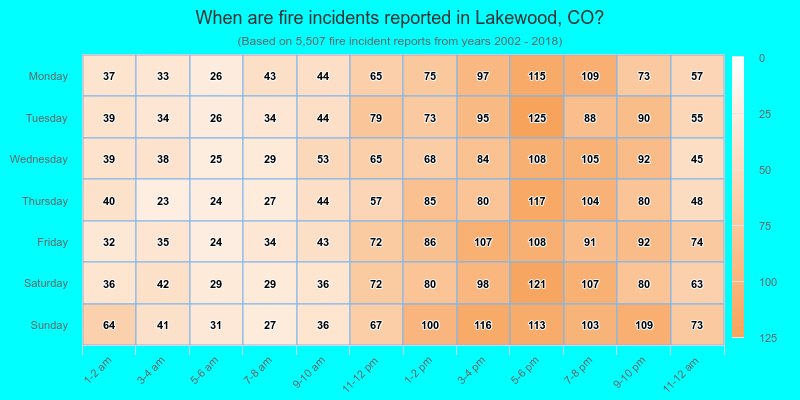
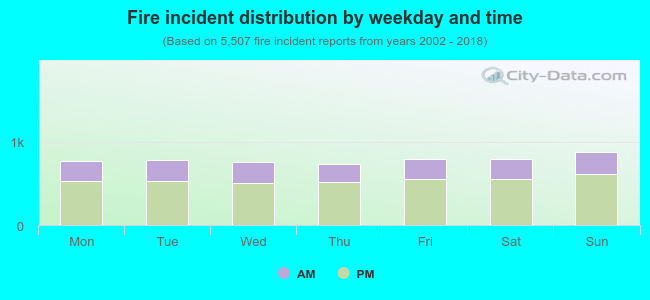 31.2% incidents where reported in the morning and 68.8% in the evening. The most fires (16.0%) took place on Sunday, and the least (13.2%) on Thursday.
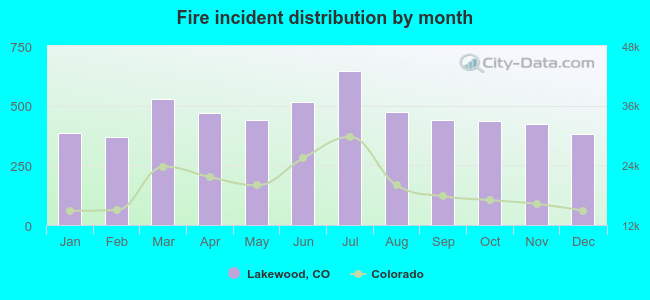 Based on the 5,507 fire incident reports from years 2002 - 2018 most fires (11.7%) took place during July, and the least (6.7%) in February.
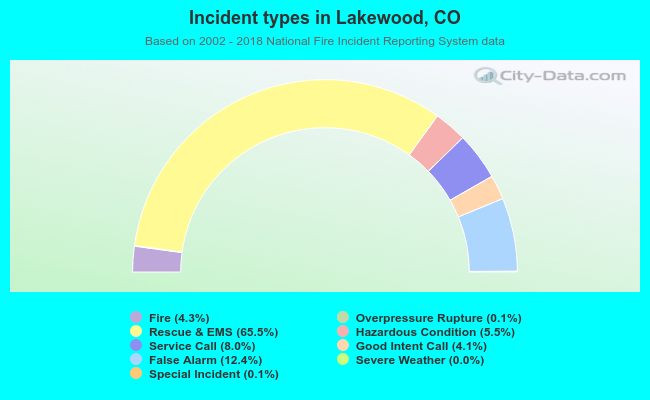 Out of all 127,254 cases reported during the years 2002 - 2018, the most belonged to the categories: Rescue & EMS (65.5%), False Alarm (12.4%), and Service Call (8.0%).
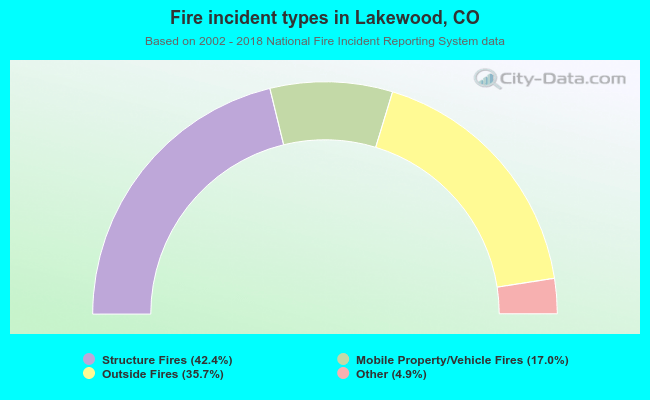 When looking into fire subcategories, the most incidents belonged to: Structure Fires (42.4%), and Outside Fires (35.7%).