Atlanta: Fire Incidents, Georgia (GA)
Where are fire incidents reported in Atlanta, GA
Something went wrong! Please refresh the page.
| Fire incidents reported | |
|---|---|
| Sreet name | Count |
| BUFORD HW | 550 |
| BOULDERCREST RD | 372 |
| MARTIN L KING JR DR | 338 |
| CAMPBELLTON RD | 282 |
| PEACHTREE RD | 278 |
| CLAIRMONT RD | 244 |
| FLAT SHOALS RD | 244 |
| BRIARCLIFF RD | 238 |
| JONESBORO RD | 232 |
| CASCADE RD | 222 |
| CLEVELAND AVE | 220 |
| FAIRBURN RD | 202 |
| MORELAND AV | 202 |
| FULTON INDUSTRIAL BLVD | 200 |
| PEACHTREE ST | 192 |
| BOULEVARD | 170 |
| MORELAND AVE | 166 |
| NORTHSIDE DR | 162 |
| RIVERDALE RD | 158 |
| ASHFORD DUNWOODY RD | 148 |
| THOMASVILLE BLVD | 144 |
| BOLTON RD | 136 |
| PIEDMONT RD | 136 |
| DRUID HILLS RD | 132 |
| MEMORIAL DR | 132 |
| LAVISTA RD | 130 |
| 285 EB | 124 |
| NORTH AVE | 122 |
| PACES FERRY RD | 120 |
| CLIFTON RD | 114 |
| Other | 12,045 |
2002 - 2018 National Fire Incident Reporting System (NFIRS) incidents
- Incident types reported to NFIRS in Atlanta, GA
- 240,09352.1%Rescue & EMS
- 97,16221.1%Good Intent Call
- 43,7329.5%False Alarm
- 36,4417.9%Service Call
- 23,2095.0%Hazardous Condition
- 18,1553.9%Fire
- 1,1820.3%Special Incident
- 6420.1%Overpressure Rupture
- 4640.1%Severe Weather
- Fire incident types reported to NFIRS in Atlanta, GA
- 7,09039.1%Structure Fires
- 5,75331.7%Outside Fires
- 5,16828.5%Mobile Property/Vehicle Fires
- 1440.8%Other
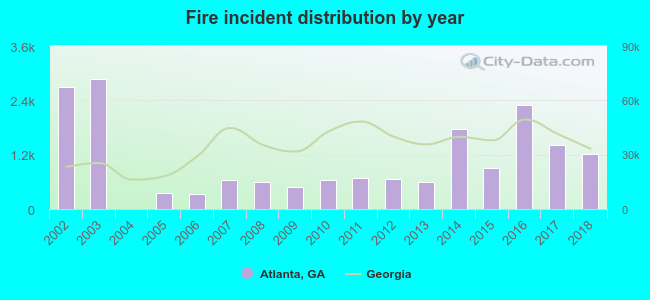 According to the data from the years 2002 - 2018 the average number of fires per year is 1,068. The highest number of reported fire incidents - 2,871 took place in 2003, and the least - 7 in 2004. The data has a declining trend.
The average number of yearly fire incidents per 10k residents in Atlanta, GA compared to nearest cities:
(Note: Based on data for the last 3 years, including only cities with population 5,000 and above)
| Atlanta: | 36.1 |
| Decatur: | 198.1 |
| East Point: | 37.5 |
| Gresham Park: | 5.4 |
| Hapeville: | 43.0 |
| College Park: | 167.6 |
| Scottdale: | 11.0 |
| Conley: | 53.0 |
| Forest Park: | 76.9 |
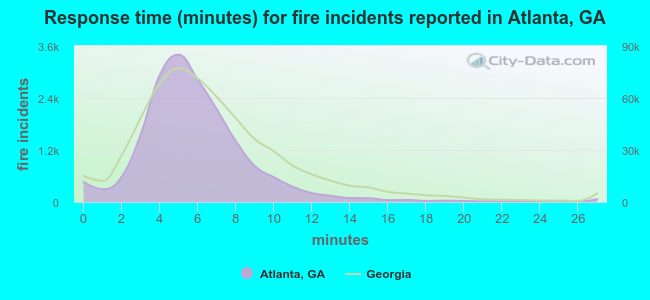 The median response time based on all reported fire incidents is 5 minutes. This is lower than the Georgia median value.
The median response time in Atlanta, GA compared to nearest cities:
(Note: Based on data for all years, including only cities with at least 500 fire incidents)
| Atlanta: | 5 minutes |
| Decatur: | 5 minutes |
| East Point: | 6 minutes |
| Hapeville: | 3 minutes |
| College Park: | 6 minutes |
| Forest Park: | 6 minutes |
| Clarkston: | 6 minutes |
| Smyrna: | 5 minutes |
| Mableton: | 6 minutes |
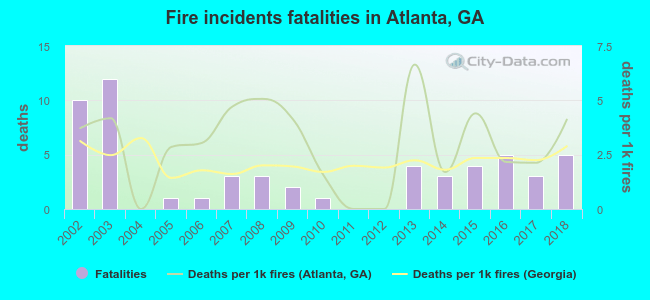 According to the data from the years 2002 - 2018 the average number of fire-related fatalities per year is 3. The highest number of deaths - 12 took place in 2003, and the lowest - 0 in 2004. The data has a dropping trend.
The average number of deaths per 1,000 fires is 3. This indicator was the highest - 7 in 2013, and the lowest 0 in 2004. The trend for fatalities per 1,000 fires is growing. Compared to the state value the number of fatalities per 1,000 incidents is higher.
According to the data from the years 2002 - 2018 the average number of fire-related fatalities per year is 3. The highest number of deaths - 12 took place in 2003, and the lowest - 0 in 2004. The data has a dropping trend.
The average number of deaths per 1,000 fires is 3. This indicator was the highest - 7 in 2013, and the lowest 0 in 2004. The trend for fatalities per 1,000 fires is growing. Compared to the state value the number of fatalities per 1,000 incidents is higher.Deaths per 1,000 incidents in Atlanta, GA compared to nearest cities:
(Note: Based on data for all years, including only cities with at least 2,500 fire incidents)
| Atlanta: | 3.1 |
| Decatur: | 2.1 |
| College Park: | 1.9 |
| Smyrna: | 4.7 |
| Riverdale: | 1.0 |
| Stone Mountain: | 2.3 |
| Austell: | 1.1 |
| Marietta: | 2.9 |
| Jonesboro: | 1.1 |
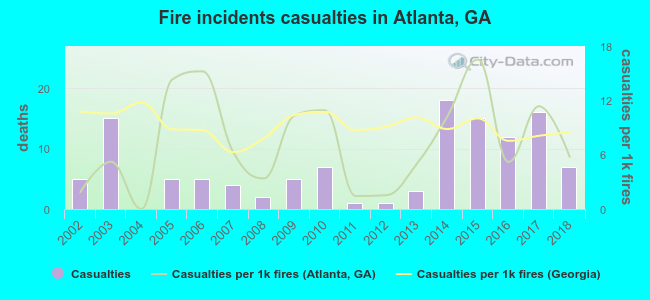 Based on the data from the years 2002 - 2018 the average number of fire-related yearly casualties is 7. The highest number of casualties - 18 took place in 2014, and the lowest - 0 in 2004. The data has a rising trend.
The average number of injuries per 1,000 fire incidents is 7. This indicator was the highest - 17 in 2015, and the lowest 0 in 2004. The trend for injuries per 1,000 fire incidents is growing. Compared to the Georgia value the number of casualties per 1,000 incidents is lower.
Based on the data from the years 2002 - 2018 the average number of fire-related yearly casualties is 7. The highest number of casualties - 18 took place in 2014, and the lowest - 0 in 2004. The data has a rising trend.
The average number of injuries per 1,000 fire incidents is 7. This indicator was the highest - 17 in 2015, and the lowest 0 in 2004. The trend for injuries per 1,000 fire incidents is growing. Compared to the Georgia value the number of casualties per 1,000 incidents is lower.Casualties per 1,000 incidents in Atlanta, GA compared to nearest cities:
(Note: Based on data for all years, including only cities with at least 500 fire incidents)
| Atlanta: | 6.7 |
| Decatur: | 6.4 |
| East Point: | 9.2 |
| Hapeville: | 0.0 |
| College Park: | 4.6 |
| Forest Park: | 36.9 |
| Clarkston: | 4.1 |
| Smyrna: | 9.5 |
| Mableton: | 18.8 |
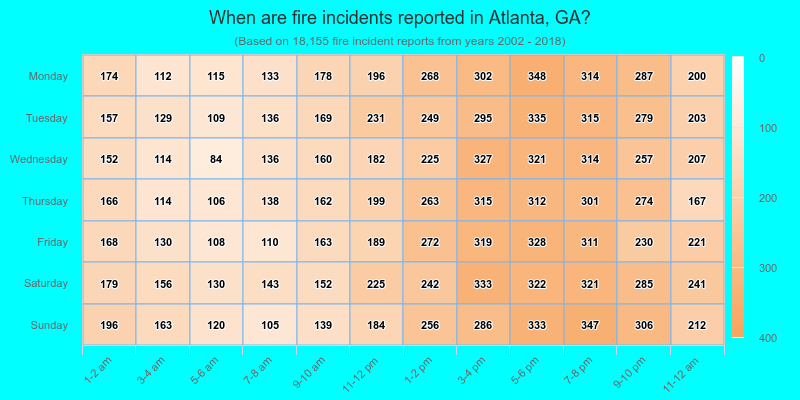
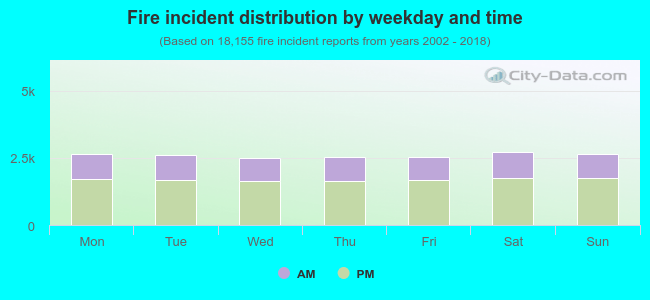 34.8% incidents where reported in the morning and 65.2% in the evening. The most fires (15.0%) took place on Saturday, and the least (13.7%) on Wednesday.
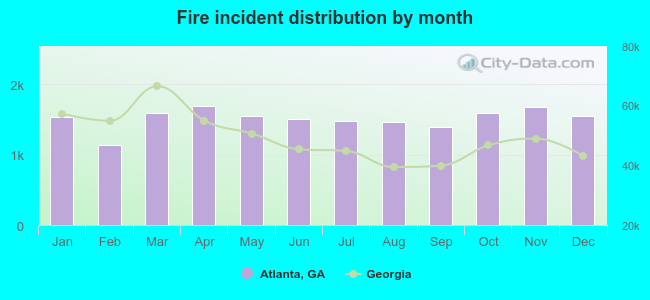 Based on the 18,155 incident reports from years 2002 - 2018 most fires (9.3%) took place during April, and the least (6.3%) in February.
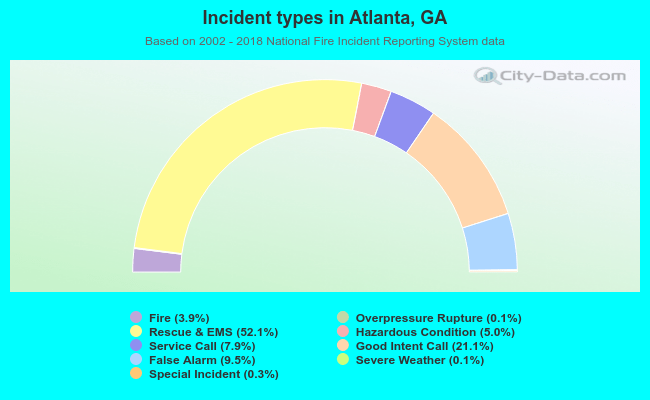 Out of all 461,080 cases reported during the years 2002 - 2018, the most belonged to the categories: Rescue & EMS (52.1%), Good Intent Call (21.1%), and False Alarm (9.5%).
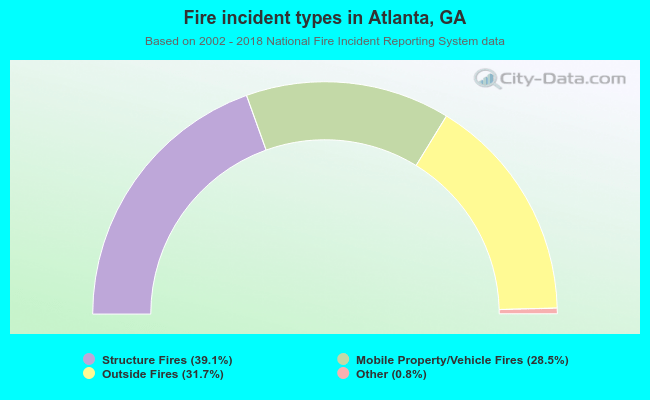 When looking into fire subcategories, the most reports belonged to: Structure Fires (39.1%), and Outside Fires (31.7%).