Riverdale: Fire Incidents, Georgia (GA)
Where are fire incidents reported in Riverdale, GA
Something went wrong! Please refresh the page.
| Fire incidents reported | |
|---|---|
| Sreet name | Count |
| 85 HWY | 346 |
| HIGHWAY 85 | 214 |
| TAYLOR RD | 152 |
| ROBERTS DR | 128 |
| UPPER RIVERDALE RD | 122 |
| CHURCH ST | 120 |
| RIVERDALE RD | 114 |
| WEBB RD | 104 |
| ROY HUIE RD | 102 |
| VALLEY HILL RD | 90 |
| GARDEN WALK BLVD | 86 |
| 138 HWY | 82 |
| ROXBURY DR | 62 |
| FAYETTEVILLE RD | 60 |
| PINE GROVE RD | 58 |
| LAKE RIDGE PKY | 56 |
| BETHSAIDA RD | 54 |
| ROUNTREE RD | 52 |
| WALKER RD | 48 |
| FLAT SHOALS RD | 42 |
| CHATEAU LN | 40 |
| KING RD | 40 |
| HIGHWAY 138 | 36 |
| GARDEN LAKE DR | 34 |
| THOMAS RD | 34 |
| BROOKVIEW DR | 30 |
| HWY 85 | 24 |
| LEES MILL RD | 24 |
| PINEGLEN DR | 24 |
| DAYNA DR | 22 |
| Other | 610 |
2005 - 2018 National Fire Incident Reporting System (NFIRS) incidents
- Incident types reported to NFIRS in Riverdale, GA
- 33,79569.3%Rescue & EMS
- 5,02710.3%Service Call
- 4,0708.3%Good Intent Call
- 3,0106.2%Fire
- 1,6843.5%Hazardous Condition
- 1,0632.2%False Alarm
- 750.2%Special Incident
- Fire incident types reported to NFIRS in Riverdale, GA
- 1,28942.8%Outside Fires
- 1,22040.5%Structure Fires
- 46415.4%Mobile Property/Vehicle Fires
- 371.2%Other
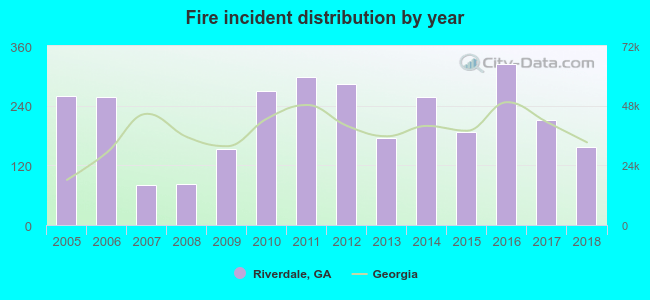 Based on the data from the years 2005 - 2018 the average number of fires per year is 214. The highest number of fire incidents - 324 took place in 2016, and the least - 80 in 2007. The data has a decreasing trend.
The average number of yearly fire incidents per 10k residents in Riverdale, GA compared to nearest cities:
(Note: Based on data for the last 3 years, including only cities with population 5,000 and above)
| Riverdale: | 147.4 |
| Morrow: | 142.3 |
| Forest Park: | 76.9 |
| College Park: | 167.6 |
| Conley: | 53.0 |
| Hapeville: | 43.0 |
| Union City: | 69.7 |
| East Point: | 37.5 |
| Fayetteville: | 114.4 |
 The median response time based on all reported fire incidents is 5 minutes. This is lower compared to the Georgia median value.
The median response time in Riverdale, GA compared to nearest cities:
(Note: Based on data for all years, including only cities with at least 500 fire incidents)
| Riverdale: | 5 minutes |
| Morrow: | 5 minutes |
| Jonesboro: | 6 minutes |
| Forest Park: | 6 minutes |
| College Park: | 6 minutes |
| Hapeville: | 3 minutes |
| Union City: | 5 minutes |
| East Point: | 6 minutes |
| Fayetteville: | 6 minutes |
 Based on the data from the years 2005 - 2018 the average number of fire-related yearly casualties is 2. The highest number of casualties - 6 took place in 2012, and the lowest - 0 in 2009. The data has a constant trend.
The average number of injuries per 1,000 fire incidents is 11. This indicator was the highest - 25 in 2007, and the lowest 0 in 2009. The trend for casualties per 1,000 fires is rising. Compared to the Georgia value the number of injuries per 1,000 incidents is similar.
Based on the data from the years 2005 - 2018 the average number of fire-related yearly casualties is 2. The highest number of casualties - 6 took place in 2012, and the lowest - 0 in 2009. The data has a constant trend.
The average number of injuries per 1,000 fire incidents is 11. This indicator was the highest - 25 in 2007, and the lowest 0 in 2009. The trend for casualties per 1,000 fires is rising. Compared to the Georgia value the number of injuries per 1,000 incidents is similar.Casualties per 1,000 incidents in Riverdale, GA compared to nearest cities:
(Note: Based on data for all years, including only cities with at least 500 fire incidents)
| Riverdale: | 10.6 |
| Morrow: | 13.0 |
| Jonesboro: | 11.6 |
| Forest Park: | 36.9 |
| College Park: | 4.6 |
| Hapeville: | 0.0 |
| Union City: | 4.5 |
| East Point: | 9.2 |
| Fayetteville: | 12.2 |
 25.8% incidents where reported in the morning and 74.2% in the evening. The most fires (15.9%) took place on Saturday, and the least (13.1%) on Thursday.
 According to the 3,010 fire incident reports from years 2005 - 2018 most fires (11.4%) took place during March, and the least (5.9%) in August.
 Out of all 48,769 cases reported during the years 2005 - 2018, the most belonged to the categories: Rescue & EMS (69.3%), Service Call (10.3%), and Good Intent Call (8.3%).
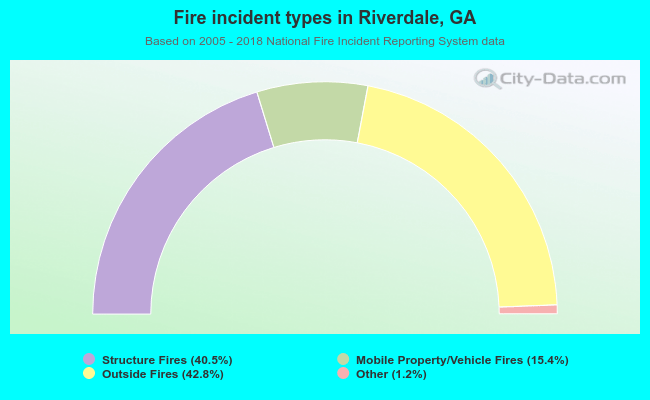 When looking into fire subcategories, the most reports belonged to: Outside Fires (42.8%), and Structure Fires (40.5%).