Crime rate in Tulsa, Oklahoma (OK): murders, rapes, robberies, assaults, burglaries, thefts, auto thefts, arson, law enforcement employees, police officers, crime map
Crime rate in Tulsa, OK
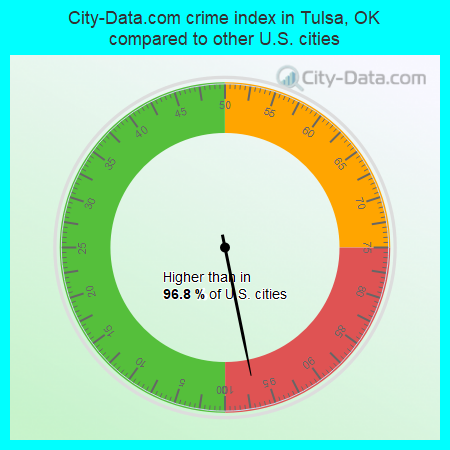
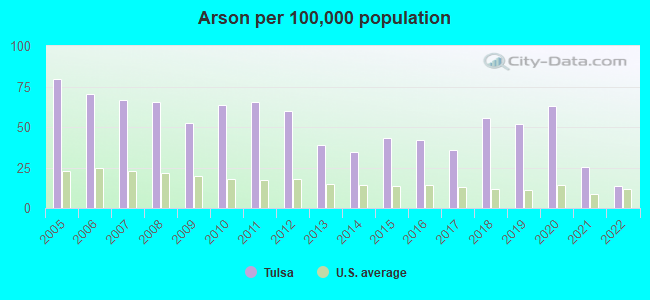
The 2022 crime rate in Tulsa, OK is 504 (City-Data.com crime index), which is 2.0 times higher than the U.S. average. It was higher than in 96.8% U.S. cities. The 2022 Tulsa crime rate fell by 15% compared to 2021. The number of homicides stood at 57 - a decrease of 2 compared to 2021. In the last 5 years Tulsa has seen decline of violent crime and decreasing property crime.See how dangerous Tulsa, OK is compared to the nearest cities:
(Note: Higher means more crime)
(Note: Higher means more crime)
| Tulsa: | 504.0 |
| Jenks: | 95.6 |
| Sand Springs: | 246.3 |
| Catoosa: | 296.8 |
| Broken Arrow: | 137.1 |
| Sperry: | 286.7 |
| Bixby: | 105.8 |
| Owasso: | 126.7 |
| Sapulpa: | 208.4 |
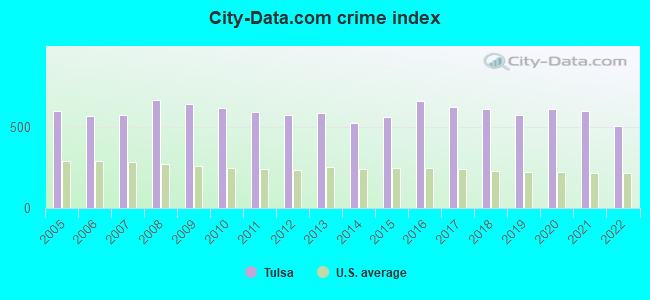
The City-Data.com crime index weighs serious crimes and violent crimes more heavily. Higher means more crime, U.S. average is 246.1. It adjusts for the number of visitors and daily workers commuting into cities.
- means the value is bigger than the state average.- means the value is much bigger than the state average.
According to our research of Oklahoma and other state lists, there were 471 registered sex offenders living in Tulsa, Oklahoma as of May 10, 2024.
The ratio of all residents to sex offenders in Tulsa is 857 to 1.
The ratio of registered sex offenders to all residents in this city is lower than the state average.
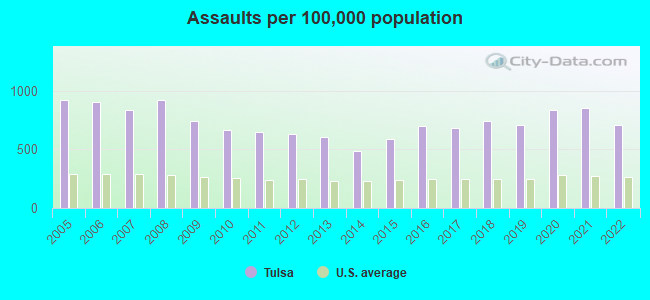
Violent crime rate in 2022
| Tulsa: | 530.3 |
| U.S. Average: | 219.8 |
Violent crime rate in 2021
| Tulsa: | 626.7 |
| U.S. Average: | 224.8 |
Violent crime rate in 2020
| Tulsa: | 640.2 |
| U.S. Average: | 228.2 |
Violent crime rate in 2019
| Tulsa: | 556.4 |
| U.S. Average: | 219.9 |
Violent crime rate in 2018
| Tulsa: | 607.2 |
| U.S. Average: | 221.2 |
Violent crime rate in 2017
| Tulsa: | 598.6 |
| U.S. Average: | 226.2 |
Violent crime rate in 2016
| Tulsa: | 628.3 |
| U.S. Average: | 227.3 |
Violent crime rate in 2015
| Tulsa: | 517.8 |
| U.S. Average: | 219.3 |
Violent crime rate in 2014
| Tulsa: | 459.0 |
| U.S. Average: | 211.1 |
Violent crime rate in 2013
| Tulsa: | 555.1 |
| U.S. Average: | 214.2 |
Violent crime rate in 2012
| Tulsa: | 550.4 |
| U.S. Average: | 187.4 |
Violent crime rate in 2011
| Tulsa: | 552.0 |
| U.S. Average: | 187.1 |
Violent crime rate in 2010
| Tulsa: | 601.9 |
| U.S. Average: | 195.7 |
Violent crime rate in 2009
| Tulsa: | 617.5 |
| U.S. Average: | 208.9 |
Violent crime rate in 2008
| Tulsa: | 695.1 |
| U.S. Average: | 222.5 |
Violent crime rate in 2007
| Tulsa: | 550.0 |
| U.S. Average: | 229.1 |
Violent crime rate in 2006
| Tulsa: | 570.6 |
| U.S. Average: | 232.6 |
Violent crime rate in 2005
| Tulsa: | 592.3 |
| U.S. Average: | 227.0 |
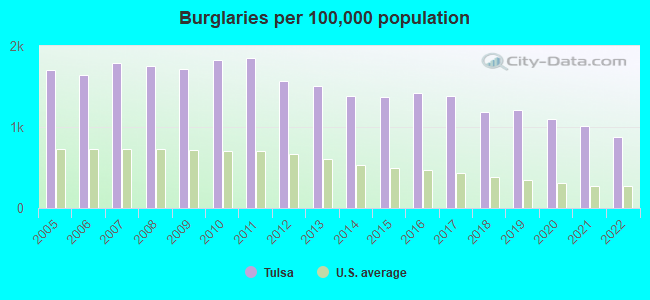
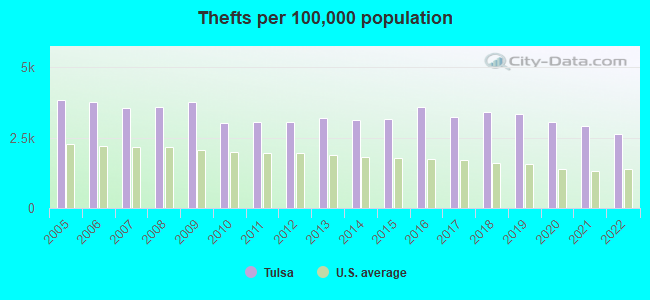
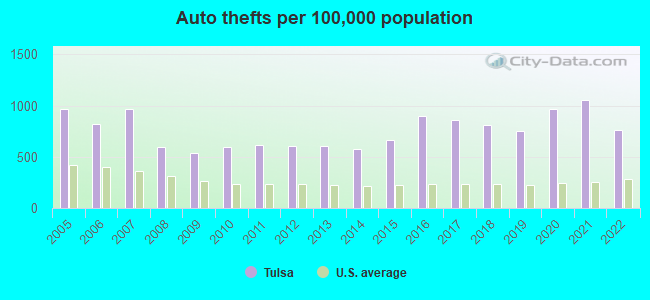
Property crime rate in 2022
| Tulsa: | 421.4 |
| U.S. Average: | 166.5 |
Property crime rate in 2021
| Tulsa: | 506.6 |
| U.S. Average: | 157.8 |
Property crime rate in 2020
| Tulsa: | 517.0 |
| U.S. Average: | 169.6 |
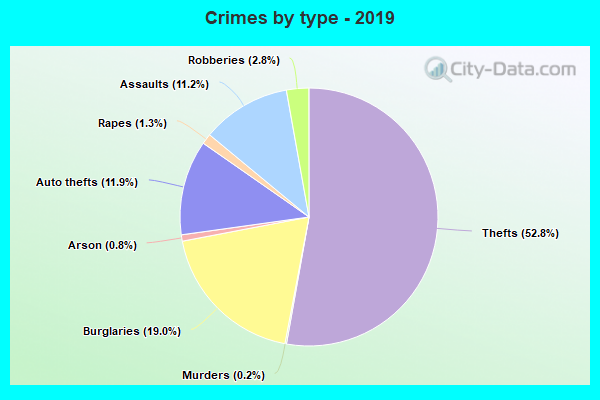
Property crime rate in 2019
| Tulsa: | 522.0 |
| U.S. Average: | 179.7 |
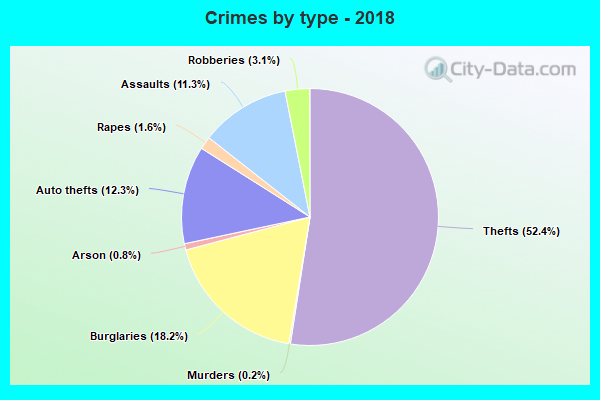
Property crime rate in 2018
| Tulsa: | 531.0 |
| U.S. Average: | 190.2 |
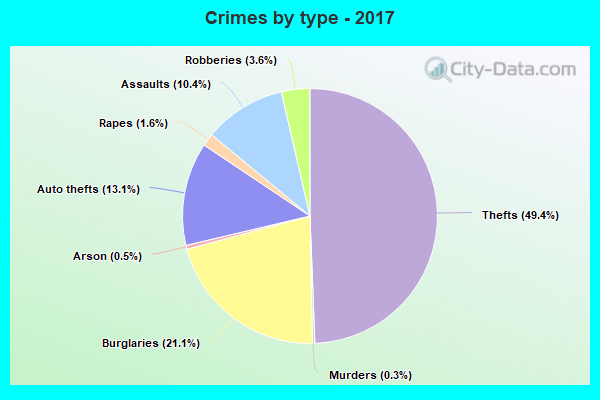
Property crime rate in 2017
| Tulsa: | 564.8 |
| U.S. Average: | 206.4 |
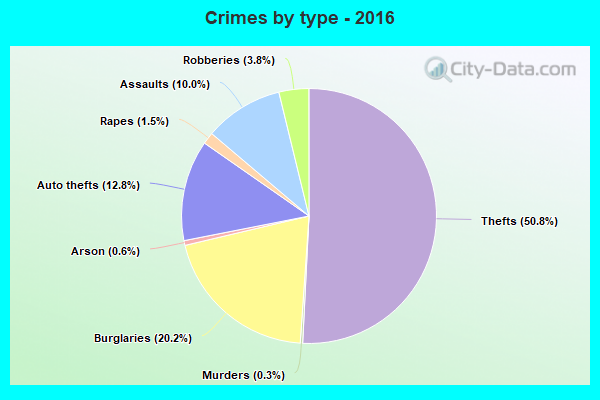
Property crime rate in 2016
| Tulsa: | 599.1 |
| U.S. Average: | 216.6 |
Property crime rate in 2015
| Tulsa: | 532.1 |
| U.S. Average: | 221.5 |
Property crime rate in 2014
| Tulsa: | 518.4 |
| U.S. Average: | 230.8 |
Property crime rate in 2013
| Tulsa: | 552.1 |
| U.S. Average: | 250.4 |
Property crime rate in 2012
| Tulsa: | 555.7 |
| U.S. Average: | 267.3 |
Property crime rate in 2011
| Tulsa: | 616.6 |
| U.S. Average: | 273.5 |
Property crime rate in 2010
| Tulsa: | 606.0 |
| U.S. Average: | 276.4 |
Property crime rate in 2009
| Tulsa: | 613.8 |
| U.S. Average: | 285.6 |
Property crime rate in 2008
| Tulsa: | 620.7 |
| U.S. Average: | 302.2 |
Property crime rate in 2007
| Tulsa: | 569.4 |
| U.S. Average: | 309.2 |
Property crime rate in 2006
| Tulsa: | 534.5 |
| U.S. Average: | 317.3 |
Property crime rate in 2005
| Tulsa: | 567.2 |
| U.S. Average: | 322.3 |

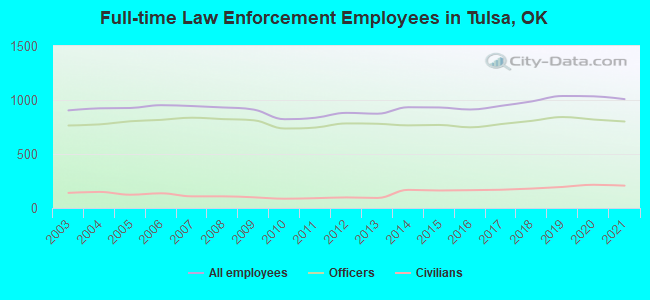
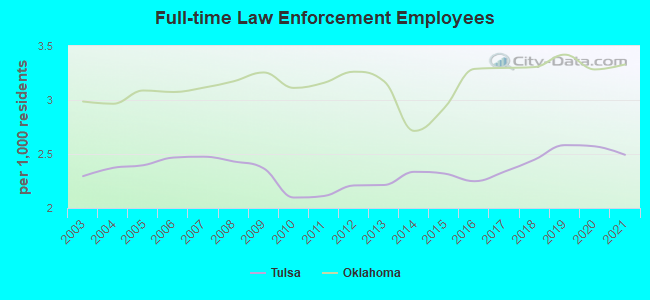
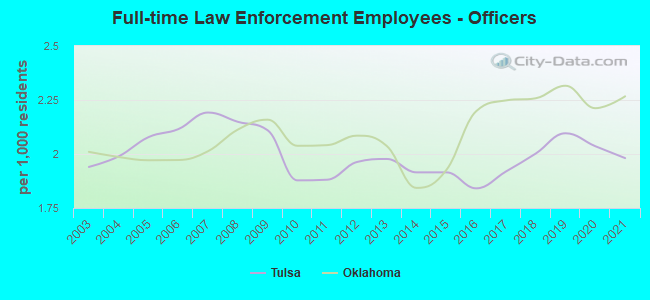
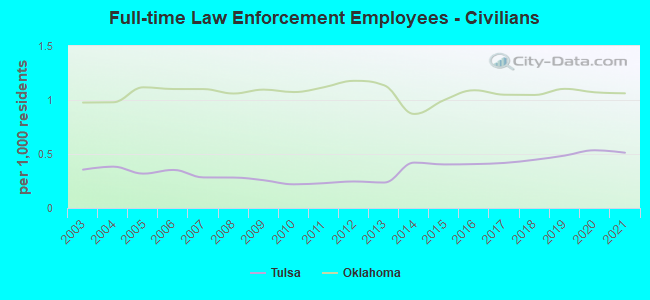
Full-time law enforcement employees in 2021, including police officers: 1,008 (801 officers - 685 male; 116 female).
| Officers per 1,000 residents here: | 1.98 |
| Oklahoma average: | 2.27 |
Full-time law enforcement employees in 2020, including police officers: 1,034 (819 officers - 705 male; 114 female).
| Officers per 1,000 residents here: | 2.04 |
| Oklahoma average: | 2.21 |
Full-time law enforcement employees in 2019, including police officers: 1,037 (842 officers - 733 male; 109 female).
| Officers per 1,000 residents here: | 2.10 |
| Oklahoma average: | 2.32 |
Full-time law enforcement employees in 2018, including police officers: 987 (807 officers - 705 male; 102 female).
| Officers per 1,000 residents here: | 2.00 |
| Oklahoma average: | 2.26 |
Full-time law enforcement employees in 2017, including police officers: 946 (777 officers - 673 male; 104 female).
| Officers per 1,000 residents here: | 1.92 |
| Oklahoma average: | 2.25 |
Full-time law enforcement employees in 2016, including police officers: 912 (747 officers - 645 male; 102 female).
| Officers per 1,000 residents here: | 1.84 |
| Oklahoma average: | 2.20 |
Full-time law enforcement employees in 2015, including police officers: 931 (769 officers - 661 male; 108 female).
| Officers per 1,000 residents here: | 1.92 |
| Oklahoma average: | 1.93 |
Full-time law enforcement employees in 2014, including police officers: 933 (765 officers - 656 male; 109 female).
| Officers per 1,000 residents here: | 1.91 |
| Oklahoma average: | 1.84 |
Full-time law enforcement employees in 2013, including police officers: 873 (780 officers - 669 male; 111 female).
| Officers per 1,000 residents here: | 1.98 |
| Oklahoma average: | 2.04 |
Full-time law enforcement employees in 2012, including police officers: 881 (783 officers - 673 male; 110 female).
| Officers per 1,000 residents here: | 1.96 |
| Oklahoma average: | 2.08 |
Full-time law enforcement employees in 2011, including police officers: 836 (745 officers - 644 male; 101 female).
| Officers per 1,000 residents here: | 1.88 |
| Oklahoma average: | 2.04 |
Full-time law enforcement employees in 2010, including police officers: 822 (736 officers - 627 male; 109 female).
| Officers per 1,000 residents here: | 1.88 |
| Oklahoma average: | 2.04 |
Full-time law enforcement employees in 2009, including police officers: 911 (812 officers - 692 male; 120 female).
| Officers per 1,000 residents here: | 2.11 |
| Oklahoma average: | 2.16 |
Full-time law enforcement employees in 2008, including police officers: 931 (823 officers - 700 male; 123 female).
| Officers per 1,000 residents here: | 2.15 |
| Oklahoma average: | 2.11 |
Full-time law enforcement employees in 2007, including police officers: 944 (836 officers - 711 male; 125 female).
| Officers per 1,000 residents here: | 2.19 |
| Oklahoma average: | 2.01 |
Full-time law enforcement employees in 2006, including police officers: 952 (816 officers - 694 male; 122 female).
| Officers per 1,000 residents here: | 2.11 |
| Oklahoma average: | 1.97 |
Full-time law enforcement employees in 2005, including police officers: 926 (803 officers - 682 male; 121 female).
| Officers per 1,000 residents here: | 2.08 |
| Oklahoma average: | 1.97 |
Full-time law enforcement employees in 2004, including police officers: 923 (774 officers - 665 male; 109 female).
| Officers per 1,000 residents here: | 1.99 |
| Oklahoma average: | 1.99 |
Full-time law enforcement employees in 2003, including police officers: 904 (764 officers - 651 male; 113 female).
| Officers per 1,000 residents here: | 1.94 |
| Oklahoma average: | 2.01 |


Zip codes: 74103, 74104, 74105, 74106, 74110, 74112, 74114, 74115, 74119, 74120, 74128, 74129, 74130, 74135, 74136, 74145.