Estimated zip code population in 2022: 2,048 Zip code population in 2010: 2,065 Zip code population in 2000: 2,624
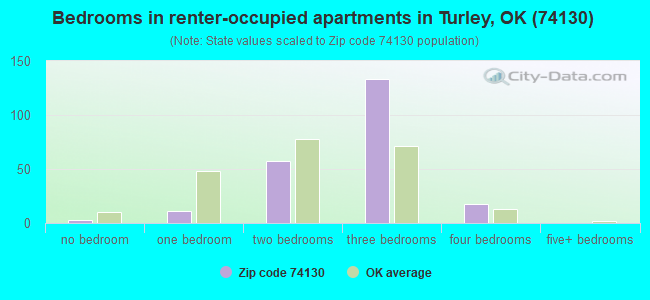
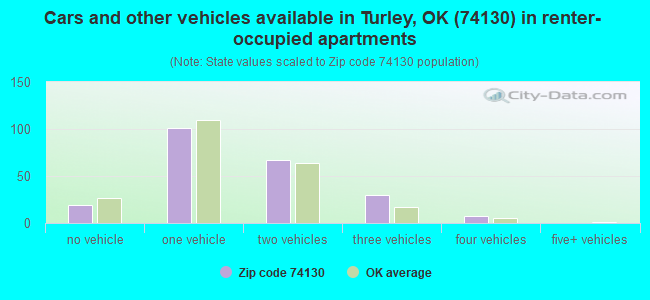
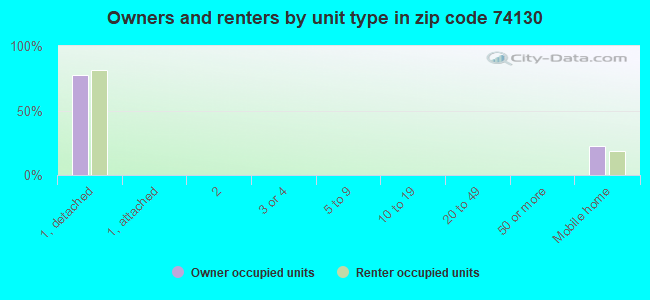
Houses and condos: 912 Renter-occupied apartments: 224
% of renters here:
31%
State:
35%
March 2022 cost of living index in zip code 74130: 85.8 (less than average, U.S. average is 100)
Land area: 4.1 sq. mi. Water area: 0.0 sq. mi.
Population density: 504 people per square mile
(low).
OSM Map
General Map
Google Map
MSN Map
OSM Map
General Map
Google Map
MSN Map
OSM Map
General Map
Google Map
MSN Map
OSM Map
General Map
Google Map
MSN Map
Please wait while loading the map...
Real estate property taxes paid for housing units in 2022:
This zip code:
0.8% ($683)
Oklahoma:
0.8% ($1,501)
Median real estate property taxes paid for housing units with mortgages in 2022: $749 (0.7%) Median real estate property taxes paid for housing units with no mortgage in 2022: $597 (0.8%)
Business Search- 14 Million verified businesses
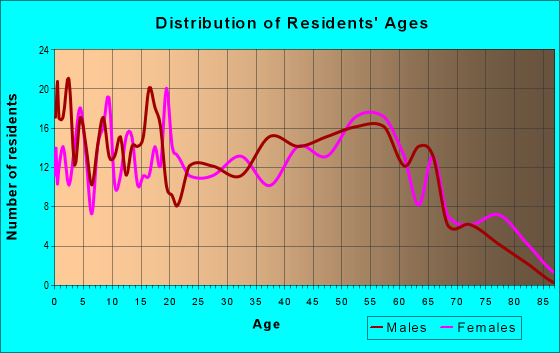
Males: 1,100
(53.7%)
Females: 948
(46.3%)
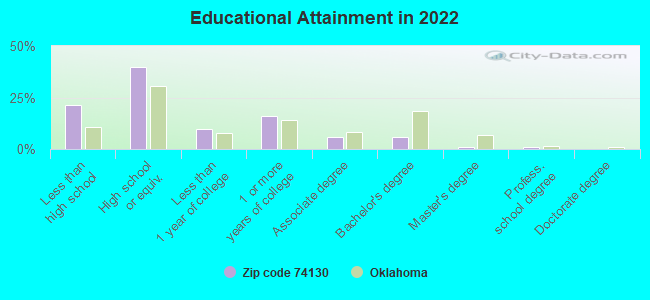
For population 25 years and over in 74130:
High school or higher: 76.7%
Bachelor's degree or higher: 7.4%
Graduate or professional degree: 1.8%
Unemployed: 9.2%
Mean travel time to work (commute): 21.7 minutes
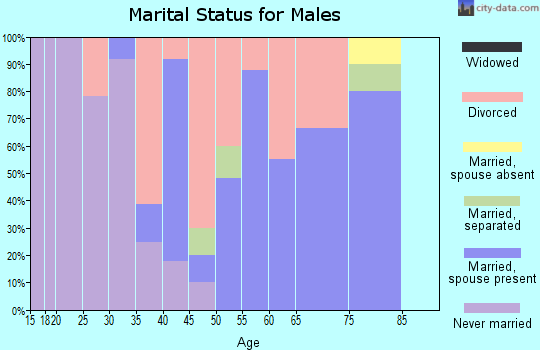
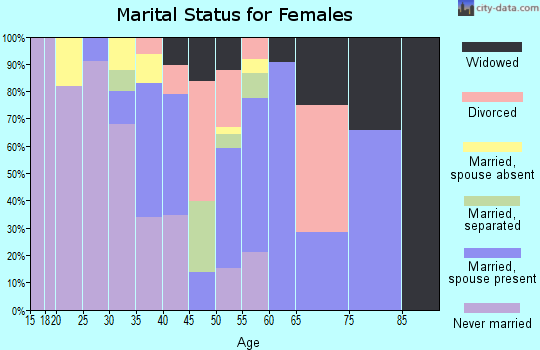
For population 15 years and over in 74130:
Never married: 37.3%
Now married: 38.5%
Separated: 2.9%
Widowed: 7.4%
Divorced: 13.9%
Zip code 74130 compared to state average:
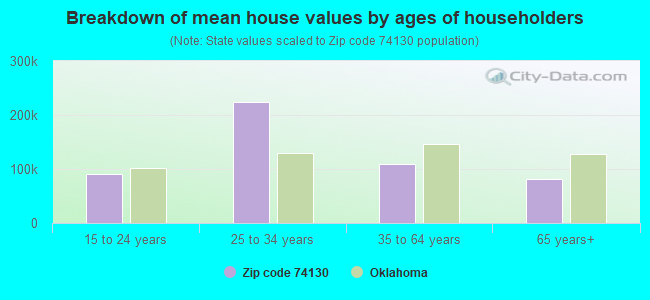
Median house value below state average.
Unemployed percentage above state average.
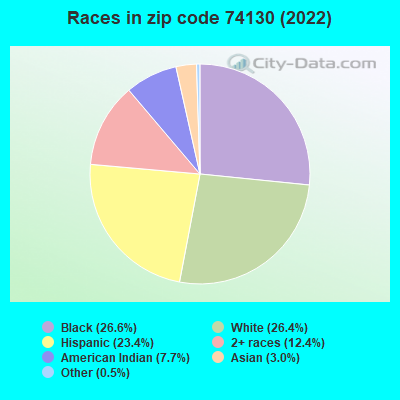
Black race population percentage significantly above state average.
Hispanic race population percentage above state average.
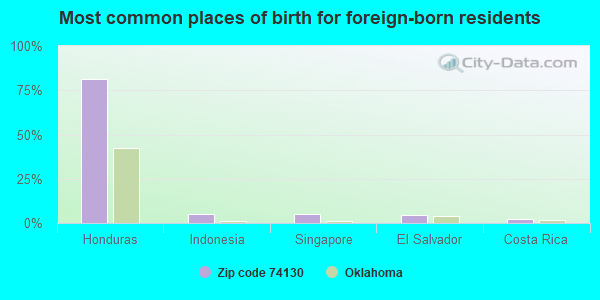
Foreign-born population percentage above state average.
Length of stay since moving in above state average.
Percentage of population with a bachelor's degree or higher significantly below state average.
Averages for the 2020 tax year for zip code 74130, filed in 2021:
Average Adjusted Gross Income (AGI) in 2020: $30,540 (Individual Income Tax Returns)
Here:
$30,540
State:
$63,060
Salary/wage: $28,235 (reported on 84.3% of returns)
Here:
$28,235
State:
$52,427
(% of AGI for various income ranges: 1123.0% for AGIs below $25k, 3623.9% for AGIs $25k-50k, 6928.3% for AGIs $50k-75k, 6167.5% for AGIs $75k-100k)
Taxable interest for individuals: $333 (reported on 10.1% of returns)
This zip code:
$333
Oklahoma:
$1,603
(% of AGI for various income ranges: 4.6% for AGIs below $25k, 4.3% for AGIs $25k-50k, 5.0% for AGIs $50k-75k)
Ordinary dividends: $867 (reported on 3.4% of returns)
Here:
$867
State:
$7,001
(% of AGI for various income ranges: 11.3% for AGIs $25k-50k)
Net capital gain/loss in AGI: +$1,200 (reported on 2.2% of returns)
Here:
+$1,200
State:
+$19,855
(% of AGI for various income ranges: 6.5% for AGIs below $25k)
Profit/loss from business: +$4,753 (reported on 16.9% of returns)
Here:
+$4,753
State:
+$9,904
(% of AGI for various income ranges: 167.8% for AGIs below $25k, 42.2% for AGIs $25k-50k)
Taxable individual retirement arrangement distribution: $6,800 (reported on 2.2% of returns)
74130:
$6,800
Oklahoma:
$20,476
(% of AGI for various income ranges: 36.8% for AGIs below $25k)
Earned income credit: $2,722 (reported on 36.0% of returns)
Here:
$2,722
State:
$2,435
(% of AGI for various income ranges: 173.2% for AGIs below $25k, 100.0% for AGIs $25k-50k)
Percentage of individuals using paid preparers for their 2020 taxes: 93.3%
Here:
93%
State:
94%
(% for various income ranges: 93.5% for AGIs below $25k, 96.6% for AGIs $25k-50k, 87.5% for AGIs $50k-75k, 100.0% for AGIs $75k-100k, 66.7% for AGIs $100k-200k)
Averages for the 2012 tax year for zip code 74130, filed in 2013:
Average Adjusted Gross Income (AGI) in 2012: $30,704 (Individual Income Tax Returns)
Here:
$30,704
State:
$58,581
Salary/wage: $29,385 (reported on 87.7% of returns)
Here:
$29,385
State:
$45,973
(% of AGI for various income ranges: 79.4% for AGIs below $25k, 88.6% for AGIs $25k-50k, 84.5% for AGIs $50k-75k, 79.5% for AGIs $75k-100k)
Taxable interest for individuals: $250 (reported on 12.3% of returns)
This zip code:
$250
Oklahoma:
$1,625
(% of AGI for various income ranges: 0.1% for AGIs $25k-50k, 0.1% for AGIs $50k-75k)
Ordinary dividends: $300 (reported on 4.9% of returns)
Here:
$300
State:
$6,374
Net capital gain/loss in AGI: +$967 (reported on 3.7% of returns)
Here:
+$967
State:
+$24,023
Profit/loss from business: +$4,600 (reported on 16.0% of returns)
Here:
+$4,600
State:
+$11,913
(% of AGI for various income ranges: 8.5% for AGIs below $25k, 0.6% for AGIs $25k-50k, 1.6% for AGIs $50k-75k)
Taxable individual retirement arrangement distribution: $7,167 (reported on 3.7% of returns)
74130:
$7,167
Oklahoma:
$15,242
Total itemized deductions: $15,980 (27% of AGI, reported on 12.3% of returns)
Here:
$15,980
State:
$24,882
Here:
27.0% of AGI
State:
18.8% of AGI
(% of AGI for various income ranges: 6.8% for AGIs $25k-50k, 7.2% for AGIs $50k-75k, 11.9% for AGIs $75k-100k)
Charity contributions: $6,450 (reported on 7.4% of returns)
Here:
$6,450
State:
$6,591
Taxes paid: $3,060 (reported on 12.3% of returns)
74130:
$3,060
State:
$7,196
(% of AGI for various income ranges: 1.0% for AGIs $25k-50k, 1.4% for AGIs $50k-75k, 2.9% for AGIs $75k-100k)
Earned income credit: $2,574 (reported on 38.3% of returns)
Here:
$2,574
State:
$2,354
(% of AGI for various income ranges: 11.4% for AGIs below $25k, 1.8% for AGIs $25k-50k)
Percentage of individuals using paid preparers for their 2012 taxes: 45.7%
Here:
46%
State:
56%
(% for various income ranges: 41.5% for AGIs below $25k, 48.1% for AGIs $25k-50k, 50.0% for AGIs $50k-75k, 60.0% for AGIs $75k-100k)
Averages for the 2004 tax year for zip code 74130, filed in 2005:
Average Adjusted Gross Income (AGI) in 2004: $24,439 (Individual Income Tax Returns)
Here:
$24,439
State:
$41,245
Salary/wage: $24,382 (reported on 89.5% of returns)
Here:
$24,382
State:
$35,318
(% of AGI for various income ranges: 88.9% for AGIs below $10k, 85.9% for AGIs $10k-25k, 93.5% for AGIs $25k-50k, 87.4% for AGIs $50k-75k, 84.7% for AGIs $75k-100k)
Taxable interest for individuals: $679 (reported on 18.9% of returns)
This zip code:
$679
Oklahoma:
$1,745
(% of AGI for various income ranges: 1.2% for AGIs below $10k, 1.2% for AGIs $10k-25k, 0.3% for AGIs $25k-50k, 0.1% for AGIs $50k-75k)
Taxable dividends: $174 (reported on 5.4% of returns)
Here:
$174
State:
$2,920
Net capital gain/loss: +$565 (reported on 2.7% of returns)
Here:
+$565
State:
+$10,653
Profit/loss from business: +$1,213 (reported on 11.0% of returns)
Here:
+$1,213
State:
+$8,532
(% of AGI for various income ranges: -10.6% for AGIs below $10k, 3.7% for AGIs $10k-25k, -0.2% for AGIs $25k-50k, 0.9% for AGIs $50k-75k)
Total itemized deductions: $12,390 (27% of AGI, reported on 17.0% of returns)
Here:
$12,390
State:
$17,093
Here:
27.0% of AGI
State:
20.5% of AGI
(% of AGI for various income ranges: 3.6% for AGIs $10k-25k, 9.7% for AGIs $25k-50k, 12.6% for AGIs $50k-75k, 13.9% for AGIs $75k-100k)
Charity contributions deductions: $3,631 (8% of AGI, reported on 15.2% of returns)
Here:
$3,631
State:
$4,240
Here:
8.0% of AGI
State:
4.8% of AGI
Total tax: $2,526 (reported on 58.3% of returns)
74130:
$2,526
State:
$6,542
(% of AGI for various income ranges: 2.4% for AGIs below $10k, 3.0% for AGIs $10k-25k, 5.6% for AGIs $25k-50k, 9.0% for AGIs $50k-75k, 12.2% for AGIs $75k-100k)
Earned income credit: $2,073 (reported on 36.6% of returns)
Here:
$2,073
State:
$1,830
Percentage of individuals using paid preparers for their 2004 taxes: 66.2%
Here:
66%
State:
63%
(% for various income ranges: 64.3% for AGIs below $10k, 68.2% for AGIs $10k-25k, 66.4% for AGIs $25k-50k, 61.5% for AGIs $50k-75k, 68.8% for AGIs $75k-100k)
Likely homosexual households (counted as self-reported same-sex unmarried-partner households)
Lesbian couples: 0.3% of all households
Gay men: 0.0% of all households
Household received Food Stamps/SNAP in the past 12 months: 184 Household did not receive Food Stamps/SNAP in the past 12 months: 557
Women who had a birth in the past 12 months: 30 (15 now married, 14 unmarried) Women who did not have a birth in the past 12 months: 376 (152 now married, 224 unmarried)
Housing units in zip code 74130 with a mortgage: 214 Houses without a mortgage: 10
Median monthly owner costs for units with a mortgage: $1,024 Median monthly owner costs for units without a mortgage: $409
Residents with income below the poverty level in 2022:
This zip code:
27.0%
Whole state:
15.7%
Residents with income below 50% of the poverty level in 2022:
This zip code:
22.6%
Whole state:
8.3%
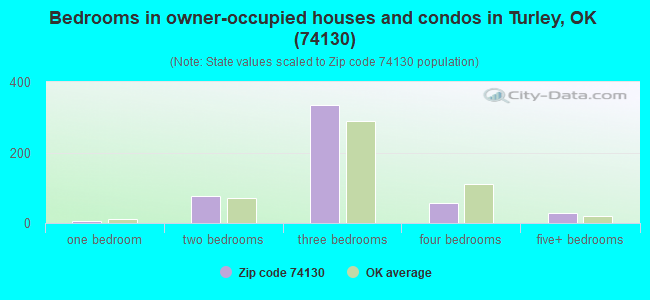
Median number of rooms in houses and condos:
Here:
5.4
State:
6.1
Median number of rooms in apartments:
Here:
5.2
State:
4.5
Notable locations in this zip code not listed on our city pages
187 married couples with children.
311 single-parent households (95 men, 216 women).
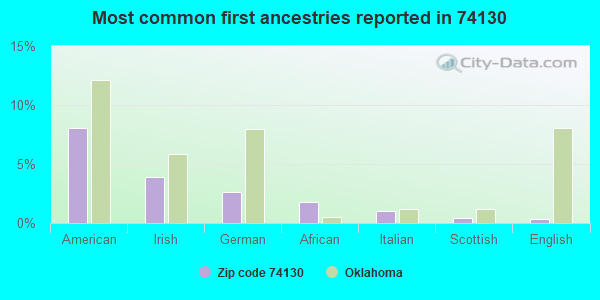
75.4% of residents of 74130 zip code speak English at home.
22.0% of residents speak Spanish at home (52% very well, 16% well, 24% not well, 7% not at all).
2.2% of residents speak Asian or Pacific Island language at home (42% very well, 48% well, 10% not well).
0.6% of residents speak other language at home (100% very well).
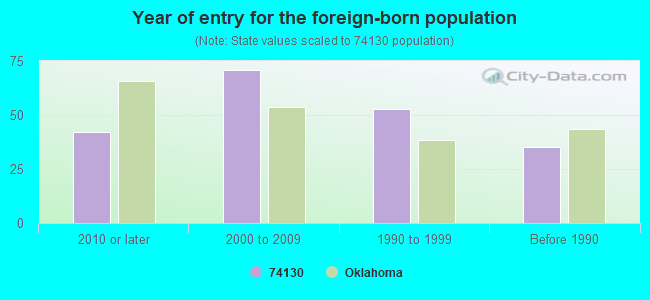
Foreign born population: 200 (9.8%) (16.4% of them are naturalized citizens)
Housing units lacking complete plumbing facilities: 7.7% Housing units lacking complete kitchen facilities: 10.4%
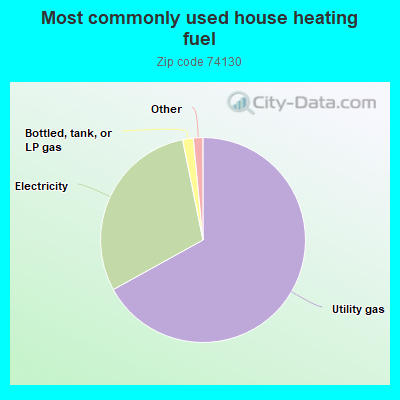
67.1%Utility gas
29.9%Electricity
1.7%Bottled, tank, or LP gas
0.9%Wood
0.7%Other fuel
Population in 1990: 2,553. Population change in the 1990s: +71 (+2.8%).
Place of birth for U.S.-born residents:
This state: 1,372
Northeast: 18
Midwest: 75
South: 214
West: 156
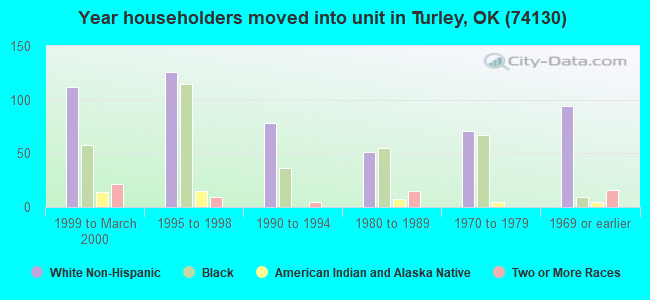
47% of the 74130 zip code residents lived in the same house 5 years ago. Out of people who lived in different houses, 75% lived in this county. Out of people who lived in different counties, 50% lived in Oklahoma.
89% of the 74130 zip code residents lived in the same house 1 year ago. Out of people who lived in different houses, 57% moved from this county. Out of people who lived in different houses, 16% moved from different county within same state. Out of people who lived in different houses, 24% moved from different state.
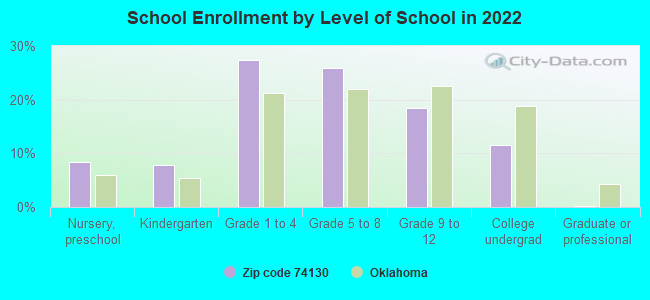
Private vs. public school enrollment:
Students in private schools in grades 1 to 8 (elementary and middle school): 59
Here:
22.0%
Oklahoma:
11.7%
Students in private schools in grades 9 to 12 (high school): 28
Here:
28.7%
Oklahoma:
11.7%
Students in private undergraduate colleges: 5
Here:
9.7%
Oklahoma:
19.3%
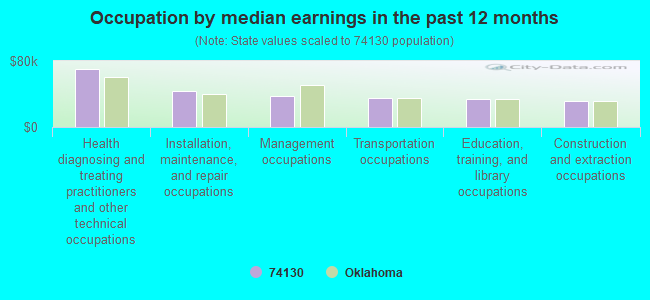
Occupation by median earnings in the past 12 months ($)
70,248Health diagnosing and treating practitioners and other technical occupations
43,177Installation, maintenance, and repair occupations
38,119Management occupations
34,992Transportation occupations
34,384Education, training, and library occupations
31,913Construction and extraction occupations
Top industries in this zip code by the number of employees in 2005:
Utilities: Fossil Fuel Electric Power Generation (10-19 employees: 1 establishment)
Wholesale Trade: Motor Vehicle Supplies and New Parts Merchant Wholesalers (10-19: 1)
Administrative and Support and Waste Management and Remediation Services: Security Guards and Patrol Services (5-9: 1)
Construction: Plumbing, Heating, and Air-Conditioning Contractors (5-9: 1)
Accommodation and Food Services: Full-Service Restaurants (5-9: 1)
Health Care and Social Assistance: Other Residential Care Facilities (1-4: 2)
Construction: Framing Contractors (1-4: 1)
Construction: Electrical Contractors (1-4: 1)
Fatal accident statistics in 2013:
Fatal accident count: 1
Vehicles involved in fatal accidents: 1
Fatal accidents caused by drunken drivers: 1
Fatalities: 1
Persons involved in fatal accidents: 1
Pedestrians involved in fatal accidents: 1
Home Mortgage Disclosure Act Aggregated Statistics For Year 2009 (Based on 4 partial tracts)
A) FHA, FSA/RHS & VA Home Purchase Loans
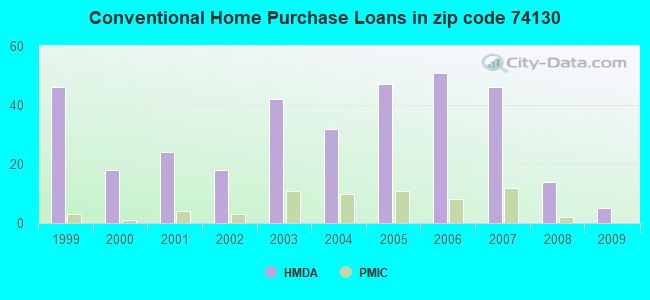
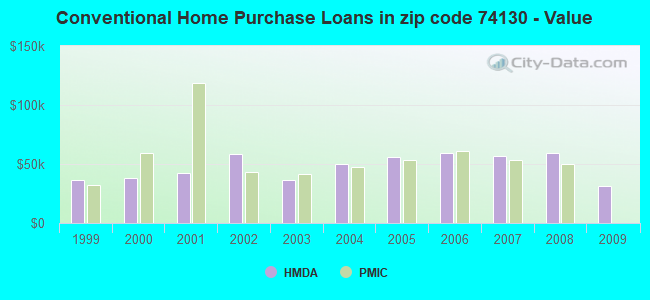
B) Conventional Home Purchase Loans
C) Refinancings
D) Home Improvement Loans
F) Non-occupant Loans on < 5 Family Dwellings (A B C & D)
G) Loans On Manufactured Home Dwelling (A B C & D)
Number
Average Value
Number
Average Value
Number
Average Value
Number
Average Value
Number
Average Value
Number
Average Value
LOANS ORIGINATED
1
$40,850
5
$31,198
16
$125,189
4
$16,215
6
$29,418
4
$36,882
APPLICATIONS APPROVED, NOT ACCEPTED
0
$0
0
$0
2
$42,455
1
$3,200
0
$0
0
$0
APPLICATIONS DENIED
1
$48,860
3
$50,140
21
$75,469
11
$24,348
7
$34,570
2
$54,470
APPLICATIONS WITHDRAWN
2
$98,970
2
$23,150
7
$100,950
1
$20,020
1
$20,020
0
$0
FILES CLOSED FOR INCOMPLETENESS
0
$0
0
$0
1
$39,250
0
$0
0
$0
0
$0
Aggregated Statistics For Year 2008 (Based on 4 partial tracts)
A) FHA, FSA/RHS & VA Home Purchase Loans
B) Conventional Home Purchase Loans
C) Refinancings
D) Home Improvement Loans
F) Non-occupant Loans on < 5 Family Dwellings (A B C & D)
G) Loans On Manufactured Home Dwelling (A B C & D)
Number
Average Value
Number
Average Value
Number
Average Value
Number
Average Value
Number
Average Value
Number
Average Value
LOANS ORIGINATED
12
$58,486
14
$59,287
24
$73,639
11
$21,209
12
$43,650
2
$35,645
APPLICATIONS APPROVED, NOT ACCEPTED
0
$0
5
$102,912
6
$36,183
1
$27,660
4
$47,015
2
$43,655
APPLICATIONS DENIED
6
$68,218
8
$46,169
75
$60,464
20
$27,743
10
$49,643
4
$30,838
APPLICATIONS WITHDRAWN
1
$62,230
1
$55,310
12
$74,624
1
$34,570
3
$41,943
0
$0
FILES CLOSED FOR INCOMPLETENESS
0
$0
2
$48,560
6
$96,185
0
$0
0
$0
1
$20,830
Aggregated Statistics For Year 2007 (Based on 4 partial tracts)
B) Conventional Home Purchase Loans
C) Refinancings
D) Home Improvement Loans
F) Non-occupant Loans on < 5 Family Dwellings (A B C & D)
G) Loans On Manufactured Home Dwelling (A B C & D)
Number
Average Value
Number
Average Value
Number
Average Value
Number
Average Value
Number
Average Value
LOANS ORIGINATED
46
$56,424
38
$53,005
13
$26,162
31
$50,621
2
$67,285
APPLICATIONS APPROVED, NOT ACCEPTED
9
$73,820
12
$61,062
6
$27,307
7
$40,990
1
$56,070
APPLICATIONS DENIED
20
$56,322
57
$69,820
24
$37,389
9
$47,033
7
$54,926
APPLICATIONS WITHDRAWN
11
$58,715
14
$74,129
2
$42,455
2
$39,055
1
$35,240
FILES CLOSED FOR INCOMPLETENESS
4
$60,400
6
$58,073
0
$0
0
$0
0
$0
Aggregated Statistics For Year 2006 (Based on 4 partial tracts)
A) FHA, FSA/RHS & VA Home Purchase Loans
B) Conventional Home Purchase Loans
C) Refinancings
D) Home Improvement Loans
F) Non-occupant Loans on < 5 Family Dwellings (A B C & D)
G) Loans On Manufactured Home Dwelling (A B C & D)
Number
Average Value
Number
Average Value
Number
Average Value
Number
Average Value
Number
Average Value
Number
Average Value
LOANS ORIGINATED
3
$54,733
51
$59,743
61
$68,118
16
$24,917
36
$44,259
2
$62,075
APPLICATIONS APPROVED, NOT ACCEPTED
0
$0
14
$72,462
18
$59,585
4
$53,822
11
$48,273
3
$36,043
APPLICATIONS DENIED
2
$54,470
36
$48,051
114
$54,728
44
$26,222
16
$38,482
6
$45,257
APPLICATIONS WITHDRAWN
0
$0
14
$42,101
40
$65,326
9
$42,379
8
$33,735
0
$0
FILES CLOSED FOR INCOMPLETENESS
1
$55,270
0
$0
9
$77,827
0
$0
0
$0
0
$0
Aggregated Statistics For Year 2005 (Based on 4 partial tracts)
A) FHA, FSA/RHS & VA Home Purchase Loans
B) Conventional Home Purchase Loans
C) Refinancings
D) Home Improvement Loans
F) Non-occupant Loans on < 5 Family Dwellings (A B C & D)
G) Loans On Manufactured Home Dwelling (A B C & D)
Number
Average Value
Number
Average Value
Number
Average Value
Number
Average Value
Number
Average Value
Number
Average Value
LOANS ORIGINATED
1
$40,100
47
$55,826
58
$47,160
16
$53,218
36
$45,404
2
$37,245
APPLICATIONS APPROVED, NOT ACCEPTED
0
$0
16
$65,965
32
$48,985
2
$23,145
7
$46,031
4
$46,560
APPLICATIONS DENIED
0
$0
34
$54,137
120
$51,390
43
$33,792
21
$45,091
15
$51,184
APPLICATIONS WITHDRAWN
1
$53,930
5
$90,650
77
$62,045
7
$39,303
4
$47,030
0
$0
FILES CLOSED FOR INCOMPLETENESS
0
$0
5
$78,656
5
$91,866
0
$0
1
$74,670
0
$0
Aggregated Statistics For Year 2004 (Based on 4 partial tracts)
A) FHA, FSA/RHS & VA Home Purchase Loans
B) Conventional Home Purchase Loans
C) Refinancings
D) Home Improvement Loans
F) Non-occupant Loans on < 5 Family Dwellings (A B C & D)
G) Loans On Manufactured Home Dwelling (A B C & D)
Number
Average Value
Number
Average Value
Number
Average Value
Number
Average Value
Number
Average Value
Number
Average Value
LOANS ORIGINATED
5
$55,424
32
$50,378
60
$56,129
20
$27,912
23
$54,358
1
$66,480
APPLICATIONS APPROVED, NOT ACCEPTED
0
$0
14
$40,761
23
$44,857
7
$55,100
6
$36,645
6
$41,102
APPLICATIONS DENIED
2
$39,960
25
$44,472
154
$50,253
37
$24,769
14
$40,729
16
$44,822
APPLICATIONS WITHDRAWN
1
$44,060
5
$53,012
57
$61,300
7
$26,579
2
$66,425
2
$53,935
FILES CLOSED FOR INCOMPLETENESS
0
$0
3
$66,690
4
$59,078
0
$0
0
$0
0
$0
Aggregated Statistics For Year 2003 (Based on 4 partial tracts)
A) FHA, FSA/RHS & VA Home Purchase Loans
B) Conventional Home Purchase Loans
C) Refinancings
D) Home Improvement Loans
F) Non-occupant Loans on < 5 Family Dwellings (A B C & D)
Number
Average Value
Number
Average Value
Number
Average Value
Number
Average Value
Number
Average Value
LOANS ORIGINATED
3
$54,820
42
$36,072
75
$53,141
11
$35,742
30
$36,733
APPLICATIONS APPROVED, NOT ACCEPTED
0
$0
9
$54,437
24
$45,620
0
$0
5
$44,054
APPLICATIONS DENIED
0
$0
26
$76,112
116
$53,792
20
$36,832
11
$90,872
APPLICATIONS WITHDRAWN
0
$0
5
$48,380
60
$56,911
4
$11,610
0
$0
FILES CLOSED FOR INCOMPLETENESS
2
$44,120
1
$51,260
8
$72,200
0
$0
2
$46,375
Aggregated Statistics For Year 2002 (Based on 2 partial tracts)
A) FHA, FSA/RHS & VA Home Purchase Loans
B) Conventional Home Purchase Loans
C) Refinancings
D) Home Improvement Loans
F) Non-occupant Loans on < 5 Family Dwellings (A B C & D)
Number
Average Value
Number
Average Value
Number
Average Value
Number
Average Value
Number
Average Value
LOANS ORIGINATED
7
$34,373
18
$58,692
39
$38,541
10
$7,191
6
$29,270
APPLICATIONS APPROVED, NOT ACCEPTED
0
$0
11
$48,649
22
$37,964
4
$24,890
6
$28,117
APPLICATIONS DENIED
1
$78,820
17
$41,077
86
$39,651
21
$9,416
7
$28,051
APPLICATIONS WITHDRAWN
0
$0
4
$28,348
46
$44,370
6
$23,047
4
$29,385
FILES CLOSED FOR INCOMPLETENESS
0
$0
3
$32,727
3
$46,093
0
$0
1
$45,630
Aggregated Statistics For Year 2001 (Based on 2 partial tracts)
A) FHA, FSA/RHS & VA Home Purchase Loans
B) Conventional Home Purchase Loans
C) Refinancings
D) Home Improvement Loans
F) Non-occupant Loans on < 5 Family Dwellings (A B C & D)
Number
Average Value
Number
Average Value
Number
Average Value
Number
Average Value
Number
Average Value
LOANS ORIGINATED
1
$59,460
24
$42,694
47
$47,898
6
$6,223
12
$29,961
APPLICATIONS APPROVED, NOT ACCEPTED
0
$0
6
$43,328
15
$41,299
4
$29,730
6
$23,968
APPLICATIONS DENIED
0
$0
14
$51,262
76
$39,592
11
$15,336
4
$41,830
APPLICATIONS WITHDRAWN
1
$66,370
0
$0
51
$49,184
4
$15,558
1
$63,610
FILES CLOSED FOR INCOMPLETENESS
0
$0
0
$0
6
$46,323
0
$0
0
$0
Aggregated Statistics For Year 2000 (Based on 2 partial tracts)
A) FHA, FSA/RHS & VA Home Purchase Loans
B) Conventional Home Purchase Loans
C) Refinancings
D) Home Improvement Loans
F) Non-occupant Loans on < 5 Family Dwellings (A B C & D)
Number
Average Value
Number
Average Value
Number
Average Value
Number
Average Value
Number
Average Value
LOANS ORIGINATED
8
$42,175
18
$37,950
43
$39,812
14
$11,556
7
$44,447
APPLICATIONS APPROVED, NOT ACCEPTED
0
$0
4
$34,225
19
$54,147
4
$13,138
1
$27,660
APPLICATIONS DENIED
0
$0
6
$37,567
55
$36,858
15
$9,679
7
$24,496
APPLICATIONS WITHDRAWN
1
$62,230
1
$51,160
26
$37,442
1
$24,890
0
$0
FILES CLOSED FOR INCOMPLETENESS
0
$0
3
$22,587
10
$44,250
0
$0
0
$0
Aggregated Statistics For Year 1999 (Based on 3 partial tracts)
A) FHA, FSA/RHS & VA Home Purchase Loans
B) Conventional Home Purchase Loans
C) Refinancings
D) Home Improvement Loans
F) Non-occupant Loans on < 5 Family Dwellings (A B C & D)
Detailed PMIC statistics for the following Tracts:0057.00
, 0091.04
2002 - 2018 National Fire Incident Reporting System (NFIRS) incidents
Based on the data from the years 2002 - 2018 the average number of fires per year is 18. The highest number of fires - 34 took place in 2009, and the least - 8 in 2006. The data has a decreasing trend.
When looking into fire subcategories, the most incidents belonged to: Outside Fires (53.3%), and Mobile Property/Vehicle Fires (22.9%).
Fire incident types reported to NFIRS in Zip Code 74130


 Nearest zip codes: 74110, 74117, 74106, 74115, 74126, 74073.


 Based on the data from the years 2002 - 2018 the average number of fires per year is 18. The highest number of fires - 34 took place in 2009, and the least - 8 in 2006. The data has a decreasing trend.
 When looking into fire subcategories, the most incidents belonged to: Outside Fires (53.3%), and Mobile Property/Vehicle Fires (22.9%).