Crime rate in Omaha, Nebraska (NE): murders, rapes, robberies, assaults, burglaries, thefts, auto thefts, arson, law enforcement employees, police officers, crime map
Crime rate in Omaha, NE
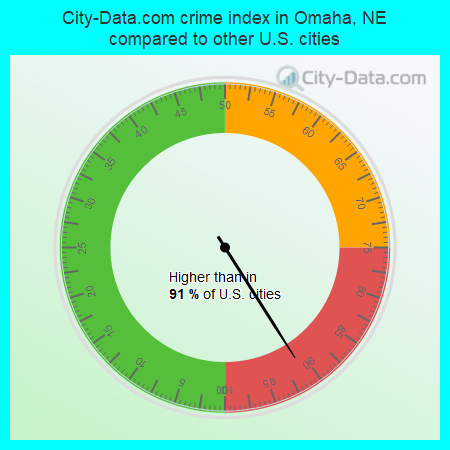
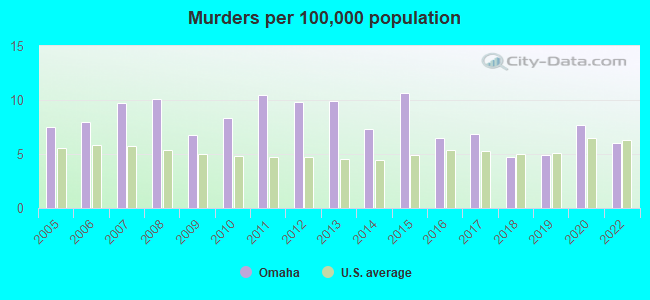
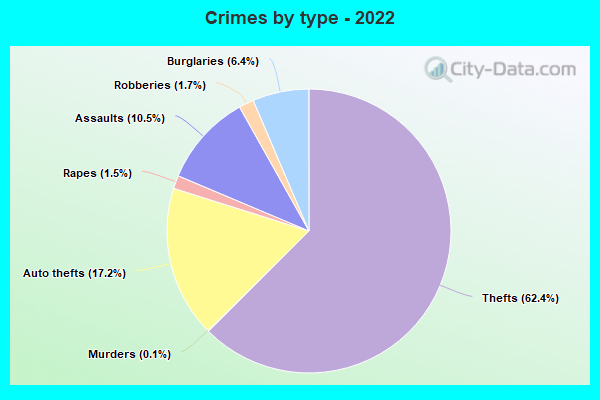
The 2022 crime rate in Omaha, NE is 341 (City-Data.com crime index), which is 1.4 times greater than the U.S. average. It was higher than in 91.0% U.S. cities. The 2022 Omaha crime rate fell by 4% compared to 2020. The number of homicides stood at 29 - a decrease of 8 compared to 2020. In the last 5 years Omaha has seen decreasing violent crime and decreasing property crime.See how dangerous Omaha, NE is compared to the nearest cities:
(Note: Higher means more crime)
(Note: Higher means more crime)
| Omaha: | 341.3 |
| Ralston: | 124.7 |
| La Vista: | 121.1 |
| Carter Lake: | 441.6 |
| Boys Town: | 556.9 |
| Papillion: | 99.7 |
| Council Bluffs: | 294.6 |
| Bellevue: | 173.5 |
| Bennington: | 25.8 |
The City-Data.com crime index weighs serious crimes and violent crimes more heavily. Higher means more crime, U.S. average is 246.1. It adjusts for the number of visitors and daily workers commuting into cities.
- means the value is smaller than the state average.- means the value is about the same as the state average.
- means the value is bigger than the state average.
- means the value is much bigger than the state average.
According to our research of Nebraska and other state lists, there were 1,383 registered sex offenders living in Omaha, Nebraska as of May 09, 2024.
The ratio of all residents to sex offenders in Omaha is 323 to 1.
The ratio of registered sex offenders to all residents in this city is near the state average.
Violent crime rate in 2022
| Omaha: | 320.4 |
| U.S. Average: | 219.8 |
Violent crime rate in 2020
| Omaha: | 363.7 |
| U.S. Average: | 228.2 |
Violent crime rate in 2019
| Omaha: | 354.0 |
| U.S. Average: | 219.9 |
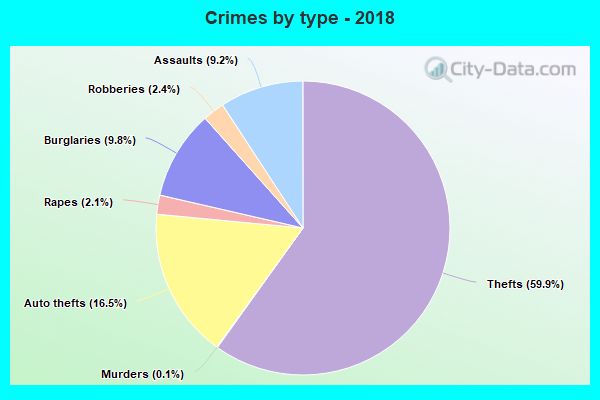
Violent crime rate in 2018
| Omaha: | 329.9 |
| U.S. Average: | 221.2 |
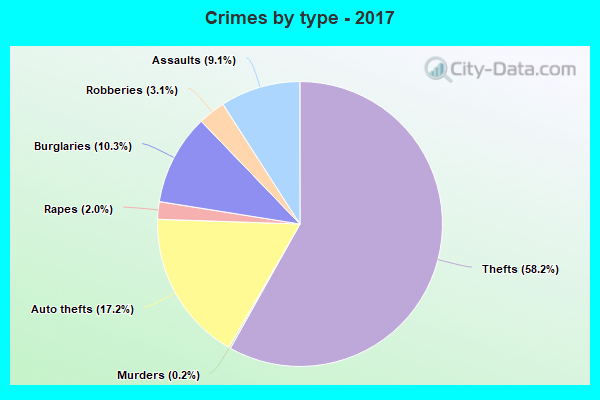
Violent crime rate in 2017
| Omaha: | 379.6 |
| U.S. Average: | 226.2 |
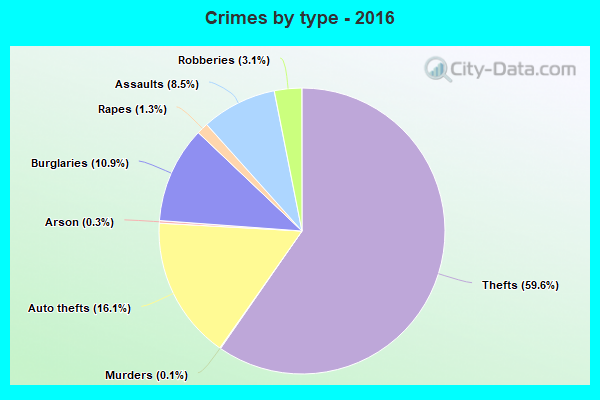
Violent crime rate in 2016
| Omaha: | 320.8 |
| U.S. Average: | 227.3 |
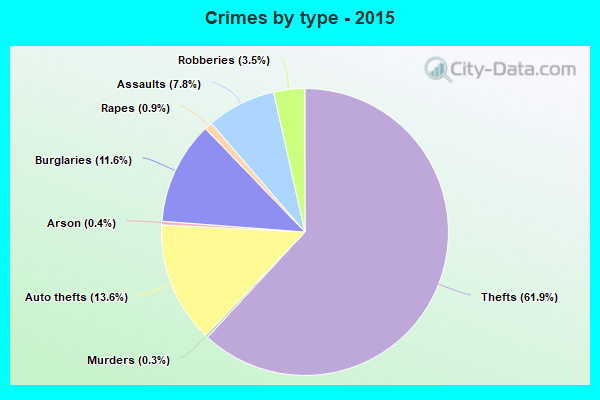
Violent crime rate in 2015
| Omaha: | 292.6 |
| U.S. Average: | 219.3 |
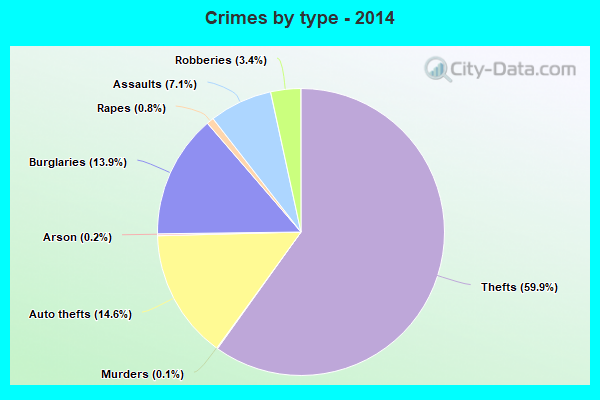
Violent crime rate in 2014
| Omaha: | 311.8 |
| U.S. Average: | 211.1 |
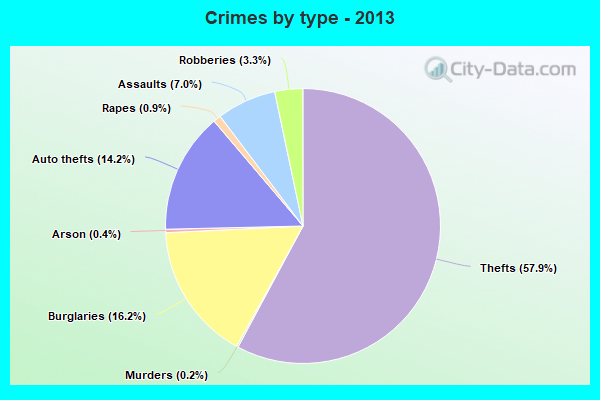
Violent crime rate in 2013
| Omaha: | 324.5 |
| U.S. Average: | 214.2 |
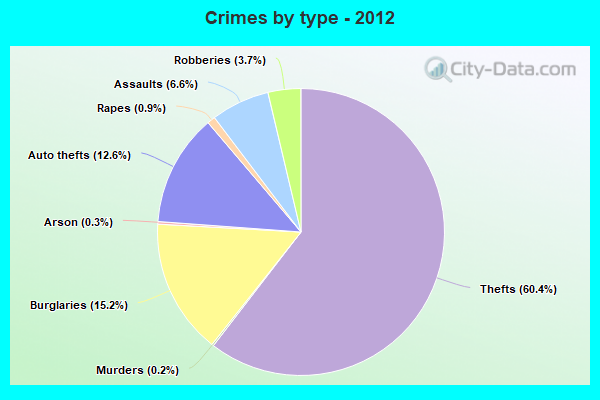
Violent crime rate in 2012
| Omaha: | 334.4 |
| U.S. Average: | 187.4 |
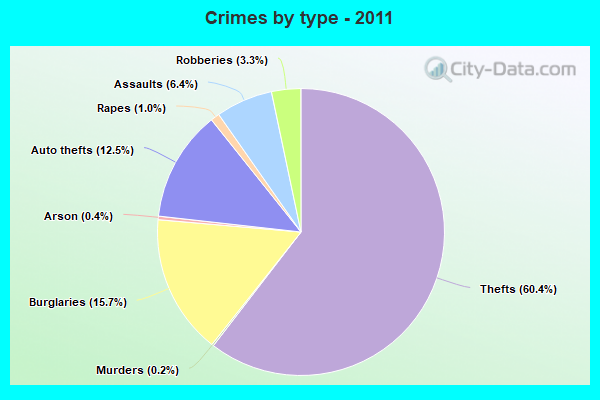
Violent crime rate in 2011
| Omaha: | 322.1 |
| U.S. Average: | 187.1 |
Violent crime rate in 2010
| Omaha: | 315.6 |
| U.S. Average: | 195.7 |
Violent crime rate in 2009
| Omaha: | 298.5 |
| U.S. Average: | 208.9 |
Violent crime rate in 2008
| Omaha: | 338.5 |
| U.S. Average: | 222.5 |
Violent crime rate in 2007
| Omaha: | 284.7 |
| U.S. Average: | 229.1 |
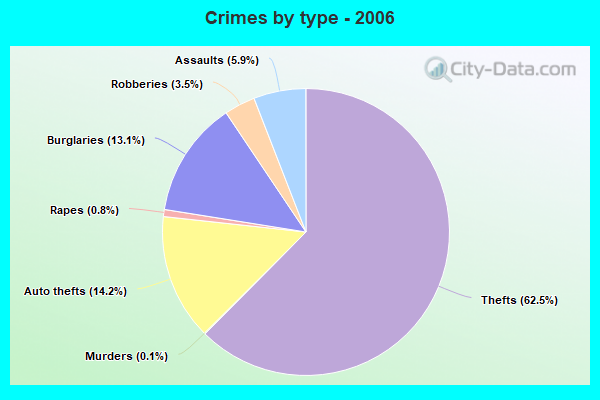
Violent crime rate in 2006
| Omaha: | 284.6 |
| U.S. Average: | 232.6 |
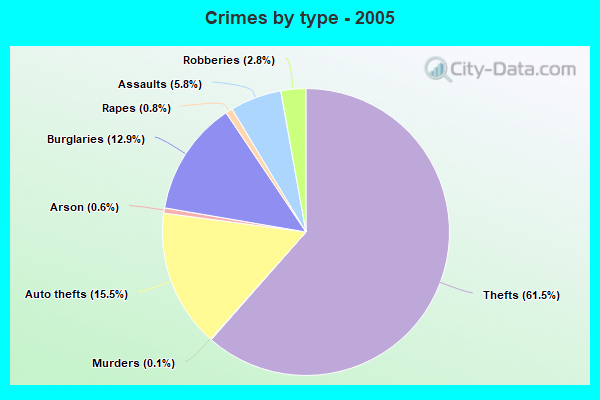
Violent crime rate in 2005
| Omaha: | 270.1 |
| U.S. Average: | 227.0 |
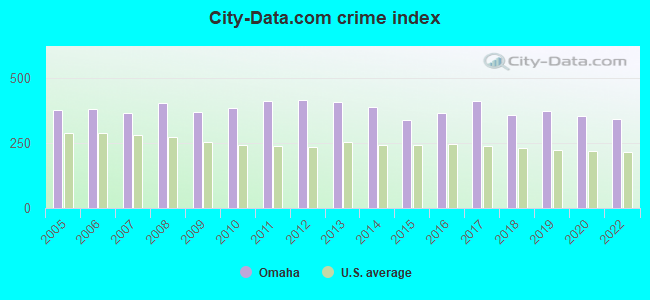
Property crime rate in 2022
| Omaha: | 281.8 |
| U.S. Average: | 166.5 |
Property crime rate in 2020
| Omaha: | 269.3 |
| U.S. Average: | 169.6 |
Property crime rate in 2019
| Omaha: | 302.9 |
| U.S. Average: | 179.7 |
Property crime rate in 2018
| Omaha: | 299.4 |
| U.S. Average: | 190.2 |
Property crime rate in 2017
| Omaha: | 341.6 |
| U.S. Average: | 206.4 |
Property crime rate in 2016
| Omaha: | 329.4 |
| U.S. Average: | 216.6 |
Property crime rate in 2015
| Omaha: | 307.6 |
| U.S. Average: | 221.5 |
Property crime rate in 2014
| Omaha: | 391.5 |
| U.S. Average: | 230.8 |
Property crime rate in 2013
| Omaha: | 421.0 |
| U.S. Average: | 250.4 |
Property crime rate in 2012
| Omaha: | 414.0 |
| U.S. Average: | 267.3 |
Property crime rate in 2011
| Omaha: | 412.3 |
| U.S. Average: | 273.5 |
Property crime rate in 2010
| Omaha: | 377.4 |
| U.S. Average: | 276.4 |
Property crime rate in 2009
| Omaha: | 363.7 |
| U.S. Average: | 285.6 |
Property crime rate in 2008
| Omaha: | 386.1 |
| U.S. Average: | 302.2 |
Property crime rate in 2007
| Omaha: | 369.7 |
| U.S. Average: | 309.2 |
Property crime rate in 2006
| Omaha: | 389.4 |
| U.S. Average: | 317.3 |
Property crime rate in 2005
| Omaha: | 404.0 |
| U.S. Average: | 322.3 |
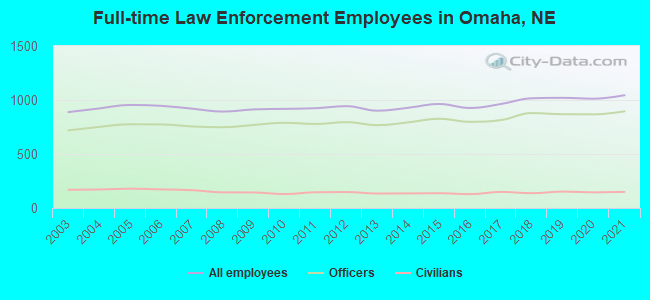
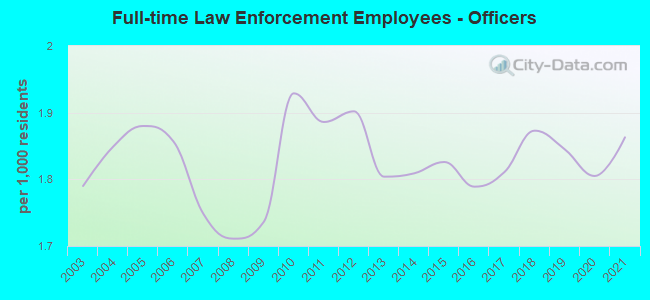
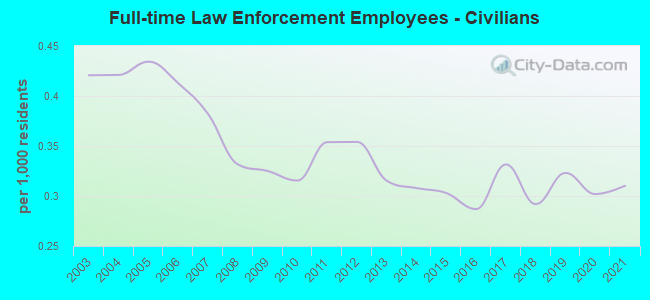
Full-time law enforcement employees in 2021, including police officers: 1,044 (895 officers - 757 male; 138 female).
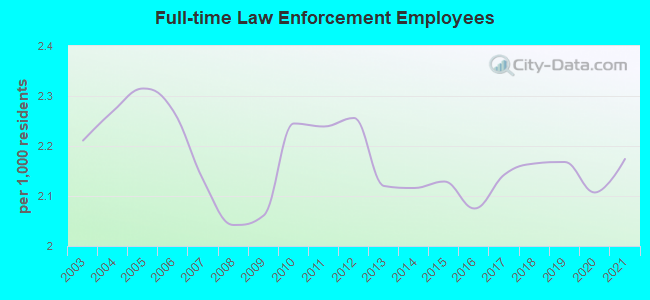
| Officers per 1,000 residents here: | 1.86 |
| US average: | 2.38 |
Full-time law enforcement employees in 2020, including police officers: 1,012 (867 officers - 724 male; 143 female).
| Officers per 1,000 residents here: | 1.81 |
| US average: | 2.41 |
Full-time law enforcement employees in 2019, including police officers: 1,020 (868 officers - 723 male; 145 female).
| Officers per 1,000 residents here: | 1.84 |
| US average: | 2.43 |
Full-time law enforcement employees in 2018, including police officers: 1,016 (879 officers - 729 male; 150 female).
| Officers per 1,000 residents here: | 1.87 |
| US average: | 2.40 |
Full-time law enforcement employees in 2017, including police officers: 963 (814 officers - 674 male; 140 female).
| Officers per 1,000 residents here: | 1.81 |
| US average: | 2.39 |
Full-time law enforcement employees in 2016, including police officers: 926 (798 officers - 659 male; 139 female).
| Officers per 1,000 residents here: | 1.79 |
| US average: | 2.38 |
Full-time law enforcement employees in 2015, including police officers: 963 (826 officers - 675 male; 151 female).
| Officers per 1,000 residents here: | 1.83 |
| US average: | 2.26 |
Full-time law enforcement employees in 2014, including police officers: 928 (793 officers - 646 male; 147 female).
| Officers per 1,000 residents here: | 1.81 |
| US average: | 2.30 |
Full-time law enforcement employees in 2013, including police officers: 901 (767 officers - 624 male; 143 female).
| Officers per 1,000 residents here: | 1.80 |
| US average: | 2.33 |
Full-time law enforcement employees in 2012, including police officers: 943 (795 officers - 646 male; 149 female).
| Officers per 1,000 residents here: | 1.90 |
| US average: | 2.36 |
Full-time law enforcement employees in 2011, including police officers: 924 (778 officers - 632 male; 146 female).
| Officers per 1,000 residents here: | 1.89 |
| US average: | 2.37 |
Full-time law enforcement employees in 2010, including police officers: 918 (789 officers - 641 male; 148 female).
| Officers per 1,000 residents here: | 1.93 |
| US average: | 2.42 |
Full-time law enforcement employees in 2009, including police officers: 913 (769 officers - 624 male; 145 female).
| Officers per 1,000 residents here: | 1.74 |
| US average: | 2.44 |
Full-time law enforcement employees in 2008, including police officers: 893 (748 officers - 601 male; 147 female).
| Officers per 1,000 residents here: | 1.71 |
| US average: | 2.47 |
Full-time law enforcement employees in 2007, including police officers: 920 (755 officers - 607 male; 148 female).
| Officers per 1,000 residents here: | 1.75 |
| US average: | 2.45 |
Full-time law enforcement employees in 2006, including police officers: 946 (774 officers - 624 male; 150 female).
| Officers per 1,000 residents here: | 1.86 |
| US average: | 2.42 |
Full-time law enforcement employees in 2005, including police officers: 954 (775 officers - 622 male; 153 female).
| Officers per 1,000 residents here: | 1.88 |
| US average: | 2.41 |
Full-time law enforcement employees in 2004, including police officers: 922 (751 officers - 598 male; 153 female).
| Officers per 1,000 residents here: | 1.85 |
| US average: | 2.43 |
Full-time law enforcement employees in 2003, including police officers: 888 (719 officers - 579 male; 140 female).
| Officers per 1,000 residents here: | 1.79 |
| US average: | 2.42 |

Zip codes: 68022, 68102, 68104, 68105, 68106, 68107, 68108, 68110, 68111, 68112, 68114, 68116, 68117, 68118, 68122, 68124, 68127, 68130, 68131, 68132, 68134, 68135, 68137, 68142, 68144, 68152, 68154, 68164, 68178.