Crime rate in Modesto, California (CA): murders, rapes, robberies, assaults, burglaries, thefts, auto thefts, arson, law enforcement employees, police officers, crime map
Crime rate in Modesto, CA
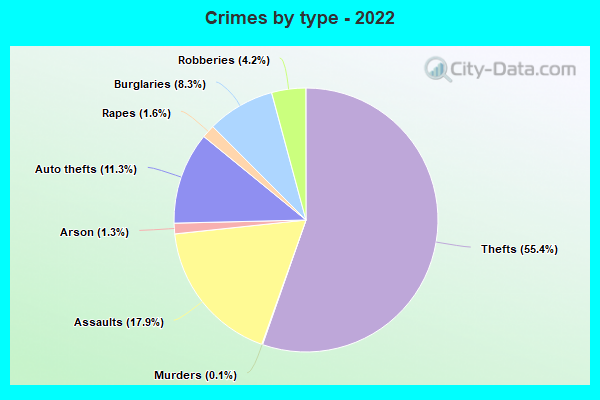
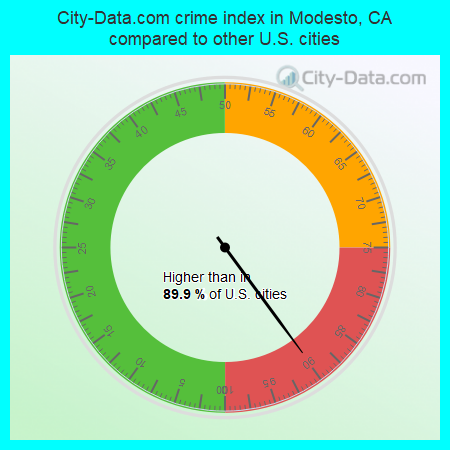
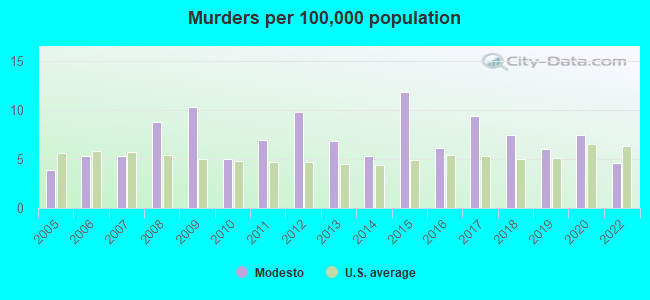
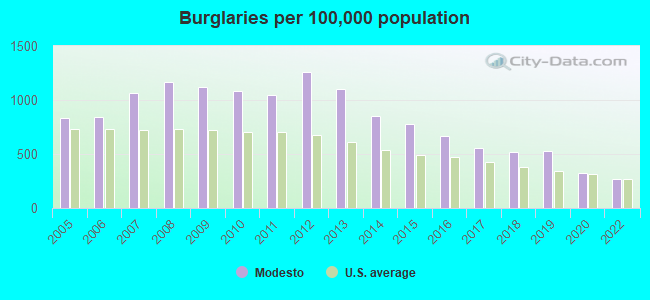
The 2022 crime rate in Modesto, CA is 323 (City-Data.com crime index), which is 1.3 times greater than the U.S. average. It was higher than in 89.9% U.S. cities. The 2022 Modesto crime rate fell by 3% compared to 2020. The number of homicides stood at 10 - a decrease of 6 compared to 2020. In the last 5 years Modesto has seen decreasing violent crime and decreasing property crime.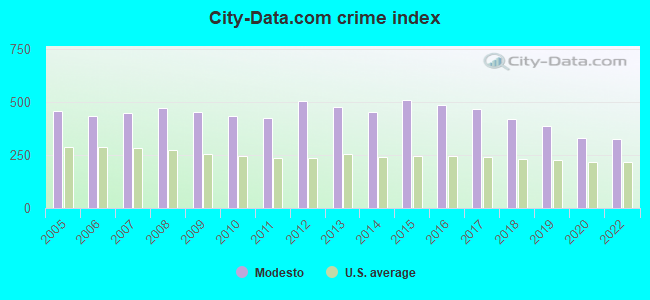
The City-Data.com crime index weighs serious crimes and violent crimes more heavily. Higher means more crime, U.S. average is 246.1. It adjusts for the number of visitors and daily workers commuting into cities.
- means the value is smaller than the state average.- means the value is about the same as the state average.
- means the value is bigger than the state average.
- means the value is much bigger than the state average.
According to our research of California and other state lists, there were 612 registered sex offenders living in Modesto, California as of May 05, 2024.
The ratio of all residents to sex offenders in Modesto is 347 to 1.
Violent crime rate in 2022
| Modesto: | 413.1 |
| U.S. Average: | 219.8 |
Violent crime rate in 2020
| Modesto: | 405.7 |
| U.S. Average: | 228.2 |
Violent crime rate in 2019
| Modesto: | 436.6 |
| U.S. Average: | 219.9 |
Violent crime rate in 2018
| Modesto: | 476.6 |
| U.S. Average: | 221.2 |
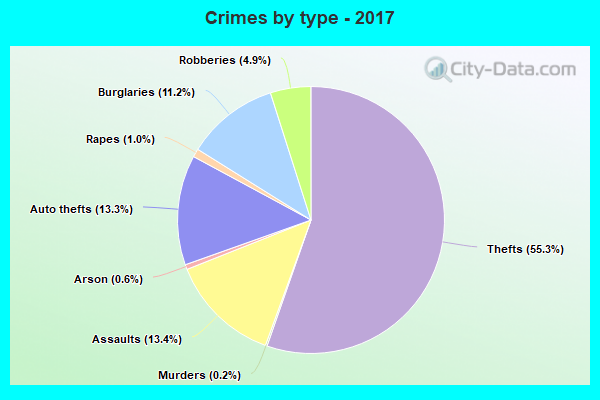
Violent crime rate in 2017
| Modesto: | 525.1 |
| U.S. Average: | 226.2 |
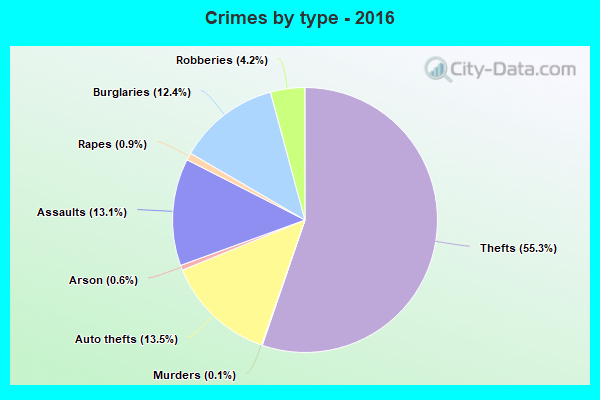
Violent crime rate in 2016
| Modesto: | 527.5 |
| U.S. Average: | 227.3 |
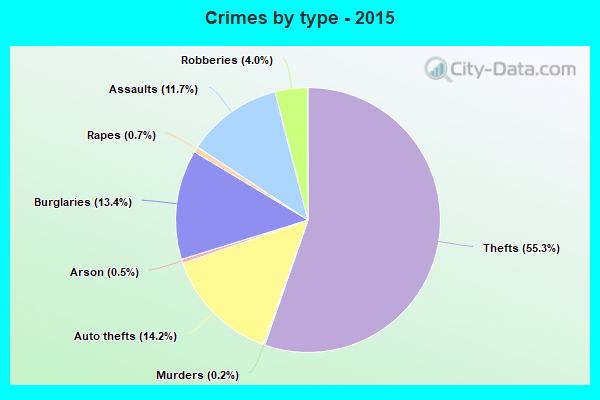
Violent crime rate in 2015
| Modesto: | 518.3 |
| U.S. Average: | 219.3 |
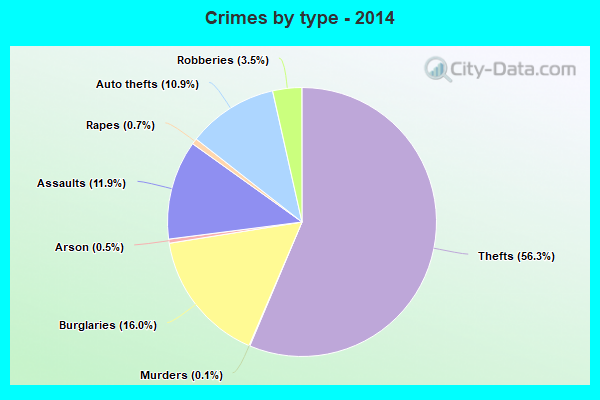
Violent crime rate in 2014
| Modesto: | 459.6 |
| U.S. Average: | 211.1 |
Violent crime rate in 2013
| Modesto: | 445.0 |
| U.S. Average: | 214.2 |
Violent crime rate in 2012
| Modesto: | 417.6 |
| U.S. Average: | 187.4 |
Violent crime rate in 2011
| Modesto: | 373.9 |
| U.S. Average: | 187.1 |
Violent crime rate in 2010
| Modesto: | 370.3 |
| U.S. Average: | 195.7 |
Violent crime rate in 2009
| Modesto: | 375.8 |
| U.S. Average: | 208.9 |
Violent crime rate in 2008
| Modesto: | 378.6 |
| U.S. Average: | 222.5 |
Violent crime rate in 2007
| Modesto: | 344.7 |
| U.S. Average: | 229.1 |
Violent crime rate in 2006
| Modesto: | 329.6 |
| U.S. Average: | 232.6 |
Violent crime rate in 2005
| Modesto: | 304.9 |
| U.S. Average: | 227.0 |
Property crime rate in 2022
| Modesto: | 196.1 |
| U.S. Average: | 166.5 |
Property crime rate in 2020
| Modesto: | 223.0 |
| U.S. Average: | 169.6 |
Property crime rate in 2019
| Modesto: | 300.2 |
| U.S. Average: | 179.7 |
Property crime rate in 2018
| Modesto: | 311.6 |
| U.S. Average: | 190.2 |
Property crime rate in 2017
| Modesto: | 347.6 |
| U.S. Average: | 206.4 |
Property crime rate in 2016
| Modesto: | 392.1 |
| U.S. Average: | 216.6 |
Property crime rate in 2015
| Modesto: | 439.1 |
| U.S. Average: | 221.5 |
Property crime rate in 2014
| Modesto: | 407.3 |
| U.S. Average: | 230.8 |
Property crime rate in 2013
| Modesto: | 477.8 |
| U.S. Average: | 250.4 |
Property crime rate in 2012
| Modesto: | 551.9 |
| U.S. Average: | 267.3 |
Property crime rate in 2011
| Modesto: | 441.8 |
| U.S. Average: | 273.5 |
Property crime rate in 2010
| Modesto: | 466.0 |
| U.S. Average: | 276.4 |
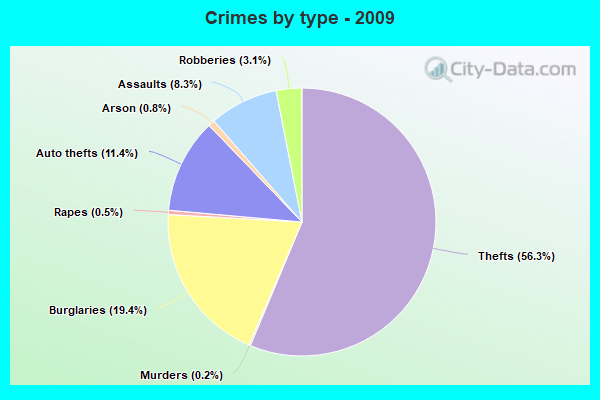
Property crime rate in 2009
| Modesto: | 484.8 |
| U.S. Average: | 285.6 |
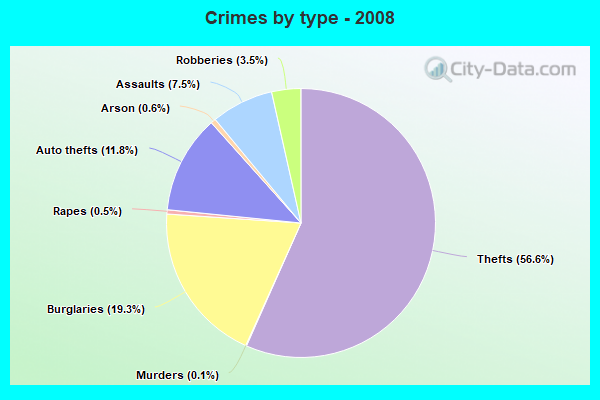
Property crime rate in 2008
| Modesto: | 510.0 |
| U.S. Average: | 302.2 |
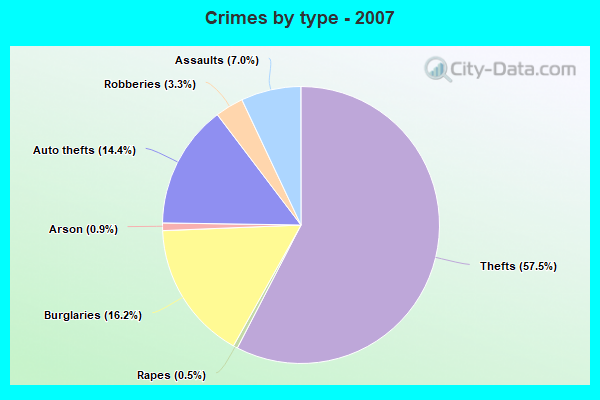
Property crime rate in 2007
| Modesto: | 490.8 |
| U.S. Average: | 309.2 |
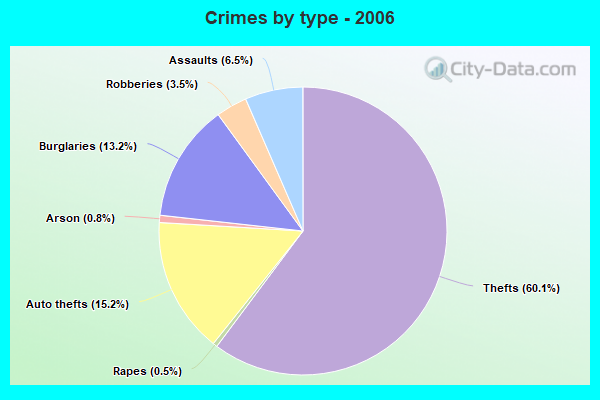
Property crime rate in 2006
| Modesto: | 457.1 |
| U.S. Average: | 317.3 |
Property crime rate in 2005
| Modesto: | 527.3 |
| U.S. Average: | 322.3 |
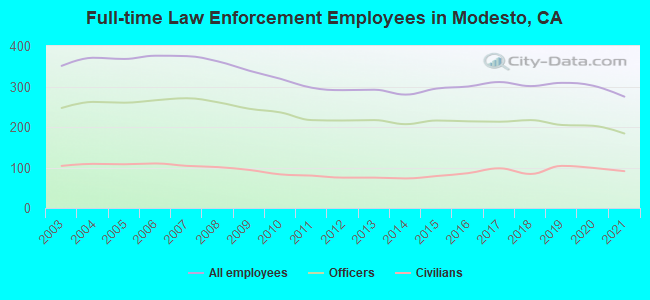
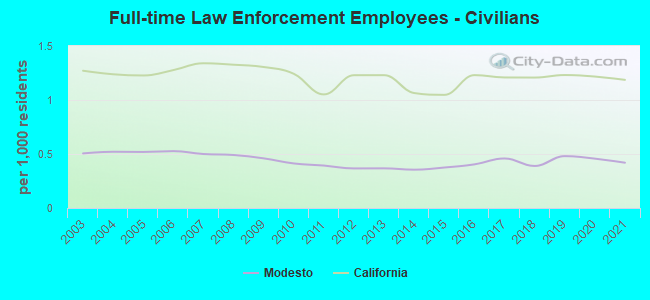
Full-time law enforcement employees in 2021, including police officers: 275 (184 officers - 167 male; 17 female).
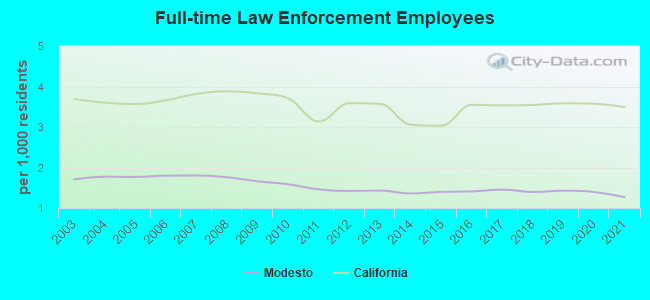
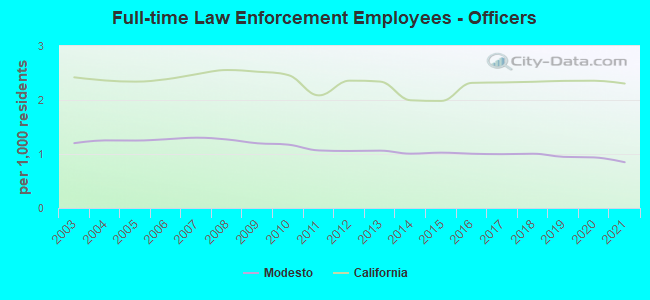
| Officers per 1,000 residents here: | 0.85 |
| California average: | 2.30 |
Full-time law enforcement employees in 2020, including police officers: 302 (203 officers - 184 male; 19 female).
| Officers per 1,000 residents here: | 0.94 |
| California average: | 2.36 |
Full-time law enforcement employees in 2019, including police officers: 309 (205 officers - 184 male; 21 female).
| Officers per 1,000 residents here: | 0.95 |
| California average: | 2.35 |
Full-time law enforcement employees in 2018, including police officers: 301 (217 officers - 201 male; 16 female).
| Officers per 1,000 residents here: | 1.01 |
| California average: | 2.34 |
Full-time law enforcement employees in 2017, including police officers: 311 (213 officers - 194 male; 19 female).
| Officers per 1,000 residents here: | 1.00 |
| California average: | 2.32 |
Full-time law enforcement employees in 2016, including police officers: 300 (214 officers - 199 male; 15 female).
| Officers per 1,000 residents here: | 1.01 |
| California average: | 2.32 |
Full-time law enforcement employees in 2015, including police officers: 295 (216 officers - 203 male; 13 female).
| Officers per 1,000 residents here: | 1.02 |
| California average: | 1.98 |
Full-time law enforcement employees in 2014, including police officers: 280 (207 officers - 194 male; 13 female).
| Officers per 1,000 residents here: | 1.01 |
| California average: | 2.00 |
Full-time law enforcement employees in 2013, including police officers: 292 (217 officers - 204 male; 13 female).
| Officers per 1,000 residents here: | 1.06 |
| California average: | 2.34 |
Full-time law enforcement employees in 2012, including police officers: 291 (216 officers - 207 male; 9 female).
| Officers per 1,000 residents here: | 1.06 |
| California average: | 2.36 |
Full-time law enforcement employees in 2011, including police officers: 297 (217 officers - 202 male; 15 female).
| Officers per 1,000 residents here: | 1.07 |
| California average: | 2.09 |
Full-time law enforcement employees in 2010, including police officers: 319 (236 officers - 221 male; 15 female).
| Officers per 1,000 residents here: | 1.17 |
| California average: | 2.46 |
Full-time law enforcement employees in 2009, including police officers: 339 (245 officers - 231 male; 14 female).
| Officers per 1,000 residents here: | 1.20 |
| California average: | 2.52 |
Full-time law enforcement employees in 2008, including police officers: 362 (261 officers - 247 male; 14 female).
| Officers per 1,000 residents here: | 1.27 |
| California average: | 2.55 |
Full-time law enforcement employees in 2007, including police officers: 375 (271 officers - 257 male; 14 female).
| Officers per 1,000 residents here: | 1.30 |
| California average: | 2.48 |
Full-time law enforcement employees in 2006, including police officers: 376 (266 officers - 254 male; 12 female).
| Officers per 1,000 residents here: | 1.27 |
| California average: | 2.38 |
Full-time law enforcement employees in 2005, including police officers: 368 (260 officers - 247 male; 13 female).
| Officers per 1,000 residents here: | 1.25 |
| California average: | 2.34 |
Full-time law enforcement employees in 2004, including police officers: 371 (262 officers - 249 male; 13 female).
| Officers per 1,000 residents here: | 1.25 |
| California average: | 2.36 |
Full-time law enforcement employees in 2003, including police officers: 351 (247 officers - 235 male; 12 female).
| Officers per 1,000 residents here: | 1.20 |
| California average: | 2.42 |