Estimated zip code population in 2022: 14,725
Zip code population in 2010: 13,614
Zip code population in 2000: 12,464
Houses and condos: 4,411
Renter-occupied apartments: 853
% of renters here:
19%State:
44%
March 2022 cost of living index in zip code 95368: 99.0
(near average, U.S. average is 100)
Land area: 3.3
sq. mi.
Water area: 0.3
sq. mi.
Population density: 4,478 people per square mile (average).
OSM Map
General Map
Google Map
MSN Map
OSM Map
General Map
Google Map
MSN Map
OSM Map
General Map
Google Map
MSN Map
OSM Map
General Map
Google Map
MSN Map
Please wait while loading the map...
Real estate property taxes paid for housing units in 2022:
This zip code:
0.9% ($4,135)California:
0.7% ($4,831)
Median real estate property taxes paid for housing units with mortgages in 2022: $4,418 (1.0%)
Median real estate property taxes paid for housing units with no mortgage in 2022: $3,145 (0.8%)
Business Search - 14 Million verified businesses
Males: 7,644 Females: 7,080
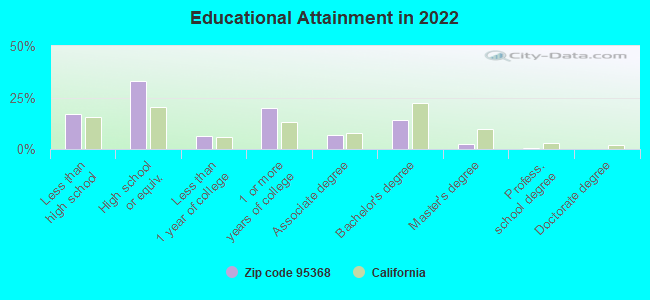
For population 25 years and over in 95368:
High school or higher: 82.2%Bachelor's degree or higher: 16.9%Graduate or professional degree: 3.1%Unemployed: 8.7%Mean travel time to work (commute): 29.2 minutes
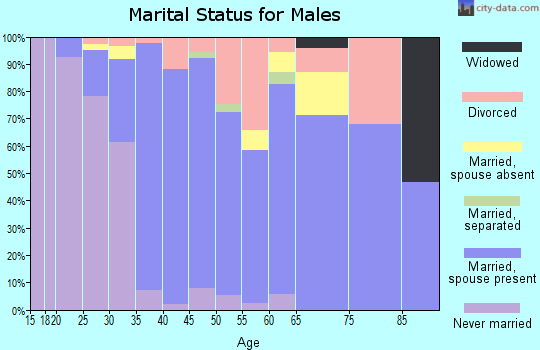
For population 15 years and over in 95368:
Never married: 38.0%Now married: 50.7%Separated: 1.3%Widowed: 3.2%Divorced: 6.9%
Zip code 95368 compared to state average:
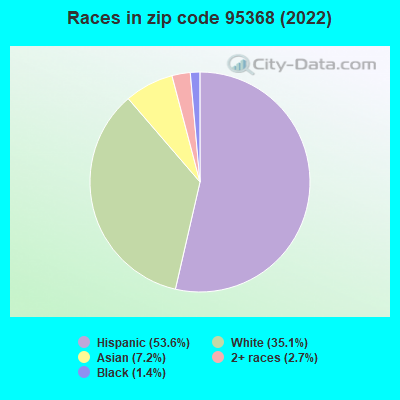
Median house value below state average. Black race population percentage significantly below state average. Median age below state average. Renting percentage significantly below state average. Length of stay since moving in significantly above state average. Number of rooms per house above state average. House age below state average. Percentage of population with a bachelor's degree or higher significantly below state average. 7,889 53.6% Hispanic or Latino 5,164 35.1% White 1,057 7.2% Asian 398 2.7% Two or more races 205 1.4% Black 9 0.06% Native Hawaiian and Other
Data:
Median household income ($)
Median household income (% change since 2000)
Household income diversity
Ratio of average income to average house value (%)
Ratio of average income to average rent
Median household income ($) - White
Median household income ($) - Black or African American
Median household income ($) - Asian
Median household income ($) - Hispanic or Latino
Median household income ($) - American Indian and Alaska Native
Median household income ($) - Multirace
Median household income ($) - Other Race
Median household income for houses/condos with a mortgage ($)
Median household income for apartments without a mortgage ($)
Races - White alone (%)
Races - White alone (% change since 2000)
Races - Black alone (%)
Races - Black alone (% change since 2000)
Races - American Indian alone (%)
Races - American Indian alone (% change since 2000)
Races - Asian alone (%)
Races - Asian alone (% change since 2000)
Races - Hispanic (%)
Races - Hispanic (% change since 2000)
Races - Native Hawaiian and Other Pacific Islander alone (%)
Races - Native Hawaiian and Other Pacific Islander alone (% change since 2000)
Races - Two or more races (%)
Races - Two or more races (% change since 2000)
Races - Other race alone (%)
Races - Other race alone (% change since 2000)
Racial diversity
Unemployment (%)
Unemployment (% change since 2000)
Unemployment (%) - White
Unemployment (%) - Black or African American
Unemployment (%) - Asian
Unemployment (%) - Hispanic or Latino
Unemployment (%) - American Indian and Alaska Native
Unemployment (%) - Multirace
Unemployment (%) - Other Race
Population density (people per square mile)
Population - Males (%)
Population - Females (%)
Population - Males (%) - White
Population - Males (%) - Black or African American
Population - Males (%) - Asian
Population - Males (%) - Hispanic or Latino
Population - Males (%) - American Indian and Alaska Native
Population - Males (%) - Multirace
Population - Males (%) - Other Race
Population - Females (%) - White
Population - Females (%) - Black or African American
Population - Females (%) - Asian
Population - Females (%) - Hispanic or Latino
Population - Females (%) - American Indian and Alaska Native
Population - Females (%) - Multirace
Population - Females (%) - Other Race
Coronavirus confirmed cases (May 05, 2024)
Deaths caused by coronavirus (May 05, 2024)
Coronavirus confirmed cases (per 100k population) (May 05, 2024)
Deaths caused by coronavirus (per 100k population) (May 05, 2024)
Daily increase in number of cases (May 05, 2024)
Weekly increase in number of cases (May 05, 2024)
Cases doubled (in days) (May 05, 2024)
Hospitalized patients (Apr 18, 2022)
Negative test results (Apr 18, 2022)
Total test results (Apr 18, 2022)
COVID Vaccine doses distributed (per 100k population) (Sep 19, 2023)
COVID Vaccine doses administered (per 100k population) (Sep 19, 2023)
COVID Vaccine doses distributed (Sep 19, 2023)
COVID Vaccine doses administered (Sep 19, 2023)
Likely homosexual households (%)
Likely homosexual households (% change since 2000)
Likely homosexual households - Lesbian couples (%)
Likely homosexual households - Lesbian couples (% change since 2000)
Likely homosexual households - Gay men (%)
Likely homosexual households - Gay men (% change since 2000)
Cost of living index
Median gross rent ($)
Median contract rent ($)
Median monthly housing costs ($)
Median house or condo value ($)
Median house or condo value ($ change since 2000)
Mean house or condo value by units in structure - 1, detached ($)
Mean house or condo value by units in structure - 1, attached ($)
Mean house or condo value by units in structure - 2 ($)
Mean house or condo value by units in structure by units in structure - 3 or 4 ($)
Mean house or condo value by units in structure - 5 or more ($)
Mean house or condo value by units in structure - Boat, RV, van, etc. ($)
Mean house or condo value by units in structure - Mobile home ($)
Median house or condo value ($) - White
Median house or condo value ($) - Black or African American
Median house or condo value ($) - Asian
Median house or condo value ($) - Hispanic or Latino
Median house or condo value ($) - American Indian and Alaska Native
Median house or condo value ($) - Multirace
Median house or condo value ($) - Other Race
Median resident age
Resident age diversity
Median resident age - Males
Median resident age - Females
Median resident age - White
Median resident age - Black or African American
Median resident age - Asian
Median resident age - Hispanic or Latino
Median resident age - American Indian and Alaska Native
Median resident age - Multirace
Median resident age - Other Race
Median resident age - Males - White
Median resident age - Males - Black or African American
Median resident age - Males - Asian
Median resident age - Males - Hispanic or Latino
Median resident age - Males - American Indian and Alaska Native
Median resident age - Males - Multirace
Median resident age - Males - Other Race
Median resident age - Females - White
Median resident age - Females - Black or African American
Median resident age - Females - Asian
Median resident age - Females - Hispanic or Latino
Median resident age - Females - American Indian and Alaska Native
Median resident age - Females - Multirace
Median resident age - Females - Other Race
Commute - mean travel time to work (minutes)
Travel time to work - Less than 5 minutes (%)
Travel time to work - Less than 5 minutes (% change since 2000)
Travel time to work - 5 to 9 minutes (%)
Travel time to work - 5 to 9 minutes (% change since 2000)
Travel time to work - 10 to 19 minutes (%)
Travel time to work - 10 to 19 minutes (% change since 2000)
Travel time to work - 20 to 29 minutes (%)
Travel time to work - 20 to 29 minutes (% change since 2000)
Travel time to work - 30 to 39 minutes (%)
Travel time to work - 30 to 39 minutes (% change since 2000)
Travel time to work - 40 to 59 minutes (%)
Travel time to work - 40 to 59 minutes (% change since 2000)
Travel time to work - 60 to 89 minutes (%)
Travel time to work - 60 to 89 minutes (% change since 2000)
Travel time to work - 90 or more minutes (%)
Travel time to work - 90 or more minutes (% change since 2000)
Marital status - Never married (%)
Marital status - Now married (%)
Marital status - Separated (%)
Marital status - Widowed (%)
Marital status - Divorced (%)
Median family income ($)
Median family income (% change since 2000)
Median non-family income ($)
Median non-family income (% change since 2000)
Median per capita income ($)
Median per capita income (% change since 2000)
Median family income ($) - White
Median family income ($) - Black or African American
Median family income ($) - Asian
Median family income ($) - Hispanic or Latino
Median family income ($) - American Indian and Alaska Native
Median family income ($) - Multirace
Median family income ($) - Other Race
Median year house/condo built
Median year apartment built
Year house built - Built 2005 or later (%)
Year house built - Built 2000 to 2004 (%)
Year house built - Built 1990 to 1999 (%)
Year house built - Built 1980 to 1989 (%)
Year house built - Built 1970 to 1979 (%)
Year house built - Built 1960 to 1969 (%)
Year house built - Built 1950 to 1959 (%)
Year house built - Built 1940 to 1949 (%)
Year house built - Built 1939 or earlier (%)
Average household size
Household density (households per square mile)
Average household size - White
Average household size - Black or African American
Average household size - Asian
Average household size - Hispanic or Latino
Average household size - American Indian and Alaska Native
Average household size - Multirace
Average household size - Other Race
Occupied housing units (%)
Vacant housing units (%)
Owner occupied housing units (%)
Renter occupied housing units (%)
Vacancy status - For rent (%)
Vacancy status - For sale only (%)
Vacancy status - Rented or sold, not occupied (%)
Vacancy status - For seasonal, recreational, or occasional use (%)
Vacancy status - For migrant workers (%)
Vacancy status - Other vacant (%)
Residents with income below the poverty level (%)
Residents with income below 50% of the poverty level (%)
Children below poverty level (%)
Poor families by family type - Married-couple family (%)
Poor families by family type - Male, no wife present (%)
Poor families by family type - Female, no husband present (%)
Poverty status for native-born residents (%)
Poverty status for foreign-born residents (%)
Poverty among high school graduates not in families (%)
Poverty among people who did not graduate high school not in families (%)
Residents with income below the poverty level (%) - White
Residents with income below the poverty level (%) - Black or African American
Residents with income below the poverty level (%) - Asian
Residents with income below the poverty level (%) - Hispanic or Latino
Residents with income below the poverty level (%) - American Indian and Alaska Native
Residents with income below the poverty level (%) - Multirace
Residents with income below the poverty level (%) - Other Race
Air pollution - Air Quality Index (AQI)
Air pollution - CO
Air pollution - NO2
Air pollution - SO2
Air pollution - Ozone
Air pollution - PM10
Air pollution - PM25
Air pollution - Pb
Crime - Murders per 100,000 population
Crime - Rapes per 100,000 population
Crime - Robberies per 100,000 population
Crime - Assaults per 100,000 population
Crime - Burglaries per 100,000 population
Crime - Thefts per 100,000 population
Crime - Auto thefts per 100,000 population
Crime - Arson per 100,000 population
Crime - City-data.com crime index
Crime - Violent crime index
Crime - Property crime index
Crime - Murders per 100,000 population (5 year average)
Crime - Rapes per 100,000 population (5 year average)
Crime - Robberies per 100,000 population (5 year average)
Crime - Assaults per 100,000 population (5 year average)
Crime - Burglaries per 100,000 population (5 year average)
Crime - Thefts per 100,000 population (5 year average)
Crime - Auto thefts per 100,000 population (5 year average)
Crime - Arson per 100,000 population (5 year average)
Crime - City-data.com crime index (5 year average)
Crime - Violent crime index (5 year average)
Crime - Property crime index (5 year average)
1996 Presidential Elections Results (%) - Democratic Party (Clinton)
1996 Presidential Elections Results (%) - Republican Party (Dole)
1996 Presidential Elections Results (%) - Other
2000 Presidential Elections Results (%) - Democratic Party (Gore)
2000 Presidential Elections Results (%) - Republican Party (Bush)
2000 Presidential Elections Results (%) - Other
2004 Presidential Elections Results (%) - Democratic Party (Kerry)
2004 Presidential Elections Results (%) - Republican Party (Bush)
2004 Presidential Elections Results (%) - Other
2008 Presidential Elections Results (%) - Democratic Party (Obama)
2008 Presidential Elections Results (%) - Republican Party (McCain)
2008 Presidential Elections Results (%) - Other
2012 Presidential Elections Results (%) - Democratic Party (Obama)
2012 Presidential Elections Results (%) - Republican Party (Romney)
2012 Presidential Elections Results (%) - Other
2016 Presidential Elections Results (%) - Democratic Party (Clinton)
2016 Presidential Elections Results (%) - Republican Party (Trump)
2016 Presidential Elections Results (%) - Other
2020 Presidential Elections Results (%) - Democratic Party (Biden)
2020 Presidential Elections Results (%) - Republican Party (Trump)
2020 Presidential Elections Results (%) - Other
Ancestries Reported - Arab (%)
Ancestries Reported - Czech (%)
Ancestries Reported - Danish (%)
Ancestries Reported - Dutch (%)
Ancestries Reported - English (%)
Ancestries Reported - French (%)
Ancestries Reported - French Canadian (%)
Ancestries Reported - German (%)
Ancestries Reported - Greek (%)
Ancestries Reported - Hungarian (%)
Ancestries Reported - Irish (%)
Ancestries Reported - Italian (%)
Ancestries Reported - Lithuanian (%)
Ancestries Reported - Norwegian (%)
Ancestries Reported - Polish (%)
Ancestries Reported - Portuguese (%)
Ancestries Reported - Russian (%)
Ancestries Reported - Scotch-Irish (%)
Ancestries Reported - Scottish (%)
Ancestries Reported - Slovak (%)
Ancestries Reported - Subsaharan African (%)
Ancestries Reported - Swedish (%)
Ancestries Reported - Swiss (%)
Ancestries Reported - Ukrainian (%)
Ancestries Reported - United States (%)
Ancestries Reported - Welsh (%)
Ancestries Reported - West Indian (%)
Ancestries Reported - Other (%)
Educational Attainment - No schooling completed (%)
Educational Attainment - Less than high school (%)
Educational Attainment - High school or equivalent (%)
Educational Attainment - Less than 1 year of college (%)
Educational Attainment - 1 or more years of college (%)
Educational Attainment - Associate degree (%)
Educational Attainment - Bachelor's degree (%)
Educational Attainment - Master's degree (%)
Educational Attainment - Professional school degree (%)
Educational Attainment - Doctorate degree (%)
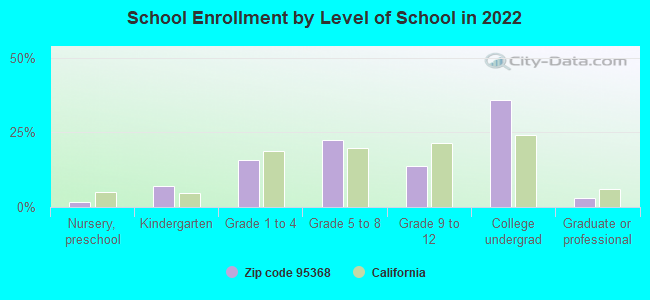
School Enrollment - Nursery, preschool (%)
School Enrollment - Kindergarten (%)
School Enrollment - Grade 1 to 4 (%)
School Enrollment - Grade 5 to 8 (%)
School Enrollment - Grade 9 to 12 (%)
School Enrollment - College undergrad (%)
School Enrollment - Graduate or professional (%)
School Enrollment - Not enrolled in school (%)
School enrollment - Public schools (%)
School enrollment - Private schools (%)
School enrollment - Not enrolled (%)
Median number of rooms in houses and condos
Median number of rooms in apartments
Housing units lacking complete plumbing facilities (%)
Housing units lacking complete kitchen facilities (%)
Density of houses
Urban houses (%)
Rural houses (%)
Households with people 60 years and over (%)
Households with people 65 years and over (%)
Households with people 75 years and over (%)
Households with one or more nonrelatives (%)
Households with no nonrelatives (%)
Population in households (%)
Family households (%)
Nonfamily households (%)
Population in families (%)
Family households with own children (%)
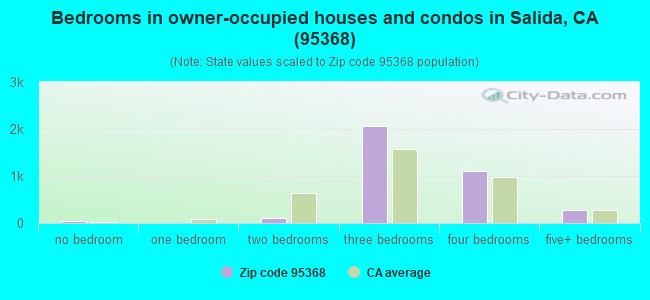
Median number of bedrooms in owner occupied houses
Mean number of bedrooms in owner occupied houses
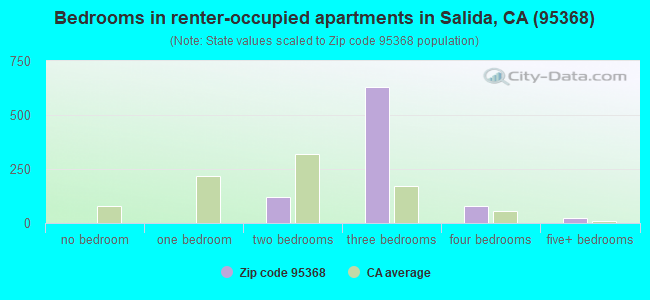
Median number of bedrooms in renter occupied houses
Mean number of bedrooms in renter occupied houses
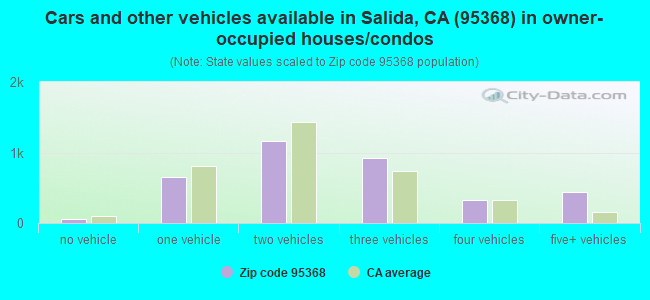
Median number of vehichles in owner occupied houses
Mean number of vehichles in owner occupied houses
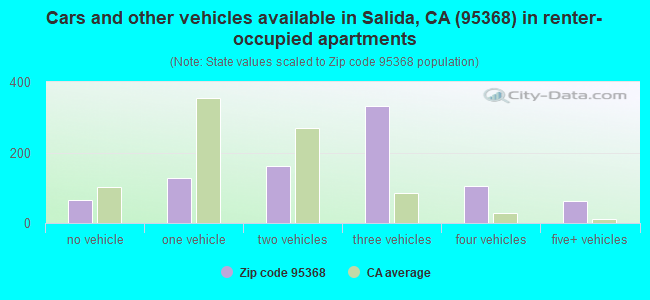
Median number of vehichles in renter occupied houses
Mean number of vehichles in renter occupied houses
Mortgage status - with mortgage (%)
Mortgage status - with second mortgage (%)
Mortgage status - with home equity loan (%)
Mortgage status - with both second mortgage and home equity loan (%)
Mortgage status - without a mortgage (%)
Average family size
Average family size - White
Average family size - Black or African American
Average family size - Asian
Average family size - Hispanic or Latino
Average family size - American Indian and Alaska Native
Average family size - Multirace
Average family size - Other Race
Geographical mobility - Same house 1 year ago (%)
Geographical mobility - Moved within same county (%)
Geographical mobility - Moved from different county within same state (%)
Geographical mobility - Moved from different state (%)
Geographical mobility - Moved from abroad (%)
Place of birth - Born in state of residence (%)
Place of birth - Born in other state (%)
Place of birth - Native, outside of US (%)
Place of birth - Foreign born (%)
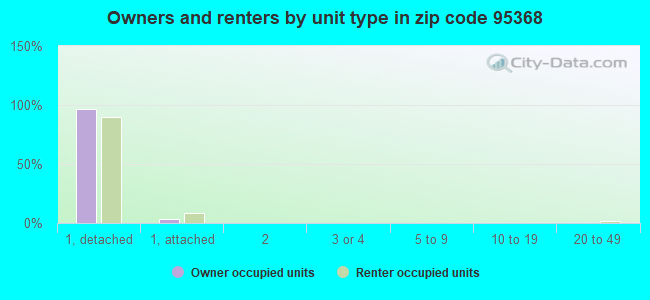
Housing units in structures - 1, detached (%)
Housing units in structures - 1, attached (%)
Housing units in structures - 2 (%)
Housing units in structures - 3 or 4 (%)
Housing units in structures - 5 to 9 (%)
Housing units in structures - 10 to 19 (%)
Housing units in structures - 20 to 49 (%)
Housing units in structures - 50 or more (%)
Housing units in structures - Mobile home (%)
Housing units in structures - Boat, RV, van, etc. (%)
House/condo owner moved in on average (years ago)
Renter moved in on average (years ago)
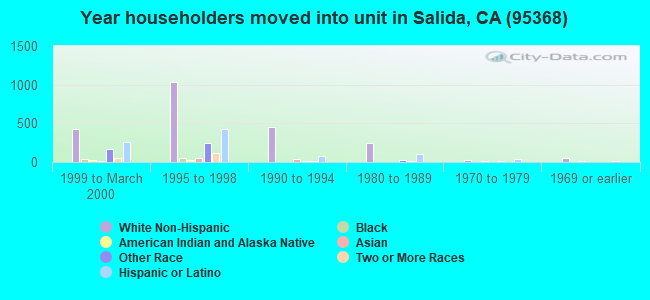
Year householder moved into unit - Moved in 1999 to March 2000 (%)
Year householder moved into unit - Moved in 1995 to 1998 (%)
Year householder moved into unit - Moved in 1990 to 1994 (%)
Year householder moved into unit - Moved in 1980 to 1989 (%)
Year householder moved into unit - Moved in 1970 to 1979 (%)
Year householder moved into unit - Moved in 1969 or earlier (%)
Means of transportation to work - Drove car alone (%)
Means of transportation to work - Carpooled (%)
Means of transportation to work - Public transportation (%)
Means of transportation to work - Bus or trolley bus (%)
Means of transportation to work - Streetcar or trolley car (%)
Means of transportation to work - Subway or elevated (%)
Means of transportation to work - Railroad (%)
Means of transportation to work - Ferryboat (%)
Means of transportation to work - Taxicab (%)
Means of transportation to work - Motorcycle (%)
Means of transportation to work - Bicycle (%)
Means of transportation to work - Walked (%)
Means of transportation to work - Other means (%)
Working at home (%)
Industry diversity
Most Common Industries - Agriculture, forestry, fishing and hunting, and mining (%)
Most Common Industries - Agriculture, forestry, fishing and hunting (%)
Most Common Industries - Mining, quarrying, and oil and gas extraction (%)
Most Common Industries - Construction (%)
Most Common Industries - Manufacturing (%)
Most Common Industries - Wholesale trade (%)
Most Common Industries - Retail trade (%)
Most Common Industries - Transportation and warehousing, and utilities (%)
Most Common Industries - Transportation and warehousing (%)
Most Common Industries - Utilities (%)
Most Common Industries - Information (%)
Most Common Industries - Finance and insurance, and real estate and rental and leasing (%)
Most Common Industries - Finance and insurance (%)
Most Common Industries - Real estate and rental and leasing (%)
Most Common Industries - Professional, scientific, and management, and administrative and waste management services (%)
Most Common Industries - Professional, scientific, and technical services (%)
Most Common Industries - Management of companies and enterprises (%)
Most Common Industries - Administrative and support and waste management services (%)
Most Common Industries - Educational services, and health care and social assistance (%)
Most Common Industries - Educational services (%)
Most Common Industries - Health care and social assistance (%)
Most Common Industries - Arts, entertainment, and recreation, and accommodation and food services (%)
Most Common Industries - Arts, entertainment, and recreation (%)
Most Common Industries - Accommodation and food services (%)
Most Common Industries - Other services, except public administration (%)
Most Common Industries - Public administration (%)
Occupation diversity
Most Common Occupations - Management, business, science, and arts occupations (%)
Most Common Occupations - Management, business, and financial occupations (%)
Most Common Occupations - Management occupations (%)
Most Common Occupations - Business and financial operations occupations (%)
Most Common Occupations - Computer, engineering, and science occupations (%)
Most Common Occupations - Computer and mathematical occupations (%)
Most Common Occupations - Architecture and engineering occupations (%)
Most Common Occupations - Life, physical, and social science occupations (%)
Most Common Occupations - Education, legal, community service, arts, and media occupations (%)
Most Common Occupations - Community and social service occupations (%)
Most Common Occupations - Legal occupations (%)
Most Common Occupations - Education, training, and library occupations (%)
Most Common Occupations - Arts, design, entertainment, sports, and media occupations (%)
Most Common Occupations - Healthcare practitioners and technical occupations (%)
Most Common Occupations - Health diagnosing and treating practitioners and other technical occupations (%)
Most Common Occupations - Health technologists and technicians (%)
Most Common Occupations - Service occupations (%)
Most Common Occupations - Healthcare support occupations (%)
Most Common Occupations - Protective service occupations (%)
Most Common Occupations - Fire fighting and prevention, and other protective service workers including supervisors (%)
Most Common Occupations - Law enforcement workers including supervisors (%)
Most Common Occupations - Food preparation and serving related occupations (%)
Most Common Occupations - Building and grounds cleaning and maintenance occupations (%)
Most Common Occupations - Personal care and service occupations (%)
Most Common Occupations - Sales and office occupations (%)
Most Common Occupations - Sales and related occupations (%)
Most Common Occupations - Office and administrative support occupations (%)
Most Common Occupations - Natural resources, construction, and maintenance occupations (%)
Most Common Occupations - Farming, fishing, and forestry occupations (%)
Most Common Occupations - Construction and extraction occupations (%)
Most Common Occupations - Installation, maintenance, and repair occupations (%)
Most Common Occupations - Production, transportation, and material moving occupations (%)
Most Common Occupations - Production occupations (%)
Most Common Occupations - Transportation occupations (%)
Most Common Occupations - Material moving occupations (%)
People in Group quarters - Institutionalized population (%)
People in Group quarters - Correctional institutions (%)
People in Group quarters - Federal prisons and detention centers (%)
People in Group quarters - Halfway houses (%)
People in Group quarters - Local jails and other confinement facilities (including police lockups) (%)
People in Group quarters - Military disciplinary barracks (%)
People in Group quarters - State prisons (%)
People in Group quarters - Other types of correctional institutions (%)
People in Group quarters - Nursing homes (%)
People in Group quarters - Hospitals/wards, hospices, and schools for the handicapped (%)
People in Group quarters - Hospitals/wards and hospices for chronically ill (%)
People in Group quarters - Hospices or homes for chronically ill (%)
People in Group quarters - Military hospitals or wards for chronically ill (%)
People in Group quarters - Other hospitals or wards for chronically ill (%)
People in Group quarters - Hospitals or wards for drug/alcohol abuse (%)
People in Group quarters - Mental (Psychiatric) hospitals or wards (%)
People in Group quarters - Schools, hospitals, or wards for the mentally retarded (%)
People in Group quarters - Schools, hospitals, or wards for the physically handicapped (%)
People in Group quarters - Institutions for the deaf (%)
People in Group quarters - Institutions for the blind (%)
People in Group quarters - Orthopedic wards and institutions for the physically handicapped (%)
People in Group quarters - Wards in general hospitals for patients who have no usual home elsewhere (%)
People in Group quarters - Wards in military hospitals for patients who have no usual home elsewhere (%)
People in Group quarters - Juvenile institutions (%)
People in Group quarters - Long-term care (%)
People in Group quarters - Homes for abused, dependent, and neglected children (%)
People in Group quarters - Residential treatment centers for emotionally disturbed children (%)
People in Group quarters - Training schools for juvenile delinquents (%)
People in Group quarters - Short-term care, detention or diagnostic centers for delinquent children (%)
People in Group quarters - Type of juvenile institution unknown (%)
People in Group quarters - Noninstitutionalized population (%)
People in Group quarters - College dormitories (includes college quarters off campus) (%)
People in Group quarters - Military quarters (%)
People in Group quarters - On base (%)
People in Group quarters - Barracks, unaccompanied personnel housing (UPH), (Enlisted/Officer), ;and similar group living quarters for military personnel (%)
People in Group quarters - Transient quarters for temporary residents (%)
People in Group quarters - Military ships (%)
People in Group quarters - Group homes (%)
People in Group quarters - Homes or halfway houses for drug/alcohol abuse (%)
People in Group quarters - Homes for the mentally ill (%)
People in Group quarters - Homes for the mentally retarded (%)
People in Group quarters - Homes for the physically handicapped (%)
People in Group quarters - Other group homes (%)
People in Group quarters - Religious group quarters (%)
People in Group quarters - Dormitories (%)
People in Group quarters - Agriculture workers' dormitories on farms (%)
People in Group quarters - Job Corps and vocational training facilities (%)
People in Group quarters - Other workers' dormitories (%)
People in Group quarters - Crews of maritime vessels (%)
People in Group quarters - Other nonhousehold living situations (%)
People in Group quarters - Other noninstitutional group quarters (%)
Residents speaking English at home (%)
Residents speaking English at home - Born in the United States (%)
Residents speaking English at home - Native, born elsewhere (%)
Residents speaking English at home - Foreign born (%)
Residents speaking Spanish at home (%)
Residents speaking Spanish at home - Born in the United States (%)
Residents speaking Spanish at home - Native, born elsewhere (%)
Residents speaking Spanish at home - Foreign born (%)
Residents speaking other language at home (%)
Residents speaking other language at home - Born in the United States (%)
Residents speaking other language at home - Native, born elsewhere (%)
Residents speaking other language at home - Foreign born (%)
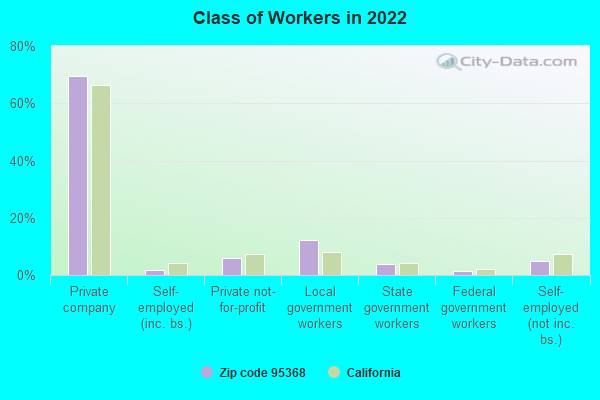
Class of Workers - Employee of private company (%)
Class of Workers - Self-employed in own incorporated business (%)
Class of Workers - Private not-for-profit wage and salary workers (%)
Class of Workers - Local government workers (%)
Class of Workers - State government workers (%)
Class of Workers - Federal government workers (%)
Class of Workers - Self-employed workers in own not incorporated business and Unpaid family workers (%)
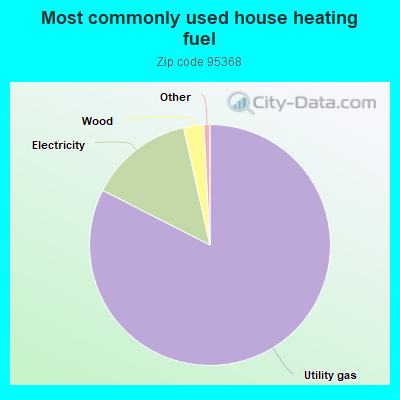
House heating fuel used in houses and condos - Utility gas (%)
House heating fuel used in houses and condos - Bottled, tank, or LP gas (%)
House heating fuel used in houses and condos - Electricity (%)
House heating fuel used in houses and condos - Fuel oil, kerosene, etc. (%)
House heating fuel used in houses and condos - Coal or coke (%)
House heating fuel used in houses and condos - Wood (%)
House heating fuel used in houses and condos - Solar energy (%)
House heating fuel used in houses and condos - Other fuel (%)
House heating fuel used in houses and condos - No fuel used (%)
House heating fuel used in apartments - Utility gas (%)
House heating fuel used in apartments - Bottled, tank, or LP gas (%)
House heating fuel used in apartments - Electricity (%)
House heating fuel used in apartments - Fuel oil, kerosene, etc. (%)
House heating fuel used in apartments - Coal or coke (%)
House heating fuel used in apartments - Wood (%)
House heating fuel used in apartments - Solar energy (%)
House heating fuel used in apartments - Other fuel (%)
House heating fuel used in apartments - No fuel used (%)
Armed forces status - In Armed Forces (%)
Armed forces status - Civilian (%)
Armed forces status - Civilian - Veteran (%)
Armed forces status - Civilian - Nonveteran (%)
Fatal accidents locations in years 2005-2021
Fatal accidents locations in 2005
Fatal accidents locations in 2006
Fatal accidents locations in 2007
Fatal accidents locations in 2008
Fatal accidents locations in 2009
Fatal accidents locations in 2010
Fatal accidents locations in 2011
Fatal accidents locations in 2012
Fatal accidents locations in 2013
Fatal accidents locations in 2014
Fatal accidents locations in 2015
Fatal accidents locations in 2016
Fatal accidents locations in 2017
Fatal accidents locations in 2018
Fatal accidents locations in 2019
Fatal accidents locations in 2020
Fatal accidents locations in 2021
Alcohol use - People drinking some alcohol every month (%)
Alcohol use - People not drinking at all (%)
Alcohol use - Average days/month drinking alcohol
Alcohol use - Average drinks/week
Alcohol use - Average days/year people drink much
Audiometry - Average condition of hearing (%)
Audiometry - People that can hear a whisper from across a quiet room (%)
Audiometry - People that can hear normal voice from across a quiet room (%)
Audiometry - Ears ringing, roaring, buzzing (%)
Audiometry - Had a job exposure to loud noise (%)
Audiometry - Had off-work exposure to loud noise (%)
Blood Pressure & Cholesterol - Has high blood pressure (%)
Blood Pressure & Cholesterol - Checking blood pressure at home (%)
Blood Pressure & Cholesterol - Frequently checking blood cholesterol (%)
Blood Pressure & Cholesterol - Has high cholesterol level (%)
Consumer Behavior - Money monthly spent on food at supermarket/grocery store
Consumer Behavior - Money monthly spent on food at other stores
Consumer Behavior - Money monthly spent on eating out
Consumer Behavior - Money monthly spent on carryout/delivered foods
Consumer Behavior - Income spent on food at supermarket/grocery store (%)
Consumer Behavior - Income spent on food at other stores (%)
Consumer Behavior - Income spent on eating out (%)
Consumer Behavior - Income spent on carryout/delivered foods (%)
Current Health Status - General health condition (%)
Current Health Status - Blood donors (%)
Current Health Status - Has blood ever tested for HIV virus (%)
Current Health Status - Left-handed people (%)
Dermatology - People using sunscreen (%)
Diabetes - Diabetics (%)
Diabetes - Had a blood test for high blood sugar (%)
Diabetes - People taking insulin (%)
Diet Behavior & Nutrition - Diet health (%)
Diet Behavior & Nutrition - Milk product consumption (# of products/month)
Diet Behavior & Nutrition - Meals not home prepared (#/week)
Diet Behavior & Nutrition - Meals from fast food or pizza place (#/week)
Diet Behavior & Nutrition - Ready-to-eat foods (#/month)
Diet Behavior & Nutrition - Frozen meals/pizza (#/month)
Drug Use - People that ever used marijuana or hashish (%)
Drug Use - Ever used hard drugs (%)
Drug Use - Ever used any form of cocaine (%)
Drug Use - Ever used heroin (%)
Drug Use - Ever used methamphetamine (%)
Health Insurance - People covered by health insurance (%)
Kidney Conditions-Urology - Avg. # of times urinating at night
Medical Conditions - People with asthma (%)
Medical Conditions - People with anemia (%)
Medical Conditions - People with psoriasis (%)
Medical Conditions - People with overweight (%)
Medical Conditions - Elderly people having difficulties in thinking or remembering (%)
Medical Conditions - People who ever received blood transfusion (%)
Medical Conditions - People having trouble seeing even with glass/contacts (%)
Medical Conditions - People with arthritis (%)
Medical Conditions - People with gout (%)
Medical Conditions - People with congestive heart failure (%)
Medical Conditions - People with coronary heart disease (%)
Medical Conditions - People with angina pectoris (%)
Medical Conditions - People who ever had heart attack (%)
Medical Conditions - People who ever had stroke (%)
Medical Conditions - People with emphysema (%)
Medical Conditions - People with thyroid problem (%)
Medical Conditions - People with chronic bronchitis (%)
Medical Conditions - People with any liver condition (%)
Medical Conditions - People who ever had cancer or malignancy (%)
Mental Health - People who have little interest in doing things (%)
Mental Health - People feeling down, depressed, or hopeless (%)
Mental Health - People who have trouble sleeping or sleeping too much (%)
Mental Health - People feeling tired or having little energy (%)
Mental Health - People with poor appetite or overeating (%)
Mental Health - People feeling bad about themself (%)
Mental Health - People who have trouble concentrating on things (%)
Mental Health - People moving or speaking slowly or too fast (%)
Mental Health - People having thoughts they would be better off dead (%)
Oral Health - Average years since last visit a dentist
Oral Health - People embarrassed because of mouth (%)
Oral Health - People with gum disease (%)
Oral Health - General health of teeth and gums (%)
Oral Health - Average days a week using dental floss/device
Oral Health - Average days a week using mouthwash for dental problem
Oral Health - Average number of teeth
Pesticide Use - Households using pesticides to control insects (%)
Pesticide Use - Households using pesticides to kill weeds (%)
Physical Activity - People doing vigorous-intensity work activities (%)
Physical Activity - People doing moderate-intensity work activities (%)
Physical Activity - People walking or bicycling (%)
Physical Activity - People doing vigorous-intensity recreational activities (%)
Physical Activity - People doing moderate-intensity recreational activities (%)
Physical Activity - Average hours a day doing sedentary activities
Physical Activity - Average hours a day watching TV or videos
Physical Activity - Average hours a day using computer
Physical Functioning - People having limitations keeping them from working (%)
Physical Functioning - People limited in amount of work they can do (%)
Physical Functioning - People that need special equipment to walk (%)
Physical Functioning - People experiencing confusion/memory problems (%)
Physical Functioning - People requiring special healthcare equipment (%)
Prescription Medications - Average number of prescription medicines taking
Preventive Aspirin Use - Adults 40+ taking low-dose aspirin (%)
Reproductive Health - Vaginal deliveries (%)
Reproductive Health - Cesarean deliveries (%)
Reproductive Health - Deliveries resulted in a live birth (%)
Reproductive Health - Pregnancies resulted in a delivery (%)
Reproductive Health - Women breastfeeding newborns (%)
Reproductive Health - Women that had a hysterectomy (%)
Reproductive Health - Women that had both ovaries removed (%)
Reproductive Health - Women that have ever taken birth control pills (%)
Reproductive Health - Women taking birth control pills (%)
Reproductive Health - Women that have ever used Depo-Provera or injectables (%)
Reproductive Health - Women that have ever used female hormones (%)
Sexual Behavior - People 18+ that ever had sex (vaginal, anal, or oral) (%)
Sexual Behavior - Males 18+ that ever had vaginal sex with a woman (%)
Sexual Behavior - Males 18+ that ever performed oral sex on a woman (%)
Sexual Behavior - Males 18+ that ever had anal sex with a woman (%)
Sexual Behavior - Males 18+ that ever had any sex with a man (%)
Sexual Behavior - Females 18+ that ever had vaginal sex with a man (%)
Sexual Behavior - Females 18+ that ever performed oral sex on a man (%)
Sexual Behavior - Females 18+ that ever had anal sex with a man (%)
Sexual Behavior - Females 18+ that ever had any kind of sex with a woman (%)
Sexual Behavior - Average age people first had sex
Sexual Behavior - Average number of female sex partners in lifetime (males 18+)
Sexual Behavior - Average number of female vaginal sex partners in lifetime (males 18+)
Sexual Behavior - Average age people first performed oral sex on a woman (18+)
Sexual Behavior - Average number of woman performed oral sex on in lifetime (18+)
Sexual Behavior - Average number of male sex partners in lifetime (males 18+)
Sexual Behavior - Average number of male anal sex partners in lifetime (males 18+)
Sexual Behavior - Average age people first performed oral sex on a man (18+)
Sexual Behavior - Average number of male oral sex partners in lifetime (18+)
Sexual Behavior - People using protection when performing oral sex (%)
Sexual Behavior - Average number of times people have vaginal or anal sex a year
Sexual Behavior - People having sex without condom (%)
Sexual Behavior - Average number of male sex partners in lifetime (females 18+)
Sexual Behavior - Average number of male vaginal sex partners in lifetime (females 18+)
Sexual Behavior - Average number of female sex partners in lifetime (females 18+)
Sexual Behavior - Circumcised males 18+ (%)
Sleep Disorders - Average hours sleeping at night
Sleep Disorders - People that has trouble sleeping (%)
Smoking-Cigarette Use - People smoking cigarettes (%)
Taste & Smell - People 40+ having problems with smell (%)
Taste & Smell - People 40+ having problems with taste (%)
Taste & Smell - People 40+ that ever had wisdom teeth removed (%)
Taste & Smell - People 40+ that ever had tonsils teeth removed (%)
Taste & Smell - People 40+ that ever had a loss of consciousness because of a head injury (%)
Taste & Smell - People 40+ that ever had a broken nose or other serious injury to face or skull (%)
Taste & Smell - People 40+ that ever had two or more sinus infections (%)
Weight - Average height (inches)
Weight - Average weight (pounds)
Weight - Average BMI
Weight - People that are obese (%)
Weight - People that ever were obese (%)
Weight - People trying to lose weight (%)
Urban population: 14,225
Rural population: 499
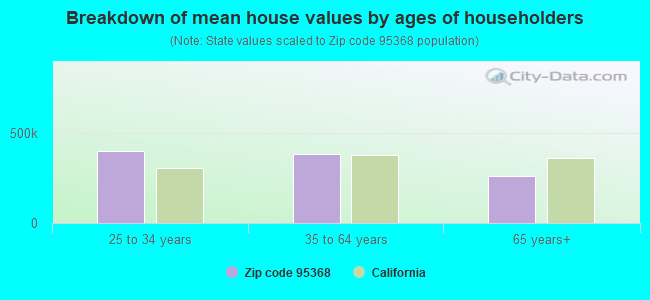
Estimated median house/condo value in 2022: $452,473
95368:
$452,473California:
$715,900
Median resident age: This zip code:
32.4 yearsCalifornia median age:
37.9 years
Average household size: This zip code:
3.3 peopleCalifornia:
2.8 people
Averages for the 2020 tax year for zip code 95368, filed in 2021:
Average Adjusted Gross Income (AGI) in 2020: $60,957 (Individual Income Tax Returns) Here:
$60,957State:
$95,910
Salary/wage: $55,385 (reported on 87.1% of returns )Here:
$55,385State:
$77,331
(% of AGI for various income ranges: 1309.9% for AGIs below $25k , 3989.8% for AGIs $25k-50k , 7279.0% for AGIs $50k-75k , 10921.0% for AGIs $75k-100k , 21275.6% for AGIs $100k-200k , 67275.0% for AGIs over 200k ) Taxable interest for individuals: $419 (reported on 33.0% of returns )This zip code:
$419California:
$2,294
(% of AGI for various income ranges: 4.9% for AGIs below $25k , 9.4% for AGIs $25k-50k , 9.7% for AGIs $50k-75k , 14.8% for AGIs $75k-100k , 26.4% for AGIs $100k-200k , 1152.5% for AGIs over 200k ) Ordinary dividends: $2,721 (reported on 7.7% of returns )(% of AGI for various income ranges: 6.3% for AGIs below $25k , 9.0% for AGIs $25k-50k , 20.1% for AGIs $50k-75k , 17.4% for AGIs $75k-100k , 63.1% for AGIs $100k-200k , 1552.5% for AGIs over 200k ) Net capital gain/loss in AGI: +$10,703 (reported on 8.7% of returns )Here:
+$10,703State:
+$49,306
(% of AGI for various income ranges: 5.4% for AGIs below $25k , 13.7% for AGIs $25k-50k , 12.0% for AGIs $50k-75k , 58.0% for AGIs $75k-100k , 175.4% for AGIs $100k-200k , 11882.5% for AGIs over 200k ) Profit/loss from business: +$11,401 (reported on 13.3% of returns )Here:
+$11,401State:
+$15,671
(% of AGI for various income ranges: 116.5% for AGIs below $25k , 160.3% for AGIs $25k-50k , 275.2% for AGIs $50k-75k , 229.2% for AGIs $75k-100k , 355.4% for AGIs $100k-200k , 3495.0% for AGIs over 200k ) Taxable individual retirement arrangement distribution: $17,609 (reported on 3.3% of returns )95368:
$17,609California:
$23,505
(% of AGI for various income ranges: 23.4% for AGIs below $25k , 28.8% for AGIs $25k-50k , 116.5% for AGIs $50k-75k , 101.8% for AGIs $75k-100k , 326.4% for AGIs $100k-200k ) Total itemized deductions: $27,384 (reported on 10.9% of returns )Here:
$27,384State:
$39,517
(% of AGI for various income ranges: 43.5% for AGIs below $25k , 134.0% for AGIs $25k-50k , 504.4% for AGIs $50k-75k , 731.6% for AGIs $75k-100k , 1410.2% for AGIs $100k-200k , 5675.0% for AGIs over 200k ) Charity contributions: $5,138 (reported on 8.4% of returns )(% of AGI for various income ranges: 4.9% for AGIs below $25k , 9.0% for AGIs $25k-50k , 62.8% for AGIs $50k-75k , 82.8% for AGIs $75k-100k , 238.8% for AGIs $100k-200k , 1195.0% for AGIs over 200k ) Taxes paid: $8,357 (reported on 10.9% of returns )(% of AGI for various income ranges: 9.3% for AGIs below $25k , 31.3% for AGIs $25k-50k , 157.3% for AGIs $50k-75k , 254.2% for AGIs $75k-100k , 462.7% for AGIs $100k-200k , 1242.5% for AGIs over 200k ) Earned income credit: $2,158 (reported on 14.8% of returns )(% of AGI for various income ranges: 81.5% for AGIs below $25k , 81.9% for AGIs $25k-50k , 1.5% for AGIs $50k-75k ) Percentage of individuals using paid preparers for their 2020 taxes: 93.6%(% for various income ranges: 92.1% for AGIs below $25k , 93.1% for AGIs $25k-50k , 95.7% for AGIs $50k-75k , 96.0% for AGIs $75k-100k , 93.6% for AGIs $100k-200k , 92.9% for AGIs over 200k )
Averages for the 2012 tax year for zip code 95368, filed in 2013:
Average Adjusted Gross Income (AGI) in 2012: $50,814 (Individual Income Tax Returns) Here:
$50,814State:
$72,726
Salary/wage: $46,429 (reported on 89.3% of returns )Here:
$46,429State:
$59,079
(% of AGI for various income ranges: 76.1% for AGIs below $25k , 82.5% for AGIs $25k-50k , 85.8% for AGIs $50k-75k , 86.8% for AGIs $75k-100k , 87.7% for AGIs $100k-200k , 43.4% for AGIs over 200k ) Taxable interest for individuals: $423 (reported on 33.3% of returns )This zip code:
$423California:
$2,146
(% of AGI for various income ranges: 0.2% for AGIs below $25k , 0.2% for AGIs $25k-50k , 0.2% for AGIs $50k-75k , 0.1% for AGIs $75k-100k , 0.2% for AGIs $100k-200k , 1.6% for AGIs over 200k ) Ordinary dividends: $1,286 (reported on 7.6% of returns )(% of AGI for various income ranges: 0.2% for AGIs below $25k , 0.3% for AGIs $25k-50k , 0.1% for AGIs $50k-75k , 0.2% for AGIs $75k-100k , 0.2% for AGIs $100k-200k ) Net capital gain/loss in AGI: +$5,300 (reported on 5.7% of returns )Here:
+$5,300State:
+$30,460
(% of AGI for various income ranges: 2.4% for AGIs $100k-200k ) Profit/loss from business: +$10,216 (reported on 13.2% of returns )Here:
+$10,216State:
+$17,064
(% of AGI for various income ranges: 8.2% for AGIs below $25k , 4.2% for AGIs $25k-50k , 2.6% for AGIs $50k-75k , 1.6% for AGIs $75k-100k , 1.3% for AGIs $100k-200k ) Taxable individual retirement arrangement distribution: $13,976 (reported on 5.0% of returns )95368:
$13,976California:
$19,557
(% of AGI for various income ranges: 1.2% for AGIs below $25k , 1.0% for AGIs $25k-50k , 1.4% for AGIs $50k-75k , 1.2% for AGIs $75k-100k , 2.1% for AGIs $100k-200k ) Total itemized deductions: $21,241 (26% of AGI, reported on 39.3% of returns )Here:
$21,241State:
$34,004
Here:
25.5% of AGIState:
22.7% of AGI
(% of AGI for various income ranges: 9.9% for AGIs below $25k , 13.1% for AGIs $25k-50k , 17.4% for AGIs $50k-75k , 18.5% for AGIs $75k-100k , 19.0% for AGIs $100k-200k , 15.8% for AGIs over 200k ) Charity contributions: $2,551 (reported on 32.5% of returns )(% of AGI for various income ranges: 0.5% for AGIs below $25k , 1.0% for AGIs $25k-50k , 1.6% for AGIs $50k-75k , 1.7% for AGIs $75k-100k , 2.0% for AGIs $100k-200k , 2.9% for AGIs over 200k ) Taxes paid: $7,082 (reported on 39.3% of returns )95368:
$7,082State:
$14,448
(% of AGI for various income ranges: 2.2% for AGIs below $25k , 3.4% for AGIs $25k-50k , 5.1% for AGIs $50k-75k , 6.1% for AGIs $75k-100k , 7.0% for AGIs $100k-200k , 8.5% for AGIs over 200k ) Earned income credit: $2,331 (reported on 21.0% of returns )(% of AGI for various income ranges: 7.5% for AGIs below $25k , 1.6% for AGIs $25k-50k ) Percentage of individuals using paid preparers for their 2012 taxes: 60.8%(% for various income ranges: 56.7% for AGIs below $25k , 62.4% for AGIs $25k-50k , 61.5% for AGIs $50k-75k , 65.6% for AGIs $75k-100k , 63.8% for AGIs $100k-200k , 80.0% for AGIs over 200k )
Averages for the 2004 tax year for zip code 95368, filed in 2005:
Average Adjusted Gross Income (AGI) in 2004: $47,658 (Individual Income Tax Returns) Here:
$47,658State:
$58,600
Salary/wage: $45,135 (reported on 92.5% of returns )Here:
$45,135State:
$49,455
(% of AGI for various income ranges: 100.3% for AGIs below $10k , 79.8% for AGIs $10k-25k , 87.8% for AGIs $25k-50k , 90.7% for AGIs $50k-75k , 91.0% for AGIs $75k-100k , 82.4% for AGIs over 100k ) Taxable interest for individuals: $503 (reported on 45.8% of returns )This zip code:
$503California:
$2,365
(% of AGI for various income ranges: 1.8% for AGIs below $10k , 0.7% for AGIs $10k-25k , 0.4% for AGIs $25k-50k , 0.3% for AGIs $50k-75k , 0.3% for AGIs $75k-100k , 0.7% for AGIs over 100k ) Taxable dividends: $758 (reported on 11.1% of returns )(% of AGI for various income ranges: 1.2% for AGIs below $10k , 0.3% for AGIs $10k-25k , 0.2% for AGIs $25k-50k , 0.1% for AGIs $50k-75k , 0.1% for AGIs $75k-100k , 0.2% for AGIs over 100k ) Net capital gain/loss: +$5,583 (reported on 9.0% of returns )Here:
+$5,583State:
+$23,418
(% of AGI for various income ranges: -0.2% for AGIs below $10k , -0.1% for AGIs $10k-25k , -0.1% for AGIs $25k-50k , 0.2% for AGIs $50k-75k , 0.9% for AGIs $75k-100k , 3.5% for AGIs over 100k ) Profit/loss from business: +$12,680 (reported on 13.6% of returns )Here:
+$12,680State:
+$16,826
(% of AGI for various income ranges: 0.4% for AGIs below $10k , 7.0% for AGIs $10k-25k , 3.7% for AGIs $25k-50k , 2.7% for AGIs $50k-75k , 2.4% for AGIs $75k-100k , 4.8% for AGIs over 100k ) IRA payment deduction: $2,629 (reported on 1.6% of returns )95368:
$2,629California:
$3,192
(% of AGI for various income ranges: 0.2% for AGIs $25k-50k , 0.1% for AGIs $50k-75k , 0.1% for AGIs $75k-100k , 0.1% for AGIs over 100k ) Self-employed pension: $8,821 (reported on 0.5% of returns )Here:
$8,821California:
$17,688
Total itemized deductions: $22,152 (32% of AGI, reported on 53.9% of returns )Here:
$22,152State:
$28,113
Here:
31.9% of AGIState:
25.3% of AGI
(% of AGI for various income ranges: 16.9% for AGIs below $10k , 16.4% for AGIs $10k-25k , 25.1% for AGIs $25k-50k , 29.6% for AGIs $50k-75k , 25.8% for AGIs $75k-100k , 22.1% for AGIs over 100k ) Charity contributions deductions: $2,088 (3% of AGI, reported on 47.4% of returns )Here:
2.9% of AGIState:
3.3% of AGI
(% of AGI for various income ranges: 0.6% for AGIs below $10k , 0.8% for AGIs $10k-25k , 1.7% for AGIs $25k-50k , 2.4% for AGIs $50k-75k , 2.2% for AGIs $75k-100k , 2.3% for AGIs over 100k ) Total tax: $5,166 (reported on 72.2% of returns )95368:
$5,166State:
$10,761
(% of AGI for various income ranges: 2.7% for AGIs below $10k , 3.7% for AGIs $10k-25k , 4.8% for AGIs $25k-50k , 6.1% for AGIs $50k-75k , 7.7% for AGIs $75k-100k , 13.8% for AGIs over 100k ) Earned income credit: $1,744 (reported on 15.7% of returns )Percentage of individuals using paid preparers for their 2004 taxes: 65.0%(% for various income ranges: 53.3% for AGIs below $10k , 62.4% for AGIs $10k-25k , 67.8% for AGIs $25k-50k , 71.1% for AGIs $50k-75k , 65.7% for AGIs $75k-100k , 67.2% for AGIs over 100k )
Estimated median household income in 2022: This zip code:
$90,128California:
$91,551
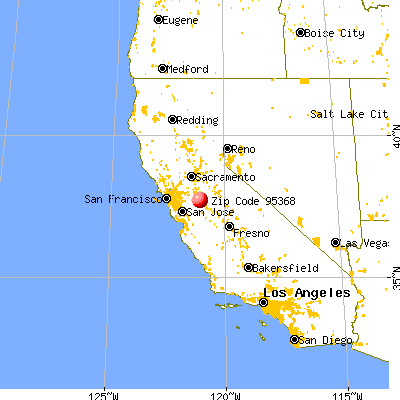
Nearest zip codes: 95356 ,
95366 ,
95350 ,
95358 ,
95351 ,
95320 .
Salida Zip Code Map
Percentage of family households: This zip code:
56.0%California:
46.8%
Percentage of households with unmarried partners: This zip code:
7.2%California:
48.1%
No gay or lesbian households reported
Household received Food Stamps/SNAP in the past 12 months: 430Household did not receive Food Stamps/SNAP in the past 12 months: 3,967
Women who had a birth in the past 12 months: 233 (232 now married , 0 unmarried) Women who did not have a birth in the past 12 months: 3,669 (1,396 now married , 2,274 unmarried)
Housing units in zip code 95368 with a mortgage: 2,792 (133
second mortgage , 125
both second mortgage and home equity loan )
Houses without a mortgage: 24
Median monthly owner costs for units with a mortgage: $1,987
Median monthly owner costs for units without a mortgage: $615
Residents with income below the poverty level in 2022:
This zip code:
8.4%Whole state:
12.2%
Residents with income below 50% of the poverty level in 2022:
This zip code:
3.3%Whole state:
6.2%
Median number of rooms in houses and condos: Median number of rooms in apartments:
Year house built (houses)
0 2020 or later36 2010 to 2019831 2000 to 20091,972 1990 to 1999834 1980 to 1989267 1970 to 197988 1960 to 196956 1950 to 195936 1940 to 1949144 1939 or earlier
Zip code 95368 household income distribution in 2022 137 Less than $10,00021 $10,000 to $14,99986 $15,000 to $19,99977 $20,000 to $24,999196 $25,000 to $29,999133 $30,000 to $34,999165 $35,000 to $39,999217 $45,000 to $49,999243 $50,000 to $59,999404 $60,000 to $74,999920 $75,000 to $99,999489 $100,000 to $124,999383 $125,000 to $149,999451 $150,000 to $199,999466 $200,000 or moreEstimate of home value of owner-occupied houses/condos in 2022 in zip code 95368 22 $100,000 to $124,99914 $150,000 to $174,99926 $200,000 to $249,999210 $250,000 to $299,999924 $300,000 to $399,9991,499 $400,000 to $499,999242 $500,000 to $749,99937 $750,000 to $999,9998 $1,000,000 to $1,499,99946 $1,500,000 to $1,999,99929 $2,000,000 or moreRent paid by renters in 2022 in zip code 95368 4 $550 to $59915 $700 to $74995 $1,000 to $1,249128 $1,250 to $1,499471 $1,500 to $1,99922 $2,000 to $2,49979 $2,500 to $2,99950 No cash rent
Median gross rent in 2022: $2,059.
Estimated median house (or condo) value in 2022 for: White Non-Hispanic householders: $449,348Black or African American householders: $490,908American Indian or Alaska Native householders: $398,413Asian householders: $484,658Native Hawaiian and other Pacific Islander householders: $386,227Some other race householders: $469,659Two or more races householders: $486,533Hispanic or Latino householders: $443,723Estimated median house or condo value in 2022: $452,473
95368:
$452,473California:
$715,900
Lower value quartile - upper value quartile: $382,826 - $510,534
Mean price in 2022: Detached houses: $425,184Here:
$425,184State:
$988,808
Housing units in structures:
One, detached: 4,187One, attached: 18520 to 49: 15Mobile homes: 19Unemployment : 8.7%
Means of transportation to work in zip code 95368 81.8% 5,918 Drove a car alone6.7% 485 Carpooled0.3% 22 Bus or trolley bus0.6% 43 Taxi0.3% 23 Walked0.2% 17 Other means8.0% 581 Worked at homeTravel time to work (commute) in zip code 95368 154 Less than 5 minutes240 5 to 9 minutes856 10 to 14 minutes1,048 15 to 19 minutes1,363 20 to 24 minutes448 25 to 29 minutes943 30 to 34 minutes26 35 to 39 minutes298 40 to 44 minutes224 45 to 59 minutes510 60 to 89 minutes376 90 or more minutes
Percentage of zip code residents living and working in this county: 61.7%
Household type by relationship:
Households: 14,725
Male householders: 2,798 (419 living alone ), Female householders: 1,618 (296 living alone )2,721 spouses (2,718 opposite-sex spouses ), 187 unmarried partners , (187 opposite-sex unmarried partners ), 5,217 children (4,853 natural , 38 adopted , 321 stepchildren ), 439 grandchildren , 404 brothers or sisters , 206 parents , 0 foster children , 650 other relatives , 343 non-relatives In group quarters: 72 (-1 institutionalized population )
Size of family households: 1,069 2-persons , 875 3-persons , 630 4-persons , 414 5-persons , 293 6-persons , 187 7-or-more-persons
Size of nonfamily households: 712 1-person , 175 2-persons , 47 4-persons
2,073 married couples with children. single-parent households (375 men , 117 women ).
53.8% of residents of 95368 zip code speak English at home. of residents speak Spanish at home (70% very well, 14% well, 10% not well, 6% not at all ).of residents speak other Indo-European language at home (80% very well, 10% well, 7% not well, 3% not at all ).of residents speak Asian or Pacific Island language at home (85% very well, 7% well, 9% not well ).
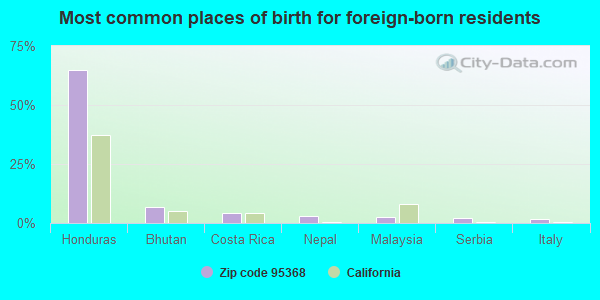
Foreign born population: 2,875 (19.5%)
(53.7%
of them are naturalized citizens )
This zip code:
19.5%Whole state:
26.7%
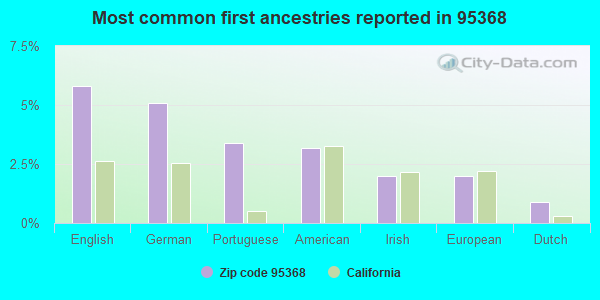
65% Honduras 7% Bhutan 4% Costa Rica 3% Nepal 2% Malaysia 2% Serbia 2% Italy 6% English 5% German 3% Portuguese 3% American 2% Irish 2% European 1% Dutch
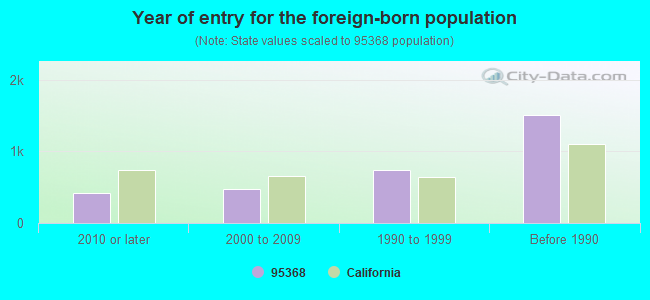
Year of entry for the foreign-born population
424 2010 or later 478 2000 to 2009 734 1990 to 1999 1,507 Before 1990
Facilities with environmental interests located in this zip code:
GEORGE LOWRY INC (4612 KIERNAN CT in SALIDA, CA)
STATE MASTER (California - Hazardous Waste Tracking) - HAZARDOU WASTE PROGRAM TRANSPORTER (Resource Conservation and Recovery Act (tracking hazardous waste)) USED OIL PROGRAM (Resource Conservation and Recovery Act (tracking hazardous waste)) Alternative names: GEORGE LOWRY BULK PLANT
MC KNIGHT ENTERPRISES (5048 TREETOP DR in SALIDA, CA)
STATE MASTER (California - Hazardous Waste Tracking) - HAZARDOU WASTE PROGRAM TRANSPORTER (Resource Conservation and Recovery Act (tracking hazardous waste)) - notification Organizations: GARY L MC KNIGHT (CONTACT/OWNER)
Alternative names: MCKNIGHT ENTERPRISES
AMERIC DISC USA (4701 STODDARD RD in SALIDA, CA)
HAZARDOUS WASTE BIENNIAL REPORTER (Resource Conservation and Recovery Act (tracking hazardous waste)) (Resource Conservation and Recovery Act (tracking hazardous waste)) Organizations: 4701 STODDARD LLC (CONTACT/OPERATOR)
MONTES TRUCKING (4413 GENOA CT in SALIDA, CA)
TRANSPORTER (Resource Conservation and Recovery Act (tracking hazardous waste)) - notification Organizations: SABAS MONTES (CONTACT/OWNER)
AAI TERMITE AND PEST CONTROL (4979 SALIDA BLVD in SALIDA, CA)
COMPLIANCE ACTIVITY (Tracking inspections of insecticide, fungicide, and rodenticide, and toxic substances)
Housing units lacking complete plumbing facilities: 0.3%
Housing units lacking complete kitchen facilities: 0.2%
82.5% Utility gas 14.0% Electricity 2.7% Wood
Population in 1990: 3,255. Population change in the 1990s: +9,209 (+282.9%).
Place of birth for U.S.-born residents:
This state: 9,915Northeast: 257Midwest: 532South: 533West: 287
39% of the 95368 zip code residents lived in the same house 5 years ago.
Out of people who lived in different houses, 42% lived in this county.
Out of people who lived in different counties, 50% lived in California.
94% of the 95368 zip code residents lived in the same house 1 year ago.
Out of people who lived in different houses, 46% moved from this county.
Out of people who lived in different houses, 54% moved from different county within same state.
Out of people who lived in different houses, 4% moved from different state.
Private vs. public school enrollment:
Students in private schools in grades 1 to 8 (elementary and middle school): 15
Here:
1.1%California:
10.5%
Students in private schools in grades 9 to 12 (high school): 61
Here:
11.4%California:
8.5%
Students in private undergraduate colleges: 182
Here:
13.1%California:
15.9%
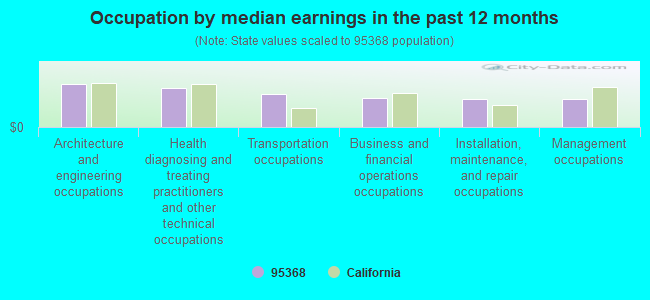
Occupation by median earnings in the past 12 months ($)
100,930 Architecture and engineering occupations 93,005 Health diagnosing and treating practitioners and other technical occupations 78,856 Transportation occupations 68,774 Business and financial operations occupations 67,290 Installation, maintenance, and repair occupations 65,556 Management occupations
Top industries in this zip code by the number of employees in 2005:
Construction: All Other Specialty Trade Contractors (100-249 employees: 1 establishment, 20-49 employees: 1 establishment, 1-4 employees: 1 establishment)Construction: Drywall and Insulation Contractors (100-249: 1, 5-9: 1)Accommodation and Food Services: Limited-Service Restaurants (50-99: 1, 20-49: 2, 1-4: 1)Construction: Tile and Terrazzo Contractors (50-99: 1, 5-9: 1)Construction: New Housing Operative Builders (50-99: 1)Accommodation and Food Services: Hotels (except Casino Hotels) and Motels (20-49: 2, 1-4: 1)Administrative and Support and Waste Management and Remediation Services: Landscaping Services (20-49: 1, 5-9: 1, 1-4: 1)Administrative and Support and Waste Management and Remediation Services: Janitorial Services (20-49: 1, 5-9: 1)Administrative and Support and Waste Management and Remediation Services: Exterminating and Pest Control Services (20-49: 1, 1-4: 1)
People in group quarters in 2010:
73 people in group homes intended for adults
People in group quarters in 2000:
114 people in other noninstitutional group quarters
Fatal accident statistics in 2013:
Fatal accident count: 1Vehicles involved in fatal accidents: 1Fatal accidents caused by drunken drivers: 0Fatalities: 1Persons involved in fatal accidents: 1Pedestrians involved in fatal accidents: 0
Fatal accident statistics in 2012:
Fatal accident count: 1Vehicles involved in fatal accidents: 1Fatal accidents caused by drunken drivers: 0Fatalities: 1Persons involved in fatal accidents: 1Pedestrians involved in fatal accidents: 1
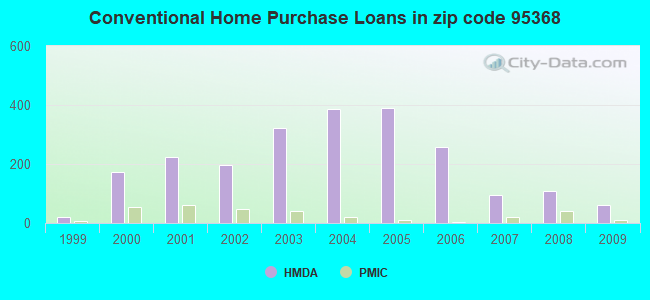
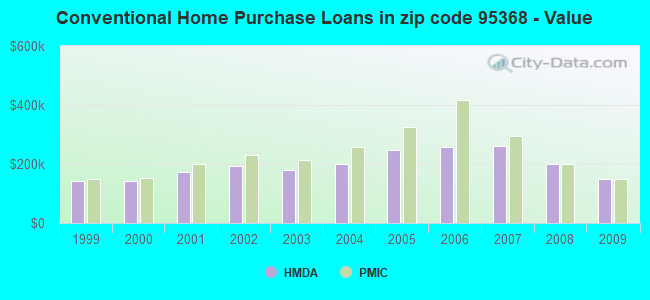
Home Mortgage Disclosure Act Aggregated Statistics For Year 2009(Based on 4 partial tracts) A) FHA, FSA/RHS & VA B) Conventional C) Refinancings D) Home Improvement Loans F) Non-occupant Loans on Number Average Value Number Average Value Number Average Value Number Average Value Number Average Value
LOANS ORIGINATED 146 $157,978 60 $148,681 114 $211,451 3 $179,720 22 $116,578 APPLICATIONS APPROVED, NOT ACCEPTED 16 $156,501 9 $149,657 19 $193,295 1 $276,650 3 $105,930 APPLICATIONS DENIED 19 $158,796 9 $173,374 72 $243,991 5 $57,446 7 $202,780 APPLICATIONS WITHDRAWN 14 $171,903 13 $205,905 36 $177,206 3 $116,587 7 $149,556 FILES CLOSED FOR INCOMPLETENESS 3 $172,663 4 $177,792 16 $170,111 0 $0 1 $184,120
Aggregated Statistics For Year 2008(Based on 4 partial tracts) A) FHA, FSA/RHS & VA B) Conventional C) Refinancings D) Home Improvement Loans F) Non-occupant Loans on G) Loans On Manufactured Number Average Value Number Average Value Number Average Value Number Average Value Number Average Value Number Average Value
LOANS ORIGINATED 111 $197,513 109 $198,486 76 $224,928 8 $98,446 42 $150,535 0 $0 APPLICATIONS APPROVED, NOT ACCEPTED 8 $185,230 29 $217,012 29 $268,427 2 $117,625 8 $145,461 0 $0 APPLICATIONS DENIED 23 $221,211 48 $196,026 103 $269,417 16 $79,654 22 $184,080 2 $181,250 APPLICATIONS WITHDRAWN 14 $217,406 24 $198,601 45 $237,619 5 $80,410 8 $107,865 0 $0 FILES CLOSED FOR INCOMPLETENESS 3 $286,027 13 $199,718 20 $286,046 0 $0 4 $183,428 0 $0
Aggregated Statistics For Year 2007(Based on 4 partial tracts) A) FHA, FSA/RHS & VA B) Conventional C) Refinancings D) Home Improvement Loans E) Loans on Dwellings For 5+ Families F) Non-occupant Loans on G) Loans On Manufactured Number Average Value Number Average Value Number Average Value Number Average Value Number Average Value Number Average Value Number Average Value
LOANS ORIGINATED 1 $260,010 95 $260,584 335 $268,690 39 $198,527 1 $386,930 32 $232,633 0 $0 APPLICATIONS APPROVED, NOT ACCEPTED 0 $0 27 $293,408 83 $277,691 13 $99,059 0 $0 10 $198,242 2 $279,490 APPLICATIONS DENIED 0 $0 50 $275,156 325 $307,092 48 $170,917 0 $0 23 $245,636 4 $161,248 APPLICATIONS WITHDRAWN 2 $361,130 10 $330,814 141 $293,565 10 $192,401 0 $0 8 $313,772 0 $0 FILES CLOSED FOR INCOMPLETENESS 0 $0 8 $280,780 50 $328,215 7 $290,783 0 $0 4 $273,288 0 $0
Aggregated Statistics For Year 2006(Based on 4 partial tracts) A) FHA, FSA/RHS & VA B) Conventional C) Refinancings D) Home Improvement Loans E) Loans on Dwellings For 5+ Families F) Non-occupant Loans on G) Loans On Manufactured Number Average Value Number Average Value Number Average Value Number Average Value Number Average Value Number Average Value Number Average Value
LOANS ORIGINATED 0 $0 256 $256,146 654 $271,712 103 $163,348 0 $0 46 $254,754 1 $94,930 APPLICATIONS APPROVED, NOT ACCEPTED 1 $136,200 54 $246,206 139 $289,931 13 $195,005 0 $0 19 $292,889 1 $136,200 APPLICATIONS DENIED 0 $0 99 $265,239 388 $305,033 59 $146,713 1 $386,930 29 $242,008 0 $0 APPLICATIONS WITHDRAWN 0 $0 56 $254,326 251 $293,573 20 $251,246 0 $0 10 $240,733 1 $37,140 FILES CLOSED FOR INCOMPLETENESS 0 $0 16 $250,048 64 $330,469 2 $118,445 0 $0 5 $254,146 0 $0
Aggregated Statistics For Year 2005(Based on 4 partial tracts) B) Conventional C) Refinancings D) Home Improvement Loans F) Non-occupant Loans on G) Loans On Manufactured Number Average Value Number Average Value Number Average Value Number Average Value Number Average Value
LOANS ORIGINATED 390 $248,426 898 $260,282 94 $195,137 92 $228,657 2 $266,205 APPLICATIONS APPROVED, NOT ACCEPTED 58 $238,687 130 $252,474 19 $143,225 11 $221,991 3 $77,437 APPLICATIONS DENIED 108 $261,247 346 $268,591 59 $112,161 31 $240,864 3 $169,333 APPLICATIONS WITHDRAWN 61 $308,167 271 $259,682 31 $202,793 14 $273,630 2 $231,640 FILES CLOSED FOR INCOMPLETENESS 21 $212,582 86 $268,690 6 $120,053 4 $261,935 0 $0
Aggregated Statistics For Year 2004(Based on 4 partial tracts) A) FHA, FSA/RHS & VA B) Conventional C) Refinancings D) Home Improvement Loans E) Loans on Dwellings For 5+ Families F) Non-occupant Loans on G) Loans On Manufactured Number Average Value Number Average Value Number Average Value Number Average Value Number Average Value Number Average Value Number Average Value
LOANS ORIGINATED 4 $163,935 386 $198,676 856 $212,445 84 $106,777 1 $383,830 78 $164,240 4 $172,940 APPLICATIONS APPROVED, NOT ACCEPTED 0 $0 53 $225,449 132 $207,687 18 $127,663 0 $0 13 $240,382 0 $0 APPLICATIONS DENIED 0 $0 90 $191,625 319 $220,316 45 $81,300 0 $0 26 $174,515 1 $83,010 APPLICATIONS WITHDRAWN 1 $198,110 46 $172,447 239 $209,684 32 $155,741 0 $0 9 $196,581 0 $0 FILES CLOSED FOR INCOMPLETENESS 0 $0 12 $222,670 68 $245,259 4 $73,085 0 $0 0 $0 0 $0
Aggregated Statistics For Year 2003(Based on 4 partial tracts) A) FHA, FSA/RHS & VA B) Conventional C) Refinancings D) Home Improvement Loans F) Non-occupant Loans on Number Average Value Number Average Value Number Average Value Number Average Value Number Average Value
LOANS ORIGINATED 10 $176,247 321 $181,091 1,261 $182,640 39 $44,601 62 $150,797 APPLICATIONS APPROVED, NOT ACCEPTED 1 $303,000 42 $185,559 203 $182,414 12 $61,050 12 $169,255 APPLICATIONS DENIED 5 $191,610 65 $149,688 377 $179,096 32 $35,512 19 $188,187 APPLICATIONS WITHDRAWN 3 $204,097 40 $184,902 279 $182,568 6 $35,778 8 $129,825 FILES CLOSED FOR INCOMPLETENESS 0 $0 5 $236,762 60 $183,814 3 $27,153 3 $128,987
Aggregated Statistics For Year 2002(Based on 2 partial tracts) A) FHA, FSA/RHS & VA B) Conventional C) Refinancings D) Home Improvement Loans E) Loans on Dwellings For 5+ Families F) Non-occupant Loans on Number Average Value Number Average Value Number Average Value Number Average Value Number Average Value Number Average Value
LOANS ORIGINATED 15 $172,057 195 $192,885 446 $184,666 29 $41,607 1 $222,670 25 $143,236 APPLICATIONS APPROVED, NOT ACCEPTED 1 $174,580 24 $207,097 82 $177,032 14 $31,740 0 $0 3 $150,647 APPLICATIONS DENIED 1 $198,630 40 $191,942 162 $181,727 30 $31,106 0 $0 4 $148,808 APPLICATIONS WITHDRAWN 1 $92,230 24 $205,271 108 $175,335 10 $28,888 0 $0 3 $146,143 FILES CLOSED FOR INCOMPLETENESS 0 $0 10 $174,911 28 $163,512 1 $27,010 0 $0 2 $97,665
Aggregated Statistics For Year 2001(Based on 2 partial tracts) A) FHA, FSA/RHS & VA B) Conventional C) Refinancings D) Home Improvement Loans F) Non-occupant Loans on Number Average Value Number Average Value Number Average Value Number Average Value Number Average Value
LOANS ORIGINATED 22 $159,894 224 $174,072 446 $162,772 25 $44,469 22 $145,745 APPLICATIONS APPROVED, NOT ACCEPTED 2 $164,535 27 $155,001 50 $134,250 10 $41,636 2 $173,760 APPLICATIONS DENIED 1 $192,040 42 $165,461 161 $135,277 29 $28,976 6 $120,890 APPLICATIONS WITHDRAWN 1 $212,790 24 $181,939 121 $156,737 12 $51,826 3 $136,043 FILES CLOSED FOR INCOMPLETENESS 0 $0 8 $148,271 29 $156,613 2 $20,260 0 $0
Aggregated Statistics For Year 2000(Based on 2 partial tracts) A) FHA, FSA/RHS & VA B) Conventional C) Refinancings D) Home Improvement Loans E) Loans on Dwellings For 5+ Families F) Non-occupant Loans on Number Average Value Number Average Value Number Average Value Number Average Value Number Average Value Number Average Value
LOANS ORIGINATED 41 $137,344 172 $141,855 70 $123,181 34 $32,514 0 $0 12 $102,663 APPLICATIONS APPROVED, NOT ACCEPTED 5 $126,754 20 $153,814 22 $92,232 22 $40,516 0 $0 1 $87,290 APPLICATIONS DENIED 6 $127,368 42 $140,826 87 $89,097 46 $31,844 1 $73,790 1 $125,500 APPLICATIONS WITHDRAWN 4 $117,020 25 $133,539 47 $91,706 6 $43,207 0 $0 2 $83,995 FILES CLOSED FOR INCOMPLETENESS 3 $127,477 10 $134,165 8 $108,702 0 $0 0 $0 1 $109,360
Aggregated Statistics For Year 1999(Based on 1 partial tract) A) FHA, FSA/RHS & VA B) Conventional C) Refinancings D) Home Improvement Loans F) Non-occupant Loans on Number Average Value Number Average Value Number Average Value Number Average Value Number Average Value
LOANS ORIGINATED 12 $134,168 19 $144,056 17 $137,130 8 $31,244 2 $71,955 APPLICATIONS APPROVED, NOT ACCEPTED 1 $72,410 3 $169,057 4 $112,980 4 $26,538 0 $0 APPLICATIONS DENIED 2 $103,325 5 $115,122 11 $95,827 5 $27,256 0 $0 APPLICATIONS WITHDRAWN 2 $130,275 3 $165,777 8 $113,686 1 $18,830 0 $0 FILES CLOSED FOR INCOMPLETENESS 0 $0 1 $116,480 2 $94,420 0 $0 0 $0
Detailed HMDA statistics for the following Tracts:
0005.01
,
0005.07
Private Mortgage Insurance Companies Aggregated Statistics For Year 2009(Based on 4 partial tracts) A) Conventional B) Refinancings Number Average Value Number Average Value
LOANS ORIGINATED 11 $149,416 0 $0 APPLICATIONS APPROVED, NOT ACCEPTED 7 $157,733 1 $397,940 APPLICATIONS DENIED 1 $123,520 1 $276,520 APPLICATIONS WITHDRAWN 0 $0 0 $0 FILES CLOSED FOR INCOMPLETENESS 0 $0 1 $405,500
Aggregated Statistics For Year 2008(Based on 4 partial tracts) A) Conventional B) Refinancings C) Non-occupant Loans on Number Average Value Number Average Value Number Average Value
LOANS ORIGINATED 40 $201,313 3 $344,420 3 $160,593 APPLICATIONS APPROVED, NOT ACCEPTED 24 $237,722 10 $351,976 3 $210,287 APPLICATIONS DENIED 8 $221,129 0 $0 1 $159,100 APPLICATIONS WITHDRAWN 4 $217,640 1 $316,830 0 $0 FILES CLOSED FOR INCOMPLETENESS 1 $210,490 0 $0 0 $0
Aggregated Statistics For Year 2007(Based on 4 partial tracts) A) Conventional B) Refinancings C) Non-occupant Loans on Number Average Value Number Average Value Number Average Value
LOANS ORIGINATED 20 $294,663 25 $351,926 1 $156,790 APPLICATIONS APPROVED, NOT ACCEPTED 4 $291,882 8 $377,662 1 $271,760 APPLICATIONS DENIED 0 $0 1 $576,340 0 $0 APPLICATIONS WITHDRAWN 2 $290,320 1 $548,340 0 $0 FILES CLOSED FOR INCOMPLETENESS 0 $0 0 $0 0 $0
Aggregated Statistics For Year 2006(Based on 4 partial tracts) A) Conventional B) Refinancings Number Average Value Number Average Value
LOANS ORIGINATED 3 $417,493 8 $363,395 APPLICATIONS APPROVED, NOT ACCEPTED 0 $0 3 $392,877 APPLICATIONS DENIED 0 $0 0 $0 APPLICATIONS WITHDRAWN 0 $0 2 $396,210 FILES CLOSED FOR INCOMPLETENESS 0 $0 0 $0
Aggregated Statistics For Year 2005(Based on 4 partial tracts) A) Conventional B) Refinancings C) Non-occupant Loans on Number Average Value Number Average Value Number Average Value
LOANS ORIGINATED 9 $325,529 8 $339,912 0 $0 APPLICATIONS APPROVED, NOT ACCEPTED 2 $108,855 2 $362,390 1 $203,260 APPLICATIONS DENIED 0 $0 1 $281,640 0 $0 APPLICATIONS WITHDRAWN 0 $0 1 $444,360 0 $0 FILES CLOSED FOR INCOMPLETENESS 0 $0 0 $0 0 $0
Aggregated Statistics For Year 2004(Based on 4 partial tracts) A) Conventional B) Refinancings C) Non-occupant Loans on Number Average Value Number Average Value Number Average Value
LOANS ORIGINATED 20 $257,438 28 $233,899 3 $255,530 APPLICATIONS APPROVED, NOT ACCEPTED 5 $234,044 23 $220,038 1 $167,150 APPLICATIONS DENIED 0 $0 2 $332,240 1 $332,240 APPLICATIONS WITHDRAWN 0 $0 5 $242,200 1 $165,090 FILES CLOSED FOR INCOMPLETENESS 0 $0 1 $195,010 0 $0
Aggregated Statistics For Year 2003(Based on 4 partial tracts) A) Conventional B) Refinancings C) Non-occupant Loans on Number Average Value Number Average Value Number Average Value
LOANS ORIGINATED 41 $213,242 76 $216,114 1 $93,890 APPLICATIONS APPROVED, NOT ACCEPTED 8 $204,806 38 $215,869 3 $194,667 APPLICATIONS DENIED 1 $204,300 2 $194,965 0 $0 APPLICATIONS WITHDRAWN 4 $196,495 10 $220,073 0 $0 FILES CLOSED FOR INCOMPLETENESS 0 $0 1 $265,170 0 $0
Aggregated Statistics For Year 2002(Based on 2 partial tracts) A) Conventional B) Refinancings C) Non-occupant Loans on Number Average Value Number Average Value Number Average Value
LOANS ORIGINATED 49 $229,457 38 $207,011 2 $208,015 APPLICATIONS APPROVED, NOT ACCEPTED 12 $230,306 14 $198,440 0 $0 APPLICATIONS DENIED 1 $153,830 1 $139,010 0 $0 APPLICATIONS WITHDRAWN 1 $345,870 3 $188,197 1 $138,020 FILES CLOSED FOR INCOMPLETENESS 0 $0 0 $0 0 $0
Aggregated Statistics For Year 2001(Based on 2 partial tracts) A) Conventional B) Refinancings C) Non-occupant Loans on Number Average Value Number Average Value Number Average Value
LOANS ORIGINATED 60 $199,776 35 $173,528 1 $225,310 APPLICATIONS APPROVED, NOT ACCEPTED 6 $181,115 10 $176,624 0 $0 APPLICATIONS DENIED 2 $143,620 3 $149,877 1 $139,010 APPLICATIONS WITHDRAWN 3 $173,263 2 $189,405 0 $0 FILES CLOSED FOR INCOMPLETENESS 1 $131,430 0 $0 0 $0
Aggregated Statistics For Year 2000(Based on 2 partial tracts) A) Conventional B) Refinancings C) Non-occupant Loans on Number Average Value Number Average Value Number Average Value
LOANS ORIGINATED 54 $153,366 5 $133,538 3 $125,283 APPLICATIONS APPROVED, NOT ACCEPTED 5 $139,534 2 $116,445 1 $58,300 APPLICATIONS DENIED 2 $160,090 0 $0 0 $0 APPLICATIONS WITHDRAWN 2 $158,605 0 $0 0 $0 FILES CLOSED FOR INCOMPLETENESS 0 $0 0 $0 0 $0
Aggregated Statistics For Year 1999(Based on 1 partial tract) A) Conventional B) Refinancings Number Average Value Number Average Value
LOANS ORIGINATED 6 $149,430 2 $153,870 APPLICATIONS APPROVED, NOT ACCEPTED 0 $0 0 $0 APPLICATIONS DENIED 0 $0 0 $0 APPLICATIONS WITHDRAWN 0 $0 0 $0 FILES CLOSED FOR INCOMPLETENESS 0 $0 0 $0
Detailed PMIC statistics for the following Tracts:
0005.01
,
0005.07
2005 - 2018 National Fire Incident Reporting System (NFIRS) incidents See full 2006 National Fire Incident Reporting System statistics for zip code 95368, California
Most common first names in zip code 95368 among deceased individuals Name Count Lived (average)
William 25 74.6 years John 20 78.4 years James 18 68.3 years Mary 15 76.8 years Robert 15 63.4 years Charles 11 77.3 years Thomas 11 70.3 years Donald 10 66.3 years Dorothy 10 79.5 years Joe 9 72.2 years
Most common last names in zip code 95368 among deceased individuals Last name Count Lived (average)
Jones 12 74.1 years Cole 9 77.1 years Williams 9 61.3 years Rodriguez 8 69.6 years Brown 7 78.5 years Johnson 6 81.5 years Hamrick 6 66.3 years Garcia 6 72.5 years Smith 6 66.3 years Robison 6 67.5 years
Businesses in zip code 95368
Name Count Name Count
Burger King 1 Little Caesars Pizza 1 Curves 1 Marriott 1 Dennys 1 McDonald's 1 Hilton 1 U-Haul 1 La Quinta 1


 Nearest zip codes: 95356, 95366, 95350, 95358, 95351, 95320.
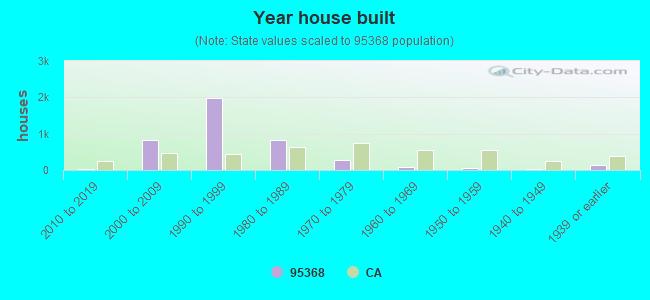


 Based on the data from the years 2005 - 2018 the average number of fire incidents per year is 44. The highest number of reported fire incidents - 98 took place in 2018, and the least - 0 in 2014. The data has a growing trend.
 When looking into fire subcategories, the most reports belonged to: Outside Fires (40.6%), and Structure Fires (29.2%).