Crime rate in Fithian, Illinois (IL): murders, rapes, robberies, assaults, burglaries, thefts, auto thefts, arson, crime map
Crime rate in Fithian, IL
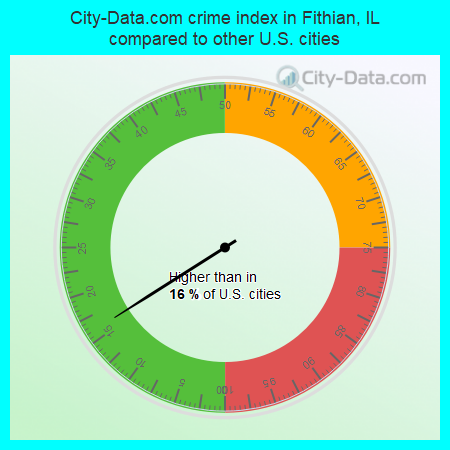
The 2022 crime rate in Fithian, IL is 23 (City-Data.com crime index), which is 10.6 times lower than the U.S. average. It was higher than in 16.0% U.S. cities. The 2022 Fithian crime rate fell by 25% compared to 2019. In the last 5 years Fithian has seen constant level of violent crime and decline of property crime.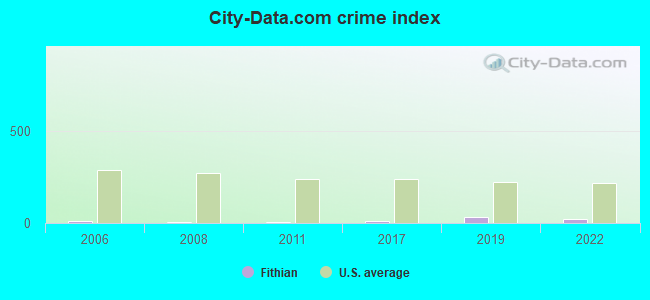
Type |
2011 |
2017 |
2019 |
2022 |
|---|---|---|---|---|
| Murders (per 100,000) | 0 (0.0) | 0 (0.0) | 0 (0.0) | 0 (0.0) |
| Rapes (per 100,000) | 0 (0.0) | 0 (0.0) | 0 (0.0) | 0 (0.0) |
| Robberies (per 100,000) | 0 (0.0) | 0 (0.0) | 0 (0.0) | 0 (0.0) |
| Assaults (per 100,000) | 0 (0.0) | 0 (0.0) | 0 (0.0) | 0 (0.0) |
| Burglaries (per 100,000) | 0 (0.0) | 0 (0.0) | 2 (439.6) | 1 (211.0) |
| Thefts (per 100,000) | 1 (205.8) | 1 (218.3) | 0 (0.0) | 1 (211.0) |
| Auto thefts (per 100,000) | 0 (0.0) | 0 (0.0) | 0 (0.0) | 0 (0.0) |
| Arson (per 100,000) | 0 (0.0) | 0 (0.0) | 0 (0.0) | 0 (0.0) |
| City-Data.com crime index | 8.2 | 8.7 | 30.8 | 23.2 |
The City-Data.com crime index weighs serious crimes and violent crimes more heavily. Higher means more crime, U.S. average is 246.1. It adjusts for the number of visitors and daily workers commuting into cities.
Violent crime rate in 2022
| Fithian: | 0.0 |
| U.S. Average: | 219.8 |
Violent crime rate in 2019
| Fithian: | 0.0 |
| U.S. Average: | 219.9 |
Violent crime rate in 2017
| Fithian: | 0.0 |
| U.S. Average: | 226.2 |
Violent crime rate in 2011
| Fithian: | 0.0 |
| U.S. Average: | 187.1 |
Violent crime rate in 2008
| Fithian: | 0.0 |
| U.S. Average: | 222.5 |
Violent crime rate in 2006
| Fithian: | 0.0 |
| U.S. Average: | 232.6 |
Property crime rate in 2022
| Fithian: | 52.7 |
| U.S. Average: | 166.5 |
Property crime rate in 2019
| Fithian: | 87.9 |
| U.S. Average: | 179.7 |
Property crime rate in 2017
| Fithian: | 10.9 |
| U.S. Average: | 206.4 |
Property crime rate in 2011
| Fithian: | 10.3 |
| U.S. Average: | 273.5 |
Property crime rate in 2008
| Fithian: | 9.1 |
| U.S. Average: | 302.2 |
Property crime rate in 2006
| Fithian: | 37.5 |
| U.S. Average: | 317.3 |


Zip codes: 61844.