Crime rate in Cincinnati, Ohio (OH): murders, rapes, robberies, assaults, burglaries, thefts, auto thefts, arson, law enforcement employees, police officers, crime map
Crime rate in Cincinnati, OH
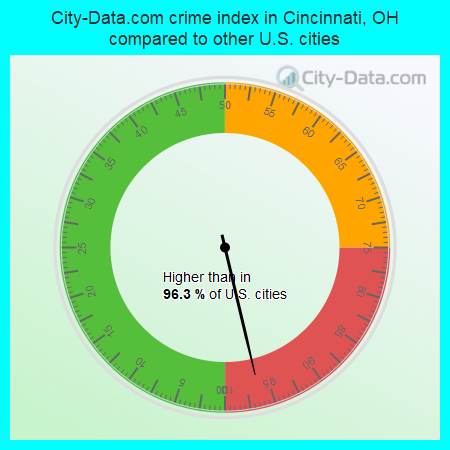
The 2022 crime rate in Cincinnati, OH is 477 (City-Data.com crime index), which is 1.9 times higher than the U.S. average. It was higher than in 96.3% U.S. cities. The 2022 Cincinnati crime rate rose by 5% compared to 2021. The number of homicides stood at 73 - a decrease of 18 compared to 2021. In the last 5 years Cincinnati has seen decline of violent crime and decline of property crime.See how dangerous Cincinnati, OH is compared to the nearest cities:
(Note: Higher means more crime)
(Note: Higher means more crime)
| Cincinnati: | 476.8 |
| St. Bernard: | 232.9 |
| Dayton: | 109.2 |
| Bellevue: | 58.5 |
| Norwood: | 241.4 |
| Newport: | 283.7 |
| Elmwood Place: | 38.0 |
| Ludlow: | 123.1 |
| Golf Manor: | 28.4 |
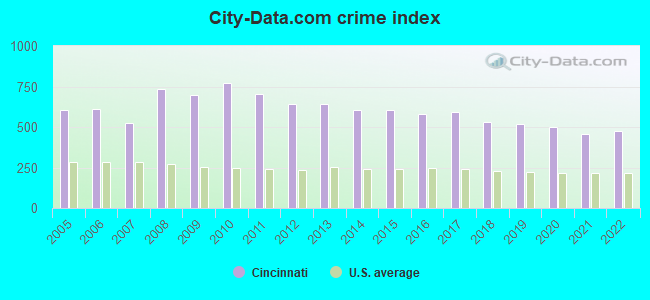
The City-Data.com crime index weighs serious crimes and violent crimes more heavily. Higher means more crime, U.S. average is 246.1. It adjusts for the number of visitors and daily workers commuting into cities.
- means the value is smaller than the state average.- means the value is bigger than the state average.
- means the value is much bigger than the state average.
According to our research of Ohio and other state lists, there were 1,093 registered sex offenders living in Cincinnati, Ohio as of May 03, 2024.
The ratio of all residents to sex offenders in Cincinnati is 273 to 1.
Violent crime rate in 2022
| Cincinnati: | 498.6 |
| U.S. Average: | 219.8 |
Violent crime rate in 2021
| Cincinnati: | 497.9 |
| U.S. Average: | 224.8 |
Violent crime rate in 2020
| Cincinnati: | 536.1 |
| U.S. Average: | 228.2 |
Violent crime rate in 2019
| Cincinnati: | 513.1 |
| U.S. Average: | 219.9 |
Violent crime rate in 2018
| Cincinnati: | 509.4 |
| U.S. Average: | 221.2 |
Violent crime rate in 2017
| Cincinnati: | 566.5 |
| U.S. Average: | 226.2 |
Violent crime rate in 2016
| Cincinnati: | 541.2 |
| U.S. Average: | 227.3 |
Violent crime rate in 2015
| Cincinnati: | 543.4 |
| U.S. Average: | 219.3 |
Violent crime rate in 2014
| Cincinnati: | 528.6 |
| U.S. Average: | 211.1 |
Violent crime rate in 2013
| Cincinnati: | 554.1 |
| U.S. Average: | 214.2 |
Violent crime rate in 2012
| Cincinnati: | 547.4 |
| U.S. Average: | 187.4 |
Violent crime rate in 2011
| Cincinnati: | 580.3 |
| U.S. Average: | 187.1 |
Violent crime rate in 2010
| Cincinnati: | 682.8 |
| U.S. Average: | 195.7 |
Violent crime rate in 2009
| Cincinnati: | 657.9 |
| U.S. Average: | 208.9 |
Violent crime rate in 2008
| Cincinnati: | 708.8 |
| U.S. Average: | 222.5 |
Violent crime rate in 2007
| Cincinnati: | 467.8 |
| U.S. Average: | 229.1 |
Violent crime rate in 2006
| Cincinnati: | 533.0 |
| U.S. Average: | 232.6 |
Violent crime rate in 2005
| Cincinnati: | 519.5 |
| U.S. Average: | 227.0 |
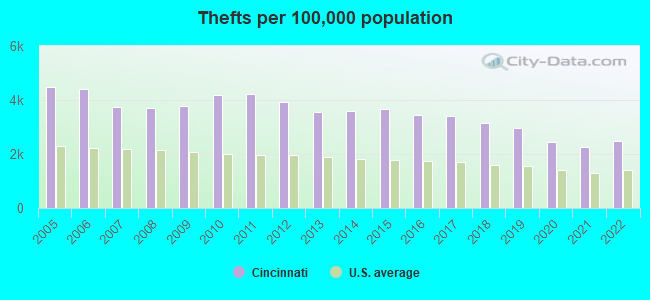
Property crime rate in 2022
| Cincinnati: | 344.4 |
| U.S. Average: | 166.5 |
Property crime rate in 2021
| Cincinnati: | 300.5 |
| U.S. Average: | 157.8 |
Property crime rate in 2020
| Cincinnati: | 349.3 |
| U.S. Average: | 169.6 |
Property crime rate in 2019
| Cincinnati: | 397.6 |
| U.S. Average: | 179.7 |
Property crime rate in 2018
| Cincinnati: | 420.5 |
| U.S. Average: | 190.2 |
Property crime rate in 2017
| Cincinnati: | 476.6 |
| U.S. Average: | 206.4 |
Property crime rate in 2016
| Cincinnati: | 496.9 |
| U.S. Average: | 216.6 |
Property crime rate in 2015
| Cincinnati: | 538.3 |
| U.S. Average: | 221.5 |
Property crime rate in 2014
| Cincinnati: | 561.3 |
| U.S. Average: | 230.8 |
Property crime rate in 2013
| Cincinnati: | 612.3 |
| U.S. Average: | 250.4 |
Property crime rate in 2012
| Cincinnati: | 624.5 |
| U.S. Average: | 267.3 |
Property crime rate in 2011
| Cincinnati: | 726.6 |
| U.S. Average: | 273.5 |
Property crime rate in 2010
| Cincinnati: | 730.5 |
| U.S. Average: | 276.4 |
Property crime rate in 2009
| Cincinnati: | 635.7 |
| U.S. Average: | 285.6 |
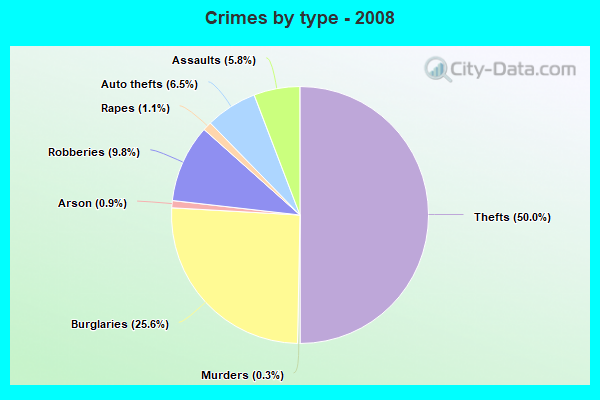
Property crime rate in 2008
| Cincinnati: | 639.7 |
| U.S. Average: | 302.2 |
Property crime rate in 2007
| Cincinnati: | 493.5 |
| U.S. Average: | 309.2 |
Property crime rate in 2006
| Cincinnati: | 557.8 |
| U.S. Average: | 317.3 |
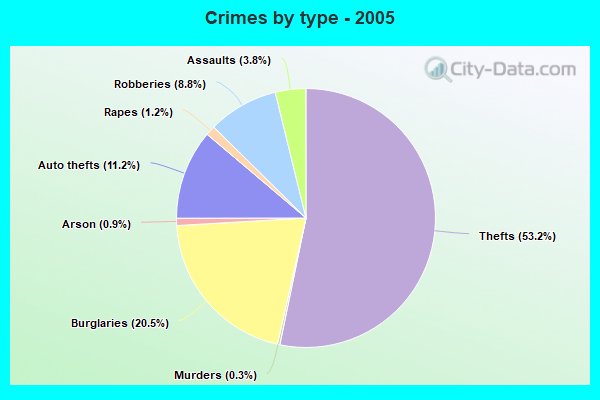
Property crime rate in 2005
| Cincinnati: | 539.8 |
| U.S. Average: | 322.3 |
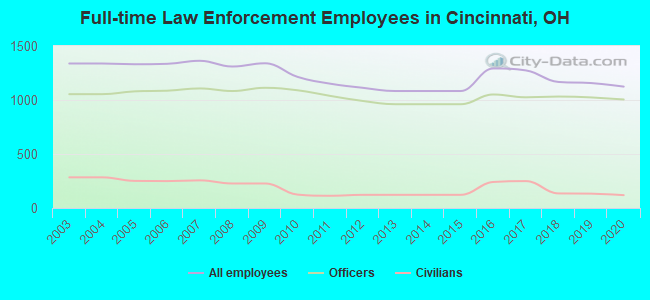
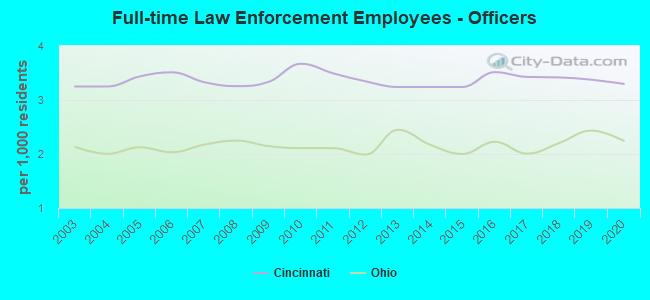
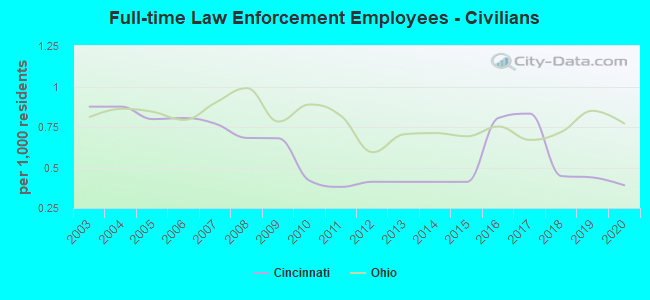
Full-time law enforcement employees in 2020, including police officers: 1,124 (1,005 officers - 773 male; 232 female).
| Officers per 1,000 residents here: | 3.30 |
| Ohio average: | 2.24 |
Full-time law enforcement employees in 2019, including police officers: 1,157 (1,024 officers - 792 male; 232 female).
| Officers per 1,000 residents here: | 3.38 |
| Ohio average: | 2.43 |
Full-time law enforcement employees in 2018, including police officers: 1,167 (1,032 officers - 799 male; 233 female).
| Officers per 1,000 residents here: | 3.42 |
| Ohio average: | 2.20 |
Full-time law enforcement employees in 2017, including police officers: 1,274 (1,025 officers - 796 male; 229 female).
| Officers per 1,000 residents here: | 3.43 |
| Ohio average: | 2.01 |
Full-time law enforcement employees in 2016, including police officers: 1,292 (1,051 officers - 817 male; 234 female).
| Officers per 1,000 residents here: | 3.52 |
| Ohio average: | 2.23 |
Full-time law enforcement employees in 2013, including police officers: 1,083 (961 officers - 740 male; 221 female).
| Officers per 1,000 residents here: | 3.24 |
| Ohio average: | 2.45 |
Full-time law enforcement employees in 2012, including police officers: 1,113 (991 officers - 763 male; 228 female).
| Officers per 1,000 residents here: | 3.35 |
| Ohio average: | 1.99 |
Full-time law enforcement employees in 2011, including police officers: 1,151 (1,038 officers - 803 male; 235 female).
| Officers per 1,000 residents here: | 3.49 |
| Ohio average: | 2.11 |
Full-time law enforcement employees in 2010, including police officers: 1,214 (1,090 officers - 845 male; 245 female).
| Officers per 1,000 residents here: | 3.67 |
| Ohio average: | 2.11 |
Full-time law enforcement employees in 2009, including police officers: 1,340 (1,113 officers - 862 male; 251 female).
| Officers per 1,000 residents here: | 3.34 |
| Ohio average: | 2.15 |
Full-time law enforcement employees in 2008, including police officers: 1,310 (1,083 officers - 845 male; 238 female).
| Officers per 1,000 residents here: | 3.26 |
| Ohio average: | 2.25 |
Full-time law enforcement employees in 2007, including police officers: 1,363 (1,107 officers - 865 male; 242 female).
| Officers per 1,000 residents here: | 3.33 |
| Ohio average: | 2.17 |
Full-time law enforcement employees in 2006, including police officers: 1,335 (1,086 officers - 849 male; 237 female).
| Officers per 1,000 residents here: | 3.51 |
| Ohio average: | 2.03 |
Full-time law enforcement employees in 2005, including police officers: 1,331 (1,080 officers - 846 male; 234 female).
| Officers per 1,000 residents here: | 3.44 |
| Ohio average: | 2.12 |
Full-time law enforcement employees in 2003, including police officers: 1,338 (1,054 officers - 827 male; 227 female).
| Officers per 1,000 residents here: | 3.25 |
| Ohio average: | 2.13 |


Zip codes: 45202, 45203, 45204, 45205, 45206, 45207, 45208, 45209, 45212, 45214, 45216, 45217, 45219, 45220, 45223, 45224, 45225, 45226, 45227, 45229, 45230, 45231, 45232, 45239, 45243.