Crime rate in Chicago, Illinois (IL): murders, rapes, robberies, assaults, burglaries, thefts, auto thefts, arson, law enforcement employees, police officers, crime map
Crime rate in Chicago, IL
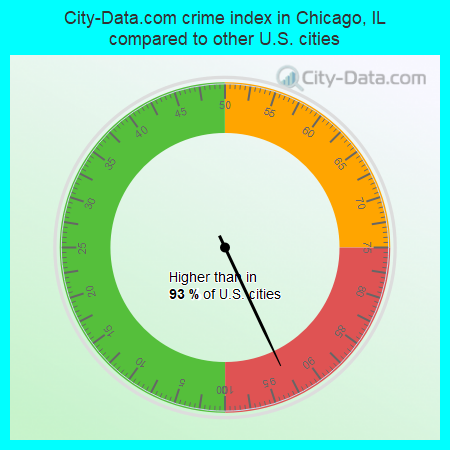
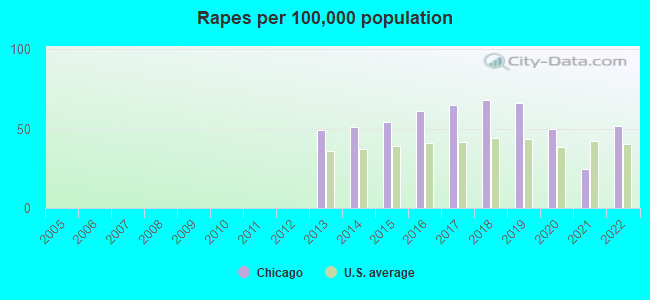
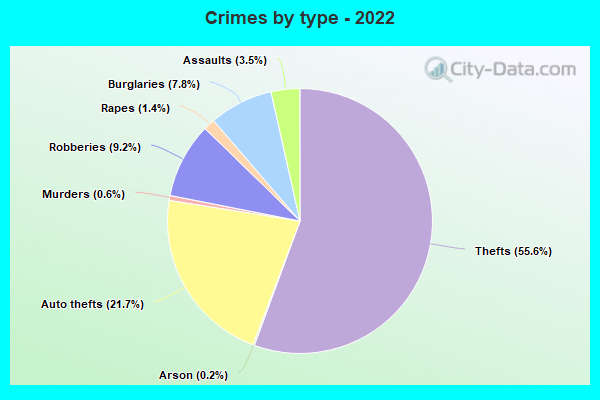
The 2022 crime rate in Chicago, IL is 380 (City-Data.com crime index), which is 1.5 times greater than the U.S. average. It was higher than in 93.0% U.S. cities. The 2022 Chicago crime rate rose by 121% compared to 2021. The number of homicides stood at 604 - an increase of 234 compared to 2021. In the last 5 years Chicago has seen decreasing violent crime and increasing property crime.(Note: Higher means more crime)
| Chicago: | 379.7 |
| Cicero: | 157.0 |
| Berwyn: | 71.9 |
| Stickney: | 60.7 |
| Forest View: | 346.7 |
| Oak Park: | 279.4 |
| Riverside: | 117.8 |
| Forest Park: | 331.7 |
| Bedford Park: | 2,387.8 |
The City-Data.com crime index weighs serious crimes and violent crimes more heavily. Higher means more crime, U.S. average is 246.1. It adjusts for the number of visitors and daily workers commuting into cities.
- means the value is smaller than the state average.- means the value is about the same as the state average.
- means the value is bigger than the state average.
- means the value is much bigger than the state average.
According to our research of Illinois and other state lists, there were 3,409 registered sex offenders living in Chicago, Illinois as of May 08, 2024.
The ratio of all residents to sex offenders in Chicago is 793 to 1.
The ratio of registered sex offenders to all residents in this city is near the state average.
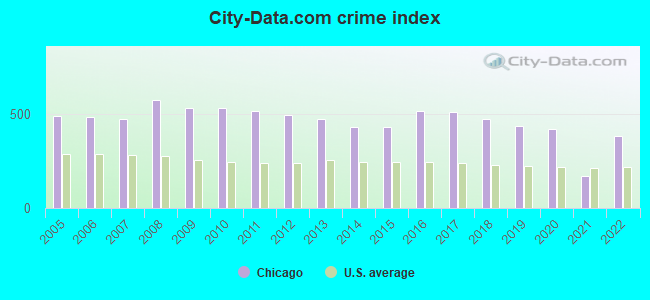
Violent crime rate in 2022
| Chicago: | 330.1 |
| U.S. Average: | 219.8 |
Violent crime rate in 2021
| Chicago: | 175.4 |
| U.S. Average: | 224.8 |
Violent crime rate in 2020
| Chicago: | 561.4 |
| U.S. Average: | 228.2 |
Violent crime rate in 2019
| Chicago: | 532.4 |
| U.S. Average: | 219.9 |
Violent crime rate in 2018
| Chicago: | 569.6 |
| U.S. Average: | 221.2 |
Violent crime rate in 2017
| Chicago: | 618.2 |
| U.S. Average: | 226.2 |
Violent crime rate in 2016
| Chicago: | 626.7 |
| U.S. Average: | 227.3 |
Violent crime rate in 2015
| Chicago: | 506.2 |
| U.S. Average: | 219.3 |
Violent crime rate in 2014
| Chicago: | 491.3 |
| U.S. Average: | 211.1 |
Violent crime rate in 2013
| Chicago: | 519.6 |
| U.S. Average: | 214.2 |
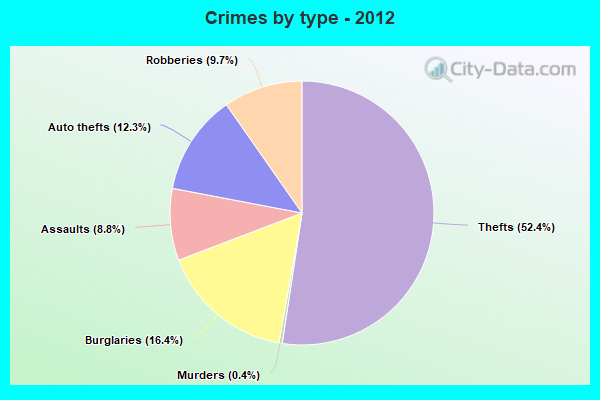
Violent crime rate in 2012
| Chicago: | 512.3 |
| U.S. Average: | 187.4 |
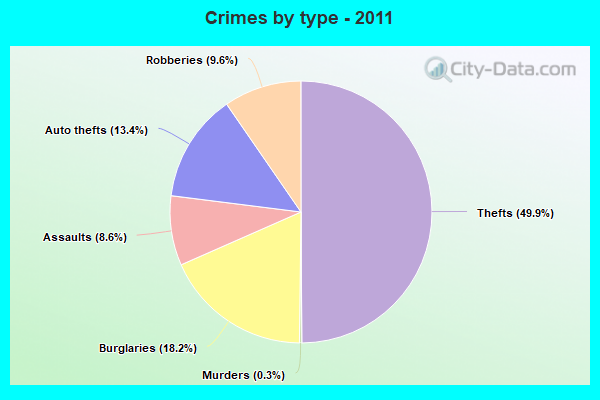
Violent crime rate in 2011
| Chicago: | 519.8 |
| U.S. Average: | 187.1 |
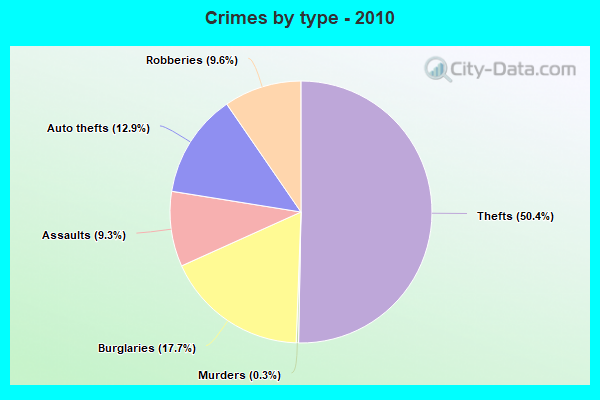
Violent crime rate in 2010
| Chicago: | 550.9 |
| U.S. Average: | 195.7 |
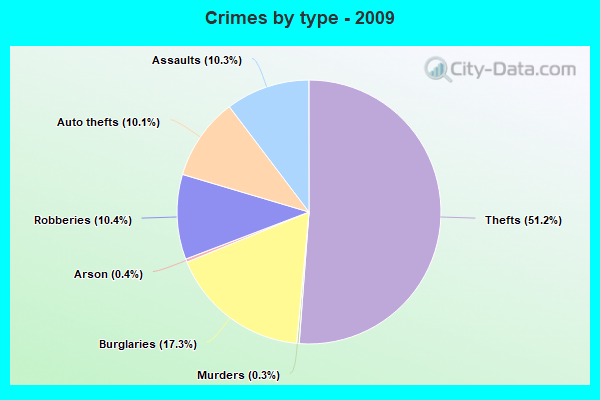
Violent crime rate in 2009
| Chicago: | 586.9 |
| U.S. Average: | 208.9 |
Violent crime rate in 2008
| Chicago: | 631.3 |
| U.S. Average: | 222.5 |
Violent crime rate in 2007
| Chicago: | 527.3 |
| U.S. Average: | 229.1 |
Violent crime rate in 2006
| Chicago: | 529.6 |
| U.S. Average: | 232.6 |
Violent crime rate in 2005
| Chicago: | 534.5 |
| U.S. Average: | 227.0 |
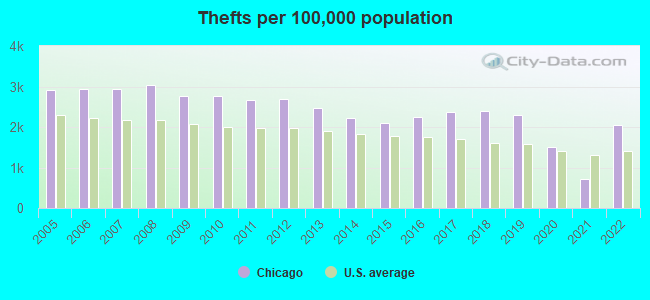
Property crime rate in 2022
| Chicago: | 279.7 |
| U.S. Average: | 166.5 |
Property crime rate in 2021
| Chicago: | 102.6 |
| U.S. Average: | 157.8 |
Property crime rate in 2020
| Chicago: | 196.0 |
| U.S. Average: | 169.6 |
Property crime rate in 2019
| Chicago: | 236.5 |
| U.S. Average: | 179.7 |
Property crime rate in 2018
| Chicago: | 261.5 |
| U.S. Average: | 190.2 |
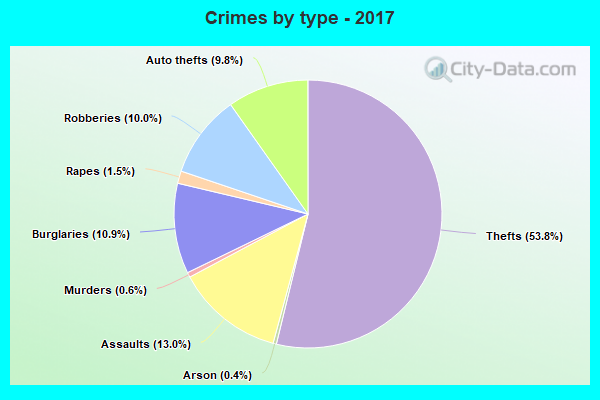
Property crime rate in 2017
| Chicago: | 277.5 |
| U.S. Average: | 206.4 |
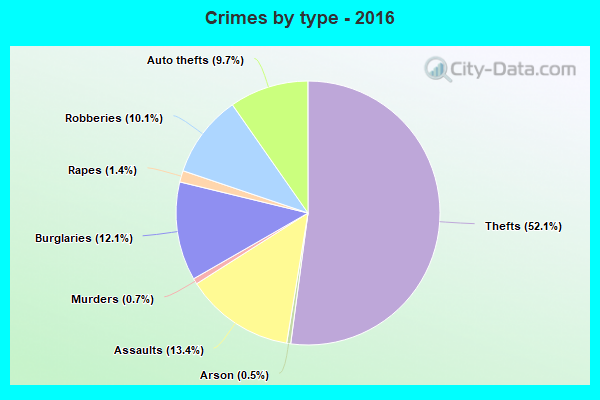
Property crime rate in 2016
| Chicago: | 280.4 |
| U.S. Average: | 216.6 |
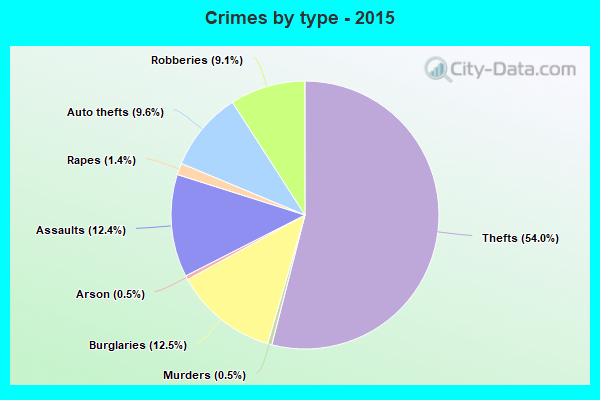
Property crime rate in 2015
| Chicago: | 257.3 |
| U.S. Average: | 221.5 |
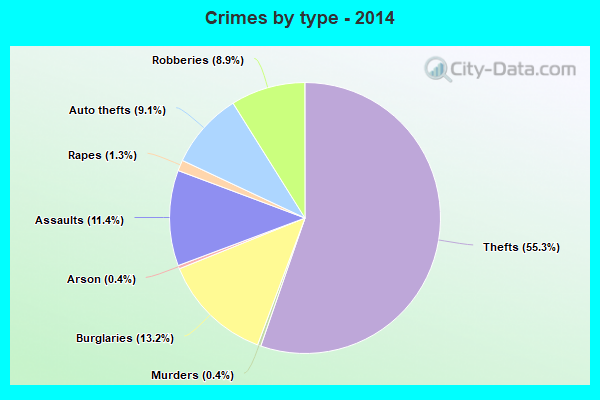
Property crime rate in 2014
| Chicago: | 273.5 |
| U.S. Average: | 230.8 |
Property crime rate in 2013
| Chicago: | 324.3 |
| U.S. Average: | 250.4 |
Property crime rate in 2012
| Chicago: | 396.4 |
| U.S. Average: | 267.3 |
Property crime rate in 2011
| Chicago: | 437.2 |
| U.S. Average: | 273.5 |
Property crime rate in 2010
| Chicago: | 439.3 |
| U.S. Average: | 276.4 |
Property crime rate in 2009
| Chicago: | 405.2 |
| U.S. Average: | 285.6 |
Property crime rate in 2008
| Chicago: | 436.7 |
| U.S. Average: | 302.2 |
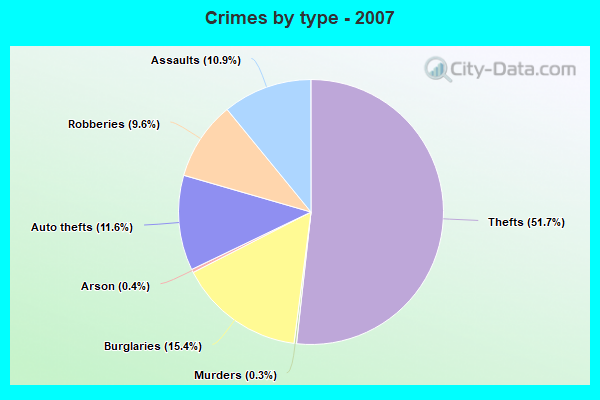
Property crime rate in 2007
| Chicago: | 362.2 |
| U.S. Average: | 309.2 |
Property crime rate in 2006
| Chicago: | 370.1 |
| U.S. Average: | 317.3 |
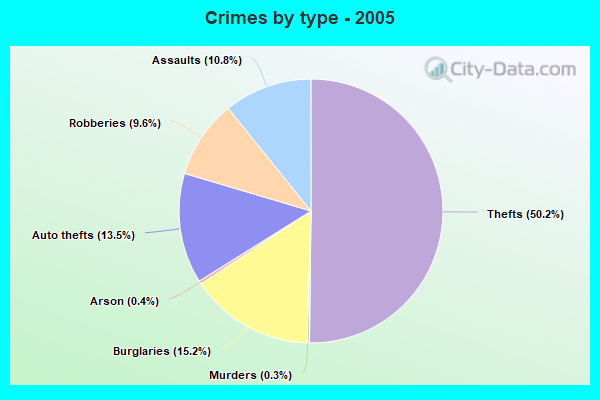
Property crime rate in 2005
| Chicago: | 377.5 |
| U.S. Average: | 322.3 |
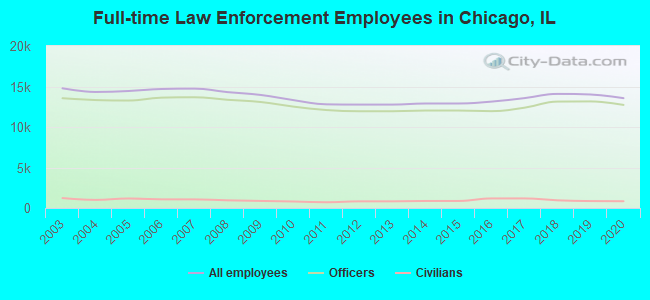
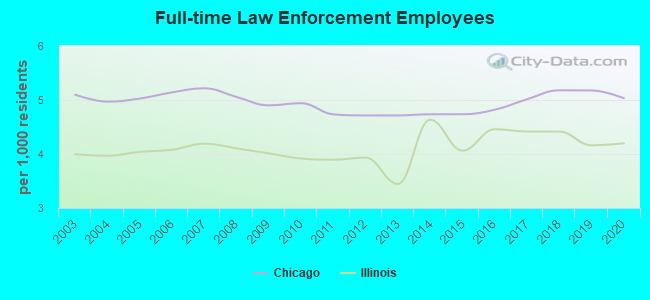
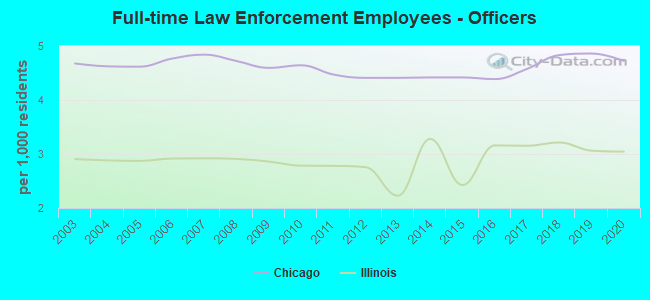
Full-time law enforcement employees in 2020, including police officers: 13,562 (12,727 officers - 9,770 male; 2,957 female).
| Officers per 1,000 residents here: | 4.72 |
| Illinois average: | 3.04 |
Full-time law enforcement employees in 2019, including police officers: 14,015 (13,160 officers - 10,122 male; 3,038 female).
| Officers per 1,000 residents here: | 4.86 |
| Illinois average: | 3.06 |
Full-time law enforcement employees in 2018, including police officers: 14,086 (13,138 officers - 10,154 male; 2,984 female).
| Officers per 1,000 residents here: | 4.83 |
| Illinois average: | 3.21 |
Full-time law enforcement employees in 2017, including police officers: 13,566 (12,383 officers - 9,615 male; 2,768 female).
| Officers per 1,000 residents here: | 4.58 |
| Illinois average: | 3.15 |
Full-time law enforcement employees in 2016, including police officers: 13,135 (11,954 officers - 9,309 male; 2,645 female).
| Officers per 1,000 residents here: | 4.39 |
| Illinois average: | 3.16 |
Full-time law enforcement employees in 2014, including police officers: 12,902 (12,034 officers - 9,326 male; 2,708 female).
| Officers per 1,000 residents here: | 4.42 |
| Illinois average: | 3.28 |
Full-time law enforcement employees in 2012, including police officers: 12,766 (11,944 officers - 9,166 male; 2,778 female).
| Officers per 1,000 residents here: | 4.41 |
| Illinois average: | 2.76 |
Full-time law enforcement employees in 2011, including police officers: 12,799 (12,092 officers - 9,206 male; 2,886 female).
| Officers per 1,000 residents here: | 4.47 |
| Illinois average: | 2.78 |
Full-time law enforcement employees in 2010, including police officers: 13,318 (12,515 officers - 9,517 male; 2,998 female).
| Officers per 1,000 residents here: | 4.64 |
| Illinois average: | 2.78 |
Full-time law enforcement employees in 2009, including police officers: 13,960 (13,088 officers - 9,947 male; 3,141 female).
| Officers per 1,000 residents here: | 4.59 |
| Illinois average: | 2.86 |
Full-time law enforcement employees in 2008, including police officers: 14,307 (13,359 officers - 10,157 male; 3,202 female).
| Officers per 1,000 residents here: | 4.72 |
| Illinois average: | 2.91 |
Full-time law enforcement employees in 2007, including police officers: 14,736 (13,671 officers - 10,420 male; 3,251 female).
| Officers per 1,000 residents here: | 4.84 |
| Illinois average: | 2.92 |
Full-time law enforcement employees in 2006, including police officers: 14,692 (13,624 officers - 10,390 male; 3,234 female).
| Officers per 1,000 residents here: | 4.77 |
| Illinois average: | 2.92 |
Full-time law enforcement employees in 2005, including police officers: 14,442 (13,267 officers - 10,128 male; 3,139 female).
| Officers per 1,000 residents here: | 4.62 |
| Illinois average: | 2.87 |
Full-time law enforcement employees in 2004, including police officers: 14,325 (13,326 officers - 10,192 male; 3,134 female).
| Officers per 1,000 residents here: | 4.62 |
| Illinois average: | 2.88 |
Full-time law enforcement employees in 2003, including police officers: 14,777 (13,553 officers - 10,448 male; 3,105 female).
| Officers per 1,000 residents here: | 4.68 |
| Illinois average: | 2.90 |


Zip codes: 60018, 60068, 60176, 60601, 60602, 60603, 60604, 60605, 60606, 60607, 60608, 60609, 60610, 60611, 60612, 60613, 60614, 60615, 60616, 60617, 60618, 60619, 60620, 60621, 60622, 60623, 60624, 60625, 60626, 60628, 60630, 60631, 60632, 60634, 60636, 60637, 60639, 60640, 60641, 60642, 60643, 60644, 60645, 60646, 60647, 60649, 60651, 60652, 60653, 60654, 60655, 60656, 60657, 60659, 60660, 60661, 60706, 60707, 60714.