Union County, Tennessee (TN)
County owner-occupied free and clear houses and condos in 2010: 2,578
County owner-occupied houses and condos in 2000: 5,452
Renter-occupied apartments: 1,646 (it was 1,290 in 2000)
| % of renters here: | 19% |
| State: | 32% |
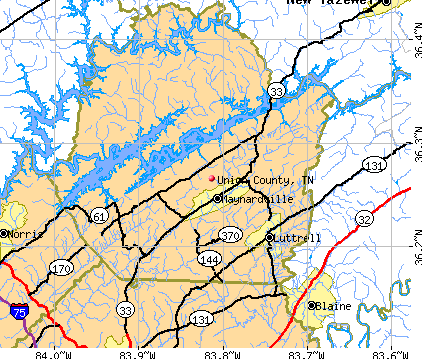
Land area: 224 sq. mi.
Water area: 23.6 sq. mi.
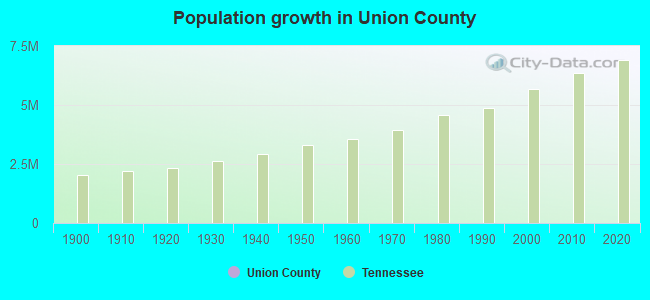
Population density: 90 people per square mile (average).
Industries providing employment: Educational, health and social services (20.2%), Construction (15.5%), Manufacturing (12.6%), Professional, scientific, management, administrative, and waste management services (12.4%), Retail trade (11.0%).
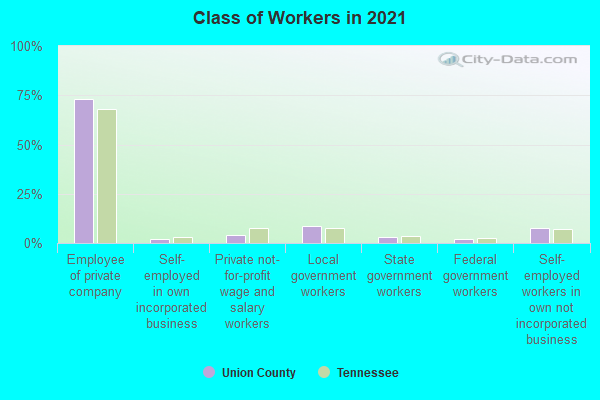
Type of workers:
- Private wage or salary: 78%
- Government: 13%
- Self-employed, not incorporated: 9%
- Unpaid family work: 0%
- OSM Map
- General Map
- Google Map
- MSN Map

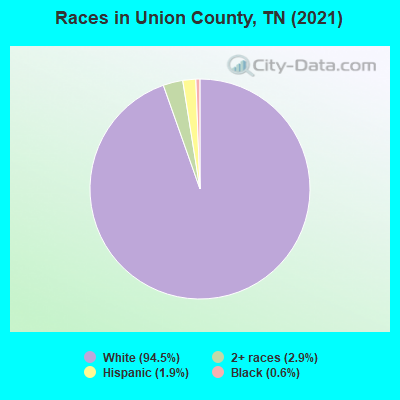
- 19,05494.3%White Non-Hispanic Alone
- 6043.0%Two or more races
- 4222.1%Hispanic or Latino
- 1060.5%Black Non-Hispanic Alone
- 200.10%Some other race alone
- 50.02%Asian alone
| Median resident age: | 42.9 years |
| Tennessee median age: | 39.2 years |
| Males: 10,058 | |
| Females: 10,167 |

 | Restaurants in the Cookeville Area (1030 replies) |
| Does this exist in TN anywhere- a little desperate for help (21 replies) |
| COVID-19 in Tennessee (237 replies) |
| Areas with in 1-2 hours of Knoxville (28 replies) |
| Rural Living/ Nice areas around Knoxville? (3 replies) |
| Tennessee Population Estimates 2016 (28 replies) |
| Union County: | 2.0 people |
| Tennessee: | 2 people |
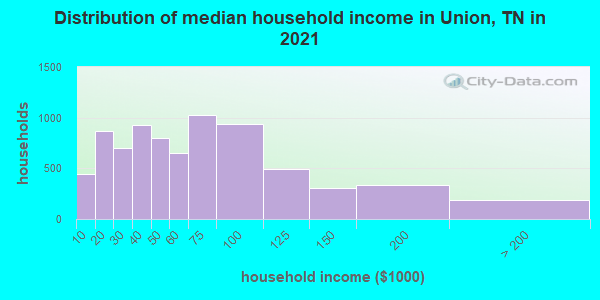
Estimated median household income in 2022: $58,180 ($27,335 in 1999)
| This county: | $58,180 |
| Tennessee: | $65,254 |
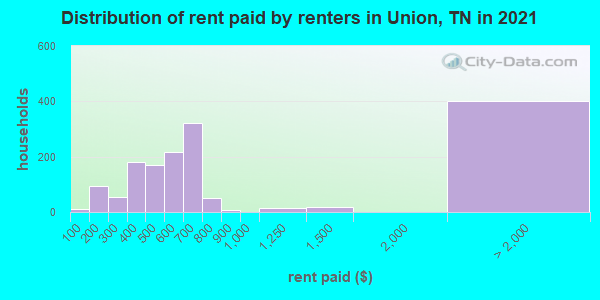
Median contract rent in 2022 for apartments: $608 (lower quartile is $449, upper quartile is $767)
| This county: | $608 |
| State: | $884 |
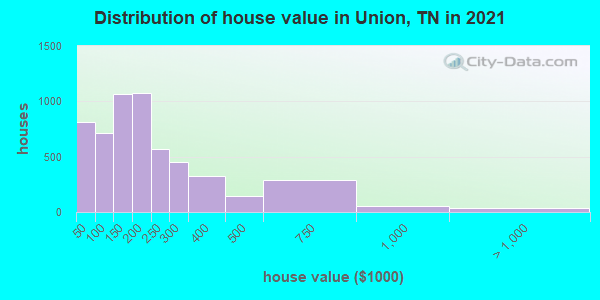
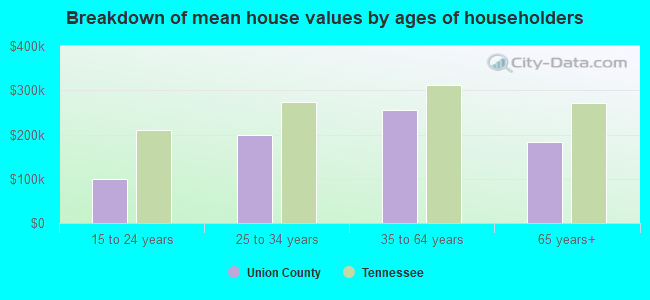
Estimated median house or condo value in 2022: $201,728 (it was $65,600 in 2000)
| Union: | $201,728 |
| Tennessee: | $284,800 |
Mean price in 2022:
Median monthly housing costs for homes and condos with a mortgage: $1,144Detached houses: $287,877
Here: $287,877 State: $374,382 Townhouses or other attached units: $155,468
Here: $155,468 State: $354,101 Mobile homes: $89,698
Here: $89,698 State: $101,421
Median monthly housing costs for units without a mortgage: $340
Institutionalized population: 145
Crime in 2021 (reported by the sheriff's office or county police, not the county total):
- Murders: 1
- Rapes: 2
- Robberies: 0
- Assaults: 29
- Burglaries: 58
- Thefts: 108
- Auto thefts: 26
Crime in 2020 (reported by the sheriff's office or county police, not the county total):
- Murders: 1
- Rapes: 4
- Robberies: 3
- Assaults: 34
- Burglaries: 51
- Thefts: 98
- Auto thefts: 32
Health of residents in Union County based on CDC Behavioral Risk Factor Surveillance System Survey Questionnaires from 2013 to 2021:
General health status score of residents in this county from 1 (poor) to 5 (excellent) is 3.3. This is worse than average.69.1% of residents exercised in the past month. This is less than average.
48.0% of residents smoked 100+ cigarettes in their lives. This is about average.
43.4% of adult residents drank alcohol in the past 30 days. This is less than average.
62.9% of residents visited a dentist within the past year. This is less than average.
Average weight of males is 203 pounds. This is more than average.
Average weight of females is 165 pounds. This is about average.
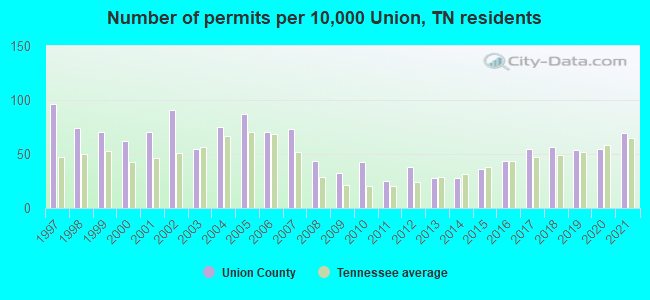
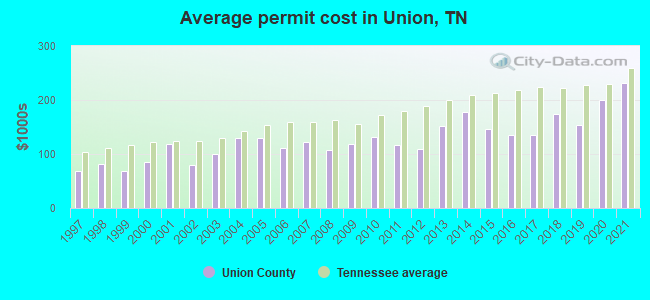
Single-family new house construction building permits:
- 2022: 117 buildings, average cost: $310,100
- 2021: 123 buildings, average cost: $231,600
- 2020: 97 buildings, average cost: $199,900
- 2019: 96 buildings, average cost: $153,400
- 2018: 100 buildings, average cost: $173,700
- 2017: 97 buildings, average cost: $135,800
- 2016: 78 buildings, average cost: $134,700
- 2015: 64 buildings, average cost: $146,500
- 2014: 50 buildings, average cost: $178,100
- 2013: 49 buildings, average cost: $152,200
- 2012: 67 buildings, average cost: $109,400
- 2011: 45 buildings, average cost: $115,600
- 2010: 76 buildings, average cost: $130,900
- 2009: 58 buildings, average cost: $117,800
- 2008: 78 buildings, average cost: $107,900
- 2007: 131 buildings, average cost: $121,700
- 2006: 125 buildings, average cost: $112,200
- 2005: 155 buildings, average cost: $130,100
- 2004: 133 buildings, average cost: $130,200
- 2003: 97 buildings, average cost: $99,500
- 2002: 162 buildings, average cost: $79,000
- 2001: 126 buildings, average cost: $117,500
- 2000: 111 buildings, average cost: $84,700
- 1999: 125 buildings, average cost: $68,800
- 1998: 132 buildings, average cost: $80,600
- 1997: 172 buildings, average cost: $67,700
Median real estate property taxes paid for housing units with mortgages in 2022: $742 (0.4%)
Median real estate property taxes paid for housing units with no mortgage in 2022: $689 (0.4%)
| Union County: | 15.1% |
| Tennessee: | 13.3% |
Median age of residents in 2022: 42.9 years old
(Males: 42.4 years old, Females: 43.1 years old)
(Median age for: White residents: 43.3 years old, Black residents: 28.6 years old, Hispanic or Latino residents: 20.9 years old, Other race residents: 7.1 years old)
Area name: Knoxville, TN MSA
Fair market rent in 2006 for a 1-bedroom apartment in Union County is $472 a month.
Fair market rent for a 2-bedroom apartment is $569 a month.
Fair market rent for a 3-bedroom apartment is $762 a month.
Cities in this county include: Sharps Chapel, Plainview, Maynardville, Luttrell.
Neighboring counties: Harding County, New Mexico  , Santa Fe County, New Mexico , Major County, Oklahoma , Macon County , Patrick County, Virginia
  .
.
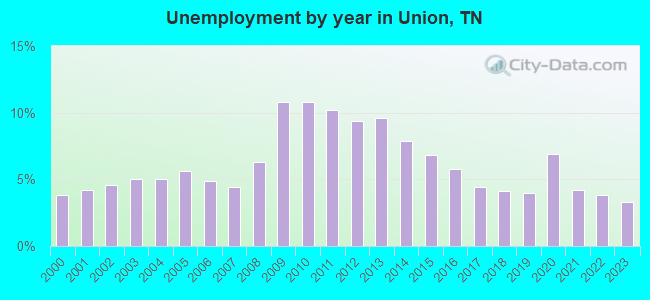
| Here: | 3.3% |
| Tennessee: | 3.0% |
Current college students: 379
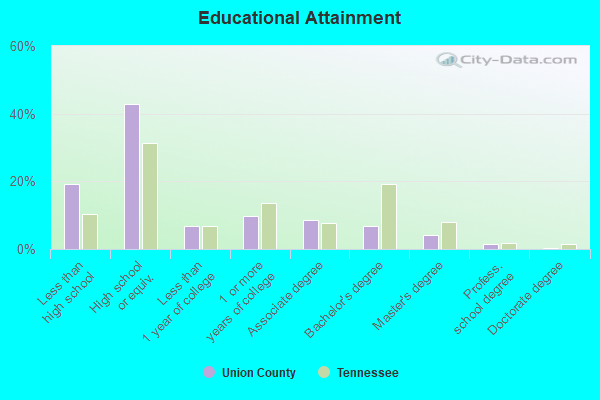
People 25 years of age or older with a high school degree or higher: 80.4%
People 25 years of age or older with a bachelor's degree or higher: 13.1%
Number of foreign born residents: 84 (68.5% naturalized citizens)
| Union County: | 0.4% |
| Whole state: | 5.6% |
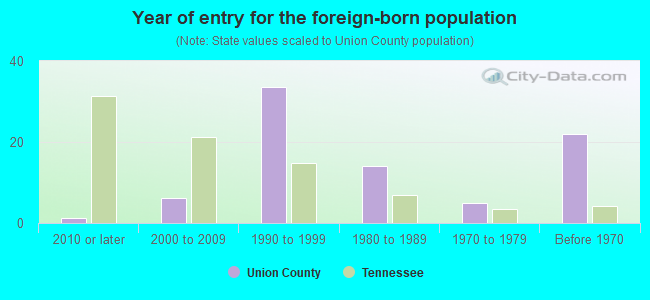
- Year of entry for the foreign-born population
- 12010 or later
- 112000 to 2009
- 341990 to 1999
- 141980 to 1989
- 51970 to 1979
- 22Before 1970
Mean travel time to work (commute): minutes
Percentage of county residents living and working in this county: 98.1%
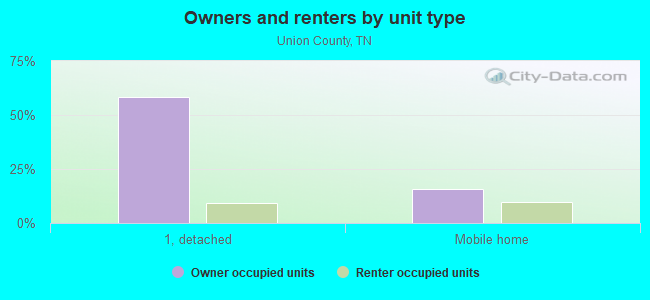
Housing units in structures:
- One, detached: 7,068
- One, attached: 145
- Two: 36
- 3 or 4: 14
- 5 to 9: 151
- 10 to 19: 86
- Mobile homes: 2,287
- Boats, RVs, vans, etc.: 23
Housing units in Union County with a mortgage: 3,262 (137 second mortgage, 0 home equity loan, 117 both second mortgage and home equity loan)
Houses without a mortgage: 35
| Here: | 7.9% with mortgage |
| State: | 97.8% with mortgage |
Religion statistics for Union County
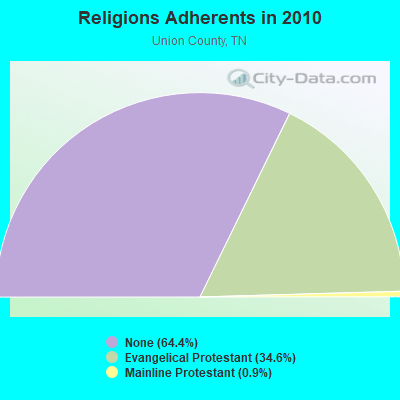
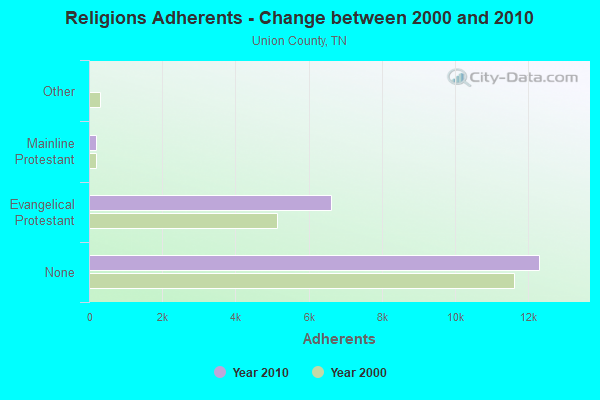
| Religion | Adherents | Congregations |
|---|---|---|
| Evangelical Protestant | 6,616 | 24 |
| Mainline Protestant | 181 | 3 |
| Other | 3 | - |
| None | 12,309 | - |
Source: Clifford Grammich, Kirk Hadaway, Richard Houseal, Dale E.Jones, Alexei Krindatch, Richie Stanley and Richard H.Taylor. 2012. 2010 U.S.Religion Census: Religious Congregations & Membership Study. Association of Statisticians of American Religious Bodies. Jones, Dale E., et al. 2002. Congregations and Membership in the United States 2000. Nashville, TN: Glenmary Research Center.
Food Environment Statistics:
| Union County: | 1.06 / 10,000 pop. |
| State: | 1.99 / 10,000 pop. |
| This county: | 0.53 / 10,000 pop. |
| Tennessee: | 0.65 / 10,000 pop. |
| Union County: | 4.78 / 10,000 pop. |
| Tennessee: | 5.16 / 10,000 pop. |
| This county: | 2.65 / 10,000 pop. |
| State: | 6.56 / 10,000 pop. |
| Union County: | 10.5% |
| Tennessee: | 11.4% |
| Union County: | 27.5% |
| State: | 30.2% |
| Here: | 12.6% |
| State: | 13.5% |
Agriculture in Union County:
Average size of farms: 82 acresAverage value of agricultural products sold per farm: $5,013
Average value of crops sold per acre for harvested cropland: $109.06
The value of nursery, greenhouse, floriculture, and sod as a percentage of the total market value of agricultural products sold: 0.75%
The value of livestock, poultry, and their products as a percentage of the total market value of agricultural products sold: 60.79%
Average total farm production expenses per farm: $5,449
Harvested cropland as a percentage of land in farms: 21.98%
Irrigated harvested cropland as a percentage of land in farms: 0.10%
Average market value of all machinery and equipment per farm: $27,867
The percentage of farms operated by a family or individual: 96.07%
Average age of principal farm operators: 55 years
Average number of cattle and calves per 100 acres of all land in farms: 20.99
Milk cows as a percentage of all cattle and calves: 0.66%
Corn for grain: 65 harvested acres
Vegetables: 10 harvested acres
Land in orchards: 16 acres
Earthquake activity:
Union County-area historical earthquake activity is significantly above Tennessee state average. It is 72% greater than the overall U.S. average.On 7/27/1980 at 18:52:21, a magnitude 5.2 (5.1 MB, 4.7 MS, 5.0 UK, 5.2 UK, Class: Moderate, Intensity: VI - VII) earthquake occurred 134.4 miles away from Union County center
On 11/30/1973 at 07:48:41, a magnitude 4.7 (4.7 MB, 4.6 ML, Class: Light, Intensity: IV - V) earthquake occurred 33.3 miles away from the county center
On 8/9/2020 at 12:07:37, a magnitude 5.1 (5.1 MW, Depth: 4.7 mi) earthquake occurred 152.2 miles away from the county center
On 4/29/2003 at 08:59:39, a magnitude 4.9 (4.4 MB, 4.6 MW, 4.9 LG) earthquake occurred 159.6 miles away from the county center
On 12/12/2018 at 09:14:43, a magnitude 4.4 (4.4 MW, Depth: 4.9 mi) earthquake occurred 68.4 miles away from Union County center
On 8/23/2011 at 17:51:04, a magnitude 5.8 (5.8 MW, Depth: 3.7 mi) earthquake occurred 343.6 miles away from the county center
Magnitude types: regional Lg-wave magnitude (LG), body-wave magnitude (MB), local magnitude (ML), surface-wave magnitude (MS), moment magnitude (MW)
Most recent natural disasters:
- Tennessee Covid-19 Pandemic, Incident Period: January 20, 2020, FEMA Id: 4514, Natural disaster type: Other
- Tennessee Severe Storms, Flooding, Landslides, And Mudslides, Incident Period: February 19, 2019 - March 30, 2019, FEMA Id: 4427, Natural disaster type: Storm, Mudslide, Landslide, Flood
- Tennessee Severe Storms, Tornadoes, and Flooding, Incident Period: February 28, 2011 to March 01, 2011, Major Disaster (Presidential) Declared DR-1965: March 31, 2011, FEMA Id: 1965, Natural disaster type: Storm, Tornado, Flood
- Tennessee Hurricane Katrina Evacuation, Incident Period: August 29, 2005 to October 01, 2005, Emergency Declared EM-3217: September 05, 2005, FEMA Id: 3217, Natural disaster type: Hurricane
- Tennessee Severe Storms and Flooding, Incident Period: February 14, 2003 to February 26, 2003, Major Disaster (Presidential) Declared DR-1456: March 20, 2003, FEMA Id: 1456, Natural disaster type: Storm, Flood
- Tennessee Winter Storm, Incident Period: December 23, 1998 to December 29, 1998, Major Disaster (Presidential) Declared DR-1260: January 15, 1999, FEMA Id: 1260, Natural disaster type: Winter Storm
- Tennessee Severe Storms, Tornadoes and Flooding, Incident Period: April 16, 1998 to May 18, 1998, Major Disaster (Presidential) Declared DR-1215: April 20, 1998, FEMA Id: 1215, Natural disaster type: Storm, Tornado, Flood
- Tennessee Ice Storm, Severe Winter Storm, Flash Flooding, Incident Period: February 09, 1994 to February 11, 1994, Major Disaster (Presidential) Declared DR-1010: February 28, 1994, FEMA Id: 1010, Natural disaster type: Ice Storm, Winter Storm, Flash Flood
- Tennessee Severe Snowfall, Winter Storm, Incident Period: March 13, 1993 to March 17, 1993, Emergency Declared EM-3095: March 14, 1993, FEMA Id: 3095, Natural disaster type: Winter Storm, Snowfall
- Tennessee SEVERE STORMS, FLOODING, Incident Period: May 06, 1984 to May 11, 1984, Major Disaster (Presidential) Declared DR-708: May 25, 1984, FEMA Id: 708, Natural disaster type: Storm, Flood
- 1 other natural disasters have been reported since 1953.
The number of natural disasters in Union County (11) is smaller than the US average (15).
Major Disasters (Presidential) Declared: 7
Emergencies Declared: 2
Causes of natural disasters: Floods: 6, Storms: 5, Winter Storms: 3, Tornadoes: 2, Flash Flood: 1, Heavy Rain: 1, Hurricane: 1, Ice Storm: 1, Landslide: 1, Mudslide: 1, Snowfall: 1, Other: 1 (Note: some incidents may be assigned to more than one category).
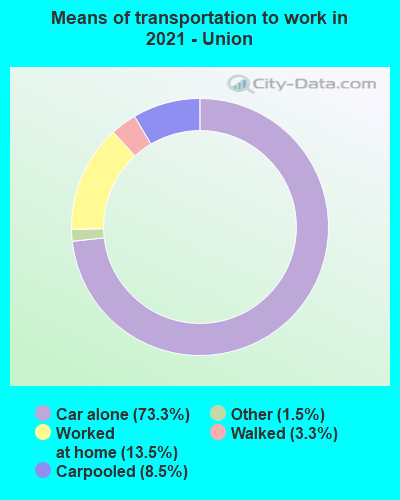
Means of transportation to work:
- Drove a car alone: 2,710 (64.7%)
- Carpooled: 370 (8.8%)
- Taxicab, motorcycle, or other means: 35 (0.8%)
- Walked: 162 (3.9%)
- Worked at home: 1,069 (25.5%)
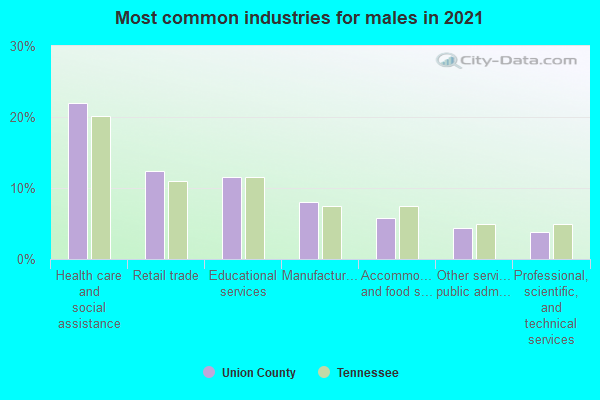
- Health care and social assistance (22%)
- Retail trade (11%)
- Educational services (10%)
- Manufacturing (6%)
- Professional, scientific, and technical services (5%)
- Other services, except public administration (5%)
- Accommodation and food services (4%)

- Health care and social assistance (28%)
- Retail trade (14%)
- Educational services (12%)
- Manufacturing (8%)
- Professional, scientific, and technical services (7%)
- Other services, except public administration (6%)
- Accommodation and food services (6%)
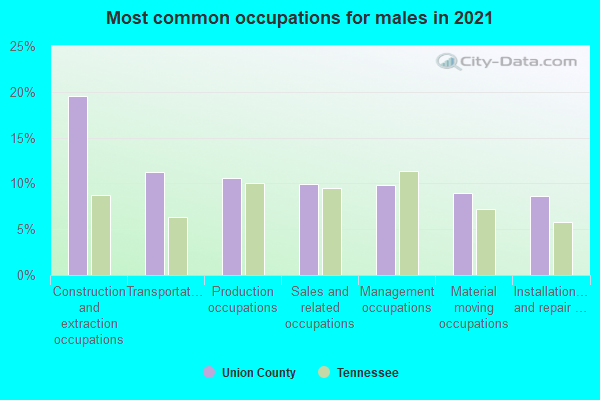
- Construction and extraction occupations (19%)
- Transportation occupations (12%)
- Management occupations (11%)
- Material moving occupations (11%)
- Production occupations (11%)
- Installation, maintenance, and repair occupations (9%)
- Sales and related occupations (7%)
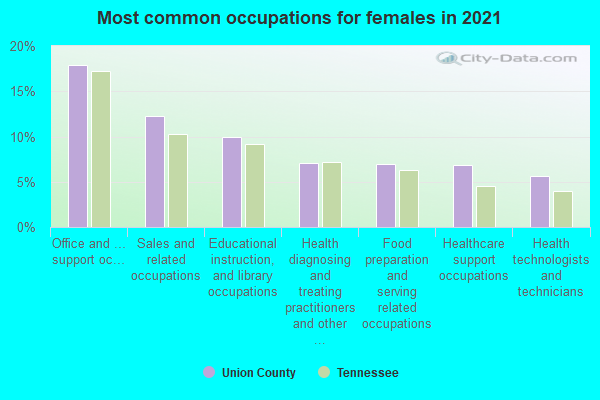
- Office and administrative support occupations (20%)
- Sales and related occupations (10%)
- Educational instruction, and library occupations (8%)
- Management occupations (8%)
- Health diagnosing and treating practitioners and other technical occupations (7%)
- Health technologists and technicians (7%)
- Healthcare support occupations (6%)
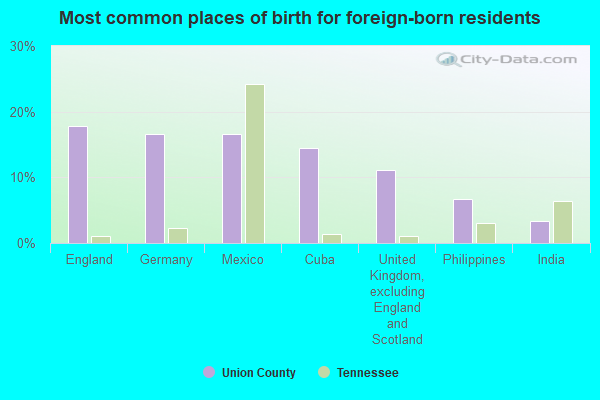
- Cuba (23%)
- England (19%)
- United Kingdom, excluding England and Scotland (17%)
- Mexico (15%)
- Philippines (14%)
- Germany (1%)
- Dominican Republic (1%)
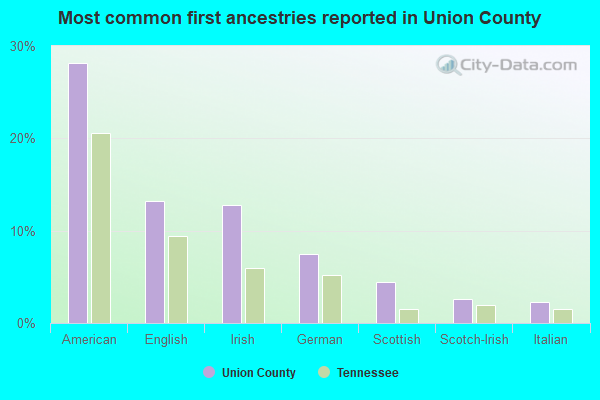
- American (28%)
- English (14%)
- Irish (12%)
- German (6%)
- Scottish (4%)
- Scotch-Irish (2%)
- Italian (2%)
People in group quarters in Union County, Tennessee in 2010:
- 74 people in nursing facilities/skilled-nursing facilities
- 71 people in local jails and other municipal confinement facilities
- 7 people in workers' group living quarters and job corps centers
People in group quarters in Union County, Tennessee in 2000:
- 93 people in nursing homes
- 27 people in local jails and other confinement facilities (including police lockups)
- 18 people in other noninstitutional group quarters
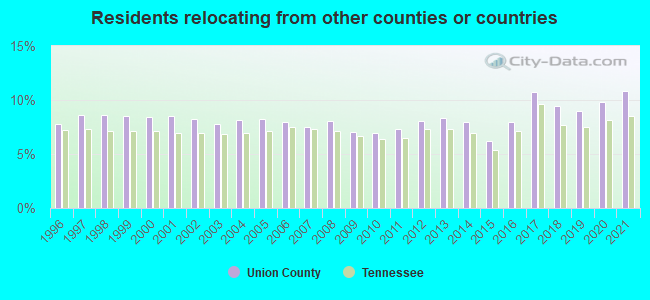
10.85% of this county's 2021 resident taxpayers lived in other counties in 2020 ($58,082 average adjusted gross income)
| Here: | 10.85% |
| Tennessee average: | 8.49% |
10 or fewer of this county's residents moved from foreign countries.
7.52% relocated from other counties in Tennessee ($32,635 average AGI)
3.34% relocated from other states ($25,449 average AGI)
Union County: 3.34% Tennessee average: 4.34%
Top counties from which taxpayers relocated into this county between 2020 and 2021:
| from Knox County, TN | |
| from Anderson County, TN | |
| from Claiborne County, TN | |
| from Grainger County, TN |
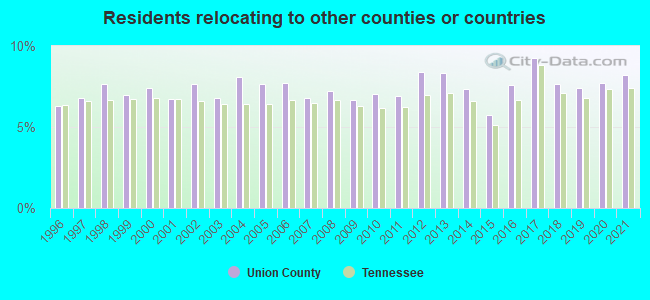
8.21% of this county's 2020 resident taxpayers moved to other counties in 2021 ($38,323 average adjusted gross income)
| Here: | 8.21% |
| Tennessee average: | 7.40% |
10 or fewer of this county's residents moved to foreign countries.
6.71% relocated to other counties in Tennessee ($32,898 average AGI)
1.50% relocated to other states ($5,425 average AGI)
Union County: 1.50% Tennessee average: 3.20%
Top counties to which taxpayers relocated from this county between 2020 and 2021:
| to Knox County, TN | |
| to Grainger County, TN | |
| to Claiborne County, TN | |
| to Anderson County, TN |
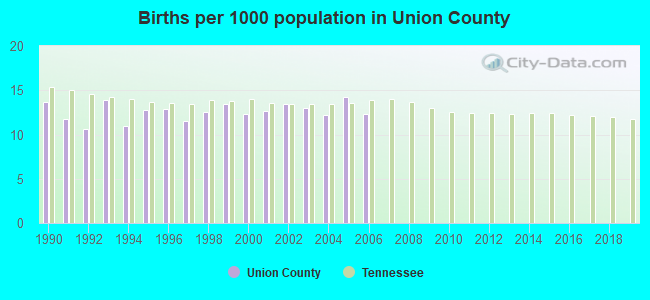
Births per 1000 population from 1990 to 1999: 12.4
Births per 1000 population from 2000 to 2006: 12.9
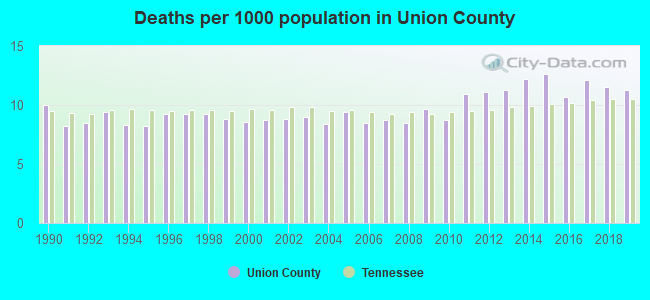
Deaths per 1000 population from 1990 to 1999: 8.9
Deaths per 1000 population from 2000 to 2009: 8.8
Deaths per 1000 population from 2010 to 2020: 11.6
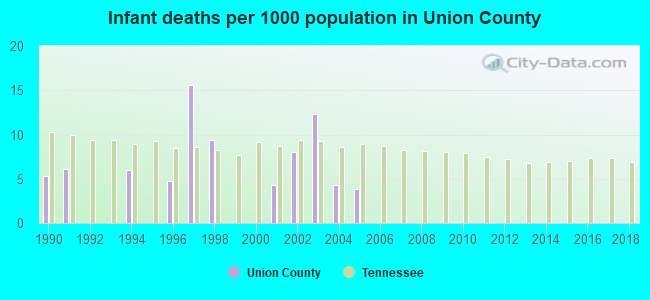
Infant deaths per 1000 live births from 1990 to 1999: 4.7
Infant deaths per 1000 live births from 2000 to 2006: 4.7
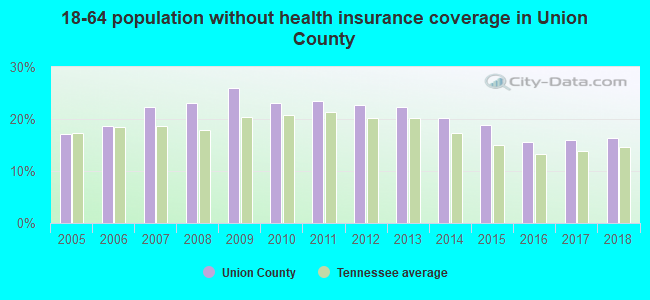
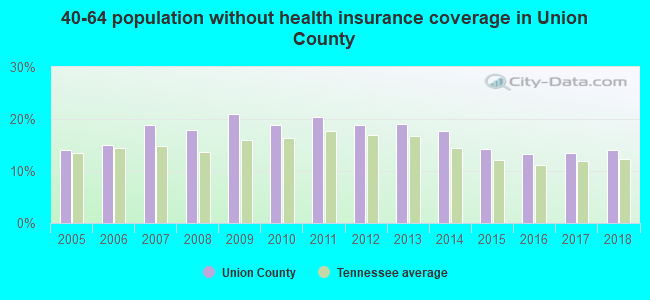
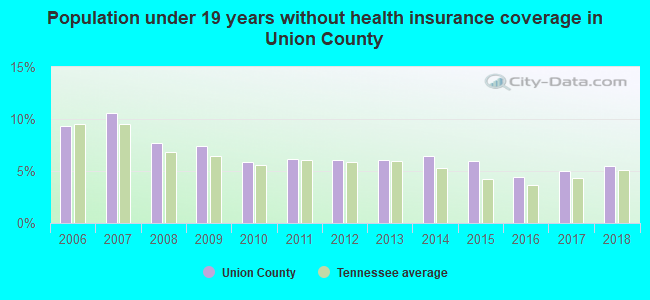
Persons under 19 years old without health insurance coverage in 2018: 5.5%
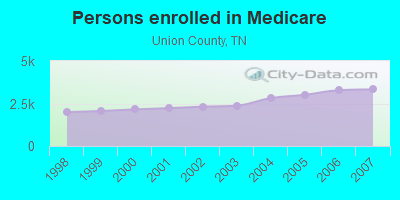
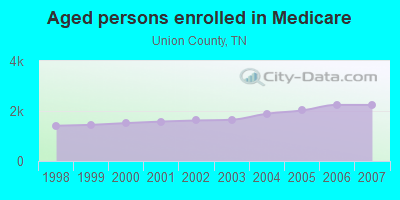
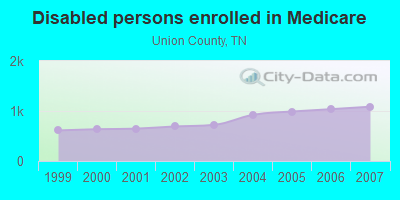
Persons enrolled in hospital insurance and/or supplemental medical insurance (Medicare) in July 1, 2007: 3,329 (2,243 aged, 1,086 disabled)
Children under 18 without health insurance coverage in 2007: 394 (9%)
Most common underlying causes of death in Union County, Tennessee in 1999 - 2019:
- Bronchus or lung, unspecified - Malignant neoplasms (335)
- Acute myocardial infarction, unspecified (329)
- Chronic obstructive pulmonary disease, unspecified (160)
- Atherosclerotic heart disease (152)
- Unspecified dementia (57)
- Other ill-defined and unspecified causes of mortality (10)
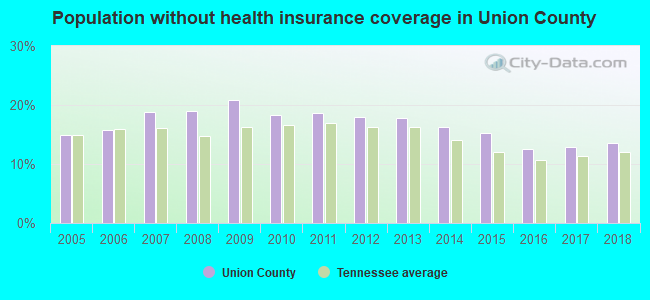
Population without health insurance coverage in 2000: 15%
Children under 18 without health insurance coverage in 2000: 9%
Medical specialist MDs per 100,000 population in 2005: 959
Total births per 100,000 population, July 2005 - July 2006 : 6
Total deaths per 100,000 population, July 2005 - July 2006: 42
Limited-service eating places per 100,000 population in 2005 : 5
Crimes per 100,000 population in 1996: 1
Suicides per 1,000,000 population from 2000 to 2006: 162.7. This is more than state average.
Household type by relationship:
Households: 20,225- Male householders: 3,735 (797 living alone), Female householders: 4,187 (761 living alone)
4,409 spouses (4,409 opposite-sex spouses), 815 unmarried partners, (703 opposite-sex unmarried partners), 5,346 children (4,545 natural, 238 adopted, 547 stepchildren), 560 grandchildren, 110 brothers or sisters, 348 parents, 43 foster children, 329 other relatives, 266 non-relatives
- In group quarters: 171
Size of family households: 2,835 2-persons, 1,403 3-persons, 1,211 4-persons, 429 5-persons, 107 6-persons, 82 7-or-more-persons.
Size of nonfamily households: 1,555 1-person, 254 2-persons, 16 4-persons, 24 5-persons.
2,530 married couples with children.
1,128 single-parent households (209 men, 919 women).
97.9% of residents of Union speak English at home.
1.4% of residents speak Spanish at home (82% speak English very well, 13% speak English well, 3% speak English not well, 3% don't speak English at all).
0.5% of residents speak other Indo-European language at home (85% speak English very well, 15% speak English well).
In fiscal year 2004:
Federal Government expenditure: $78,547,000 ($4,159 per capita)
Department of Defense expenditure: $1,290,000
Federal direct payments to individuals for retirement and disability: $36,940,000
Federal other direct payments to individuals: $15,272,000
Federal direct payments not to individuals: $36,000
Federal grants: $24,169,000
Federal procurement contracts: $409,000 ($12,000 Department of Defense)
Federal salaries and wages: $1,720,000 ($0,000 Department of Defense)
Federal Government direct loans: $1,006,000
Federal guaranteed/insured loans: $4,516,000
Federal Government insurance: $267,000
Population change from April 1, 2000 to July 1, 2005:
Births: 1,253| Here: | 66 per 1000 residents |
| State: | 69 per 1000 residents |
Deaths: 871
| Here: | 46 per 1000 residents |
| State: | 50 per 1000 residents |
Net international migration: 0
| Here: | 0 per 1000 residents |
| State: | +8 per 1000 residents |
Net internal migration: +909
| Here: | +48 per 1000 residents |
| State: | +18 per 1000 residents |
Total withdrawal of fresh water for public supply: 0.57 millions of gallons per day (all from ground)
| Here: | 5.9 |
| State: | 6.5 |
| Here: | 4.8 |
| State: | 4.4 |
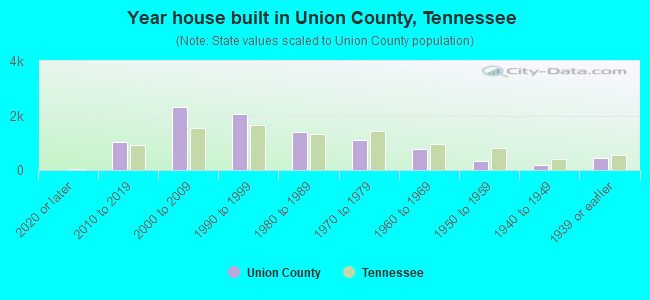
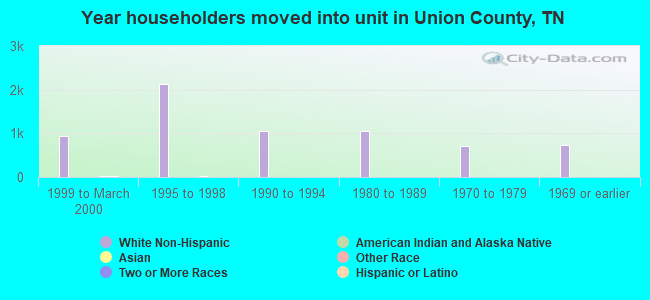
- Year house built in Union County, Tennessee
- 362020 or later
- 1,1152010 to 2019
- 2,4912000 to 2009
- 1,8561990 to 1999
- 1,4261980 to 1989
- 1,1201970 to 1979
- 7021960 to 1969
- 3431950 to 1959
- 2061940 to 1949
- 4291939 or earlier
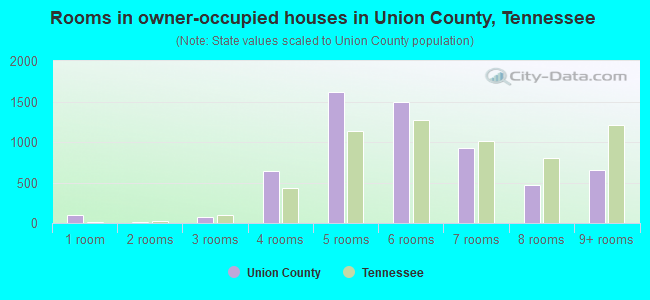
- Rooms in owner-occupied houses in Union County, Tennessee
- 981 room
- 112 rooms
- 1183 rooms
- 5974 rooms
- 1,7385 rooms
- 1,5336 rooms
- 8797 rooms
- 6078 rooms
- 7819+ rooms
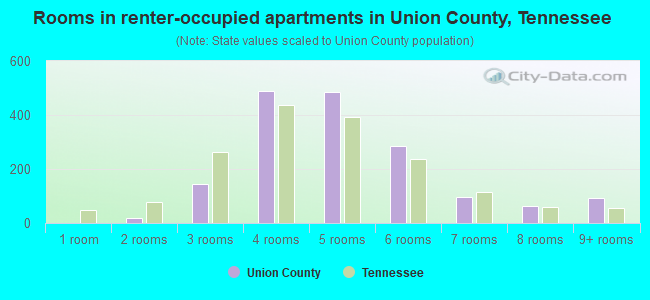
- Rooms in renter-occupied apartments in Union County, Tennessee
- 01 room
- 42 rooms
- 1423 rooms
- 4754 rooms
- 3265 rooms
- 2676 rooms
- 1367 rooms
- 898 rooms
- 839+ rooms
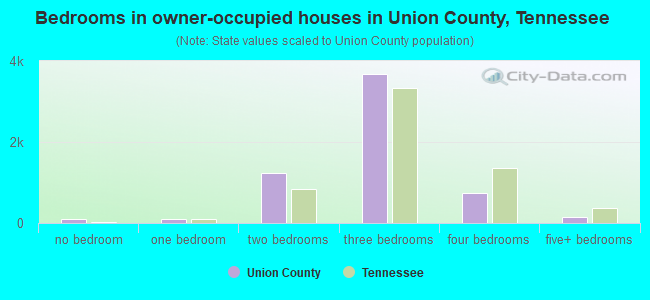
- Bedrooms in owner-occupied houses in Union County, Tennessee
- 117no bedroom
- 1011 bedroom
- 1,2572 bedrooms
- 3,9233 bedrooms
- 8694 bedrooms
- 1095+ bedrooms
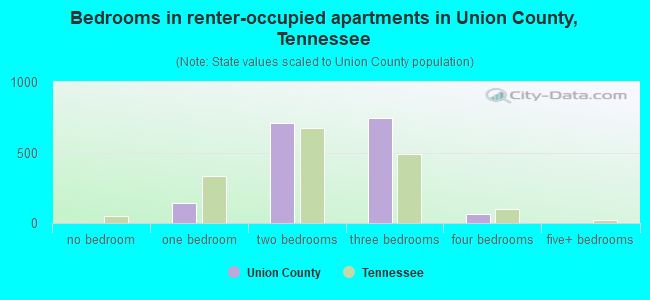
- Bedrooms in renter-occupied apartments in Union County, Tennessee
- 0no bedroom
- 961 bedroom
- 6802 bedrooms
- 6283 bedrooms
- 1144 bedrooms
- 05+ bedrooms
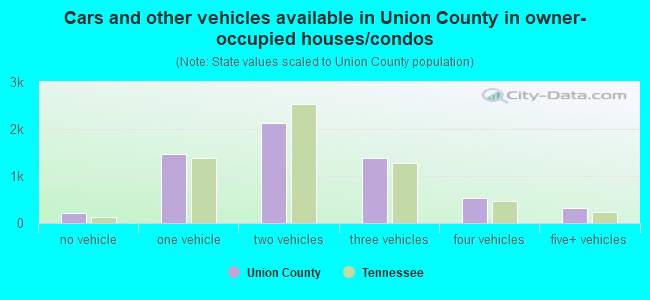
- Cars and other vehicles available in Union County in owner-occupied houses/condos
- 145no vehicle
- 1,2991 vehicle
- 2,7562 vehicles
- 1,4703 vehicles
- 4524 vehicles
- 2795+ vehicles
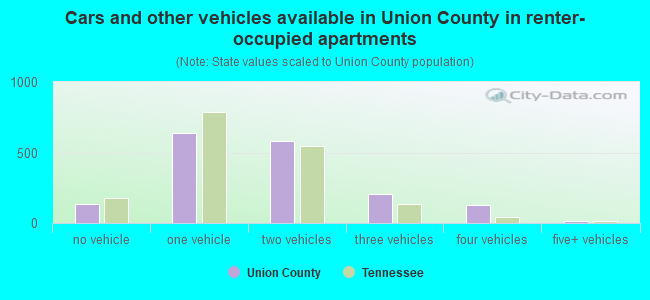
- Cars and other vehicles available in Union County in renter-occupied apartments
- 105no vehicle
- 5351 vehicle
- 5482 vehicles
- 2003 vehicles
- 1474 vehicles
- 165+ vehicles
93.0% of Union County residents lived in the same house 1 years ago.
Out of people who lived in different houses, 23% lived in this county.
Out of people who lived in different counties, 72% lived in Tennessee.
| Union County: | 93.0% |
| State average: | 87.0% |
Place of birth for U.S.-born residents:
- This state: 14,686
- Other state: 5,147
- Northeast: 533
- Midwest: 1,701
- South: 2,602
- West: 270
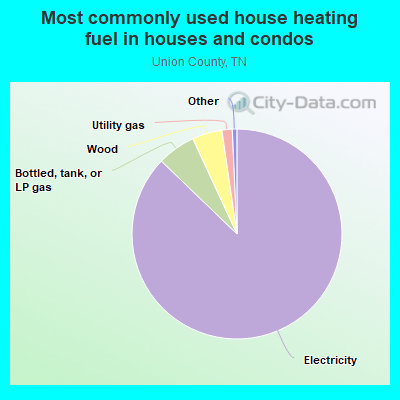
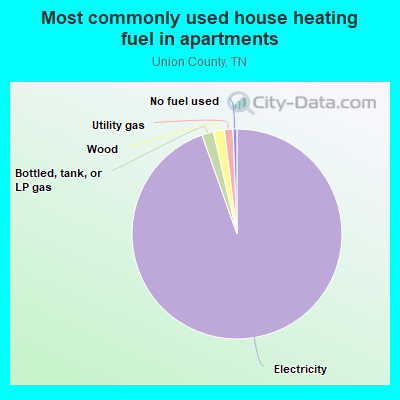
- 86.6%Electricity
- 6.3%Bottled, tank, or LP gas
- 4.0%Wood
- 2.4%Utility gas
- 0.3%Other fuel
- 0.2%Fuel oil, kerosene, etc.
- 0.2%No fuel used
- 96.6%Electricity
- 2.0%Wood
- 1.0%Bottled, tank, or LP gas
- 0.4%Utility gas
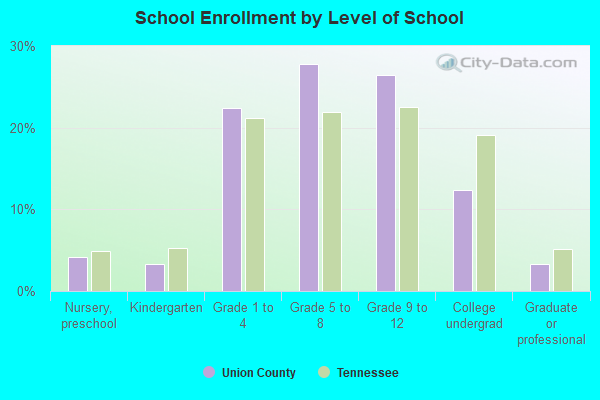
Private vs. public school enrollment:
| Here: | 8.2% |
| Tennessee: | 15.0% |
| Here: | 11.1% |
| Tennessee: | 16.2% |
| Here: | 23.9% |
| Tennessee: | 23.5% |
Union County government finances - Expenditure in 2017:
- Charges - Other: $1,597,000
Elementary and Secondary Education - Other: $1,367,000
Elementary and Secondary Education School Lunch: $120,000
- Current Operations - Elementary and Secondary Education: $29,813,000
Regular Highways: $2,149,000
Health - Other: $1,628,000
Police Protection: $1,522,000
Correctional Institutions: $1,186,000
Financial Administration: $1,141,000
Central Staff Services: $800,000
Judicial and Legal Services: $635,000
General - Other: $291,000
Libraries: $176,000
Solid Waste Management: $165,000
Natural Resources - Other: $164,000
Public Welfare - Other: $123,000
Local Fire Protection: $95,000
Parks and Recreation: $22,000
- Federal Intergovernmental - General Local Government Support: $31,000
Education: $25,000
- General - Interest on Debt: $486,000
- Intergovernmental to Local - Other - Elementary and Secondary Education: $7,000
- Local Intergovernmental - General Local Government Support: $391,000
Education: $9,000
- Long Term Debt - Beginning Outstanding - Unspecified Public Purpose: $12,158,000
Outstanding Unspecified Public Purpose: $10,904,000
Retired Unspecified Public Purpose: $1,473,000
Issue, Unspecified Public Purpose: $220,000
- Miscellaneous - General Revenue - Other: $167,000
Fines and Forfeits: $126,000
Interest Earnings: $54,000
Rents: $33,000
Sale of Property: $20,000
Donations From Private Sources: $18,000
- Other Capital Outlay - Elementary and Secondary Education: $771,000
Regular Highways: $96,000
- Other Funds - Cash and Securities: $952,000
- Short Term Debt Outstanding - Beginning: $266,000
End of Fiscal Year: $130,000
- Sinking Funds - Cash and Securities: $6,110,000
- State Intergovernmental - Education: $30,922,000
Highways: $2,070,000
General Local Government Support: $1,627,000
Public Welfare: $182,000
Health and Hospitals: $108,000
- Tax - Property: $4,738,000
Other Selective Sales: $694,000
Alcoholic Beverage Sales: $163,000
General Sales and Gross Receipts: $71,000
Occupation and Business License - Other: $47,000
Motor Vehicle License: $7,000
Public Utilities Sales: $5,000
Alcoholic Beverage License: $1,000
- Total Salaries and Wages: $15,572,000
Union County government finances - Revenue in 2017:
- Charges - Other: $1,597,000
Elementary and Secondary Education - Other: $1,367,000
Elementary and Secondary Education School Lunch: $120,000
- Current Operations - Elementary and Secondary Education: $29,813,000
Regular Highways: $2,149,000
Health - Other: $1,628,000
Police Protection: $1,522,000
Correctional Institutions: $1,186,000
Financial Administration: $1,141,000
Central Staff Services: $800,000
Judicial and Legal Services: $635,000
General - Other: $291,000
Libraries: $176,000
Solid Waste Management: $165,000
Natural Resources - Other: $164,000
Public Welfare - Other: $123,000
Local Fire Protection: $95,000
Parks and Recreation: $22,000
- Federal Intergovernmental - General Local Government Support: $31,000
Education: $25,000
- General - Interest on Debt: $486,000
- Intergovernmental to Local - Other - Elementary and Secondary Education: $7,000
- Local Intergovernmental - General Local Government Support: $391,000
Education: $9,000
- Long Term Debt - Beginning Outstanding - Unspecified Public Purpose: $12,158,000
Outstanding Unspecified Public Purpose: $10,904,000
Retired Unspecified Public Purpose: $1,473,000
Issue, Unspecified Public Purpose: $220,000
- Miscellaneous - General Revenue - Other: $167,000
Fines and Forfeits: $126,000
Interest Earnings: $54,000
Rents: $33,000
Sale of Property: $20,000
Donations From Private Sources: $18,000
- Other Capital Outlay - Elementary and Secondary Education: $771,000
Regular Highways: $96,000
- Other Funds - Cash and Securities: $952,000
- Short Term Debt Outstanding - Beginning: $266,000
End of Fiscal Year: $130,000
- Sinking Funds - Cash and Securities: $6,110,000
- State Intergovernmental - Education: $30,922,000
Highways: $2,070,000
General Local Government Support: $1,627,000
Public Welfare: $182,000
Health and Hospitals: $108,000
- Tax - Property: $4,738,000
Other Selective Sales: $694,000
Alcoholic Beverage Sales: $163,000
General Sales and Gross Receipts: $71,000
Occupation and Business License - Other: $47,000
Motor Vehicle License: $7,000
Public Utilities Sales: $5,000
Alcoholic Beverage License: $1,000
- Total Salaries and Wages: $15,572,000
Union County government finances - Debt in 2017:
- Charges - Other: $1,597,000
Elementary and Secondary Education - Other: $1,367,000
Elementary and Secondary Education School Lunch: $120,000
- Current Operations - Elementary and Secondary Education: $29,813,000
Regular Highways: $2,149,000
Health - Other: $1,628,000
Police Protection: $1,522,000
Correctional Institutions: $1,186,000
Financial Administration: $1,141,000
Central Staff Services: $800,000
Judicial and Legal Services: $635,000
General - Other: $291,000
Libraries: $176,000
Solid Waste Management: $165,000
Natural Resources - Other: $164,000
Public Welfare - Other: $123,000
Local Fire Protection: $95,000
Parks and Recreation: $22,000
- Federal Intergovernmental - General Local Government Support: $31,000
Education: $25,000
- General - Interest on Debt: $486,000
- Intergovernmental to Local - Other - Elementary and Secondary Education: $7,000
- Local Intergovernmental - General Local Government Support: $391,000
Education: $9,000
- Long Term Debt - Beginning Outstanding - Unspecified Public Purpose: $12,158,000
Outstanding Unspecified Public Purpose: $10,904,000
Retired Unspecified Public Purpose: $1,473,000
Issue, Unspecified Public Purpose: $220,000
- Miscellaneous - General Revenue - Other: $167,000
Fines and Forfeits: $126,000
Interest Earnings: $54,000
Rents: $33,000
Sale of Property: $20,000
Donations From Private Sources: $18,000
- Other Capital Outlay - Elementary and Secondary Education: $771,000
Regular Highways: $96,000
- Other Funds - Cash and Securities: $952,000
- Short Term Debt Outstanding - Beginning: $266,000
End of Fiscal Year: $130,000
- Sinking Funds - Cash and Securities: $6,110,000
- State Intergovernmental - Education: $30,922,000
Highways: $2,070,000
General Local Government Support: $1,627,000
Public Welfare: $182,000
Health and Hospitals: $108,000
- Tax - Property: $4,738,000
Other Selective Sales: $694,000
Alcoholic Beverage Sales: $163,000
General Sales and Gross Receipts: $71,000
Occupation and Business License - Other: $47,000
Motor Vehicle License: $7,000
Public Utilities Sales: $5,000
Alcoholic Beverage License: $1,000
- Total Salaries and Wages: $15,572,000
Union County government finances - Cash and Securities in 2017:
- Charges - Other: $1,597,000
Elementary and Secondary Education - Other: $1,367,000
Elementary and Secondary Education School Lunch: $120,000
- Current Operations - Elementary and Secondary Education: $29,813,000
Regular Highways: $2,149,000
Health - Other: $1,628,000
Police Protection: $1,522,000
Correctional Institutions: $1,186,000
Financial Administration: $1,141,000
Central Staff Services: $800,000
Judicial and Legal Services: $635,000
General - Other: $291,000
Libraries: $176,000
Solid Waste Management: $165,000
Natural Resources - Other: $164,000
Public Welfare - Other: $123,000
Local Fire Protection: $95,000
Parks and Recreation: $22,000
- Federal Intergovernmental - General Local Government Support: $31,000
Education: $25,000
- General - Interest on Debt: $486,000
- Intergovernmental to Local - Other - Elementary and Secondary Education: $7,000
- Local Intergovernmental - General Local Government Support: $391,000
Education: $9,000
- Long Term Debt - Beginning Outstanding - Unspecified Public Purpose: $12,158,000
Outstanding Unspecified Public Purpose: $10,904,000
Retired Unspecified Public Purpose: $1,473,000
Issue, Unspecified Public Purpose: $220,000
- Miscellaneous - General Revenue - Other: $167,000
Fines and Forfeits: $126,000
Interest Earnings: $54,000
Rents: $33,000
Sale of Property: $20,000
Donations From Private Sources: $18,000
- Other Capital Outlay - Elementary and Secondary Education: $771,000
Regular Highways: $96,000
- Other Funds - Cash and Securities: $952,000
- Short Term Debt Outstanding - Beginning: $266,000
End of Fiscal Year: $130,000
- Sinking Funds - Cash and Securities: $6,110,000
- State Intergovernmental - Education: $30,922,000
Highways: $2,070,000
General Local Government Support: $1,627,000
Public Welfare: $182,000
Health and Hospitals: $108,000
- Tax - Property: $4,738,000
Other Selective Sales: $694,000
Alcoholic Beverage Sales: $163,000
General Sales and Gross Receipts: $71,000
Occupation and Business License - Other: $47,000
Motor Vehicle License: $7,000
Public Utilities Sales: $5,000
Alcoholic Beverage License: $1,000
- Total Salaries and Wages: $15,572,000
Supplemental Security Income (SSI) in 2006:
- Total number of recipients: 874
- Number of aged recipients: 46
- Number of blind and disabled recipients: 828
- Number of recipients under 18: 85
- Number of recipients between 18 and 64: 618
- Number of recipients older than 64: 171
- Number of recipients also receiving OASDI: 311
- Amount of payments (thousands of dollars): 374
| Most common first names in Union County, TN among deceased individuals | ||
| Name | Count | Lived (average) |
|---|---|---|
| James | 154 | 71.2 years |
| William | 134 | 75.3 years |
| Mary | 112 | 75.9 years |
| John | 89 | 73.2 years |
| Robert | 86 | 70.9 years |
| Charles | 82 | 71.9 years |
| George | 45 | 74.3 years |
| Roy | 43 | 73.1 years |
| Carl | 37 | 73.3 years |
| Thomas | 34 | 71.6 years |
| Most common last names in Union County, TN among deceased individuals | ||
| Last name | Count | Lived (average) |
|---|---|---|
| Beeler | 80 | 75.0 years |
| Smith | 77 | 73.2 years |
| Kitts | 61 | 72.1 years |
| Sharp | 51 | 78.3 years |
| Johnson | 50 | 72.5 years |
| Davis | 50 | 75.1 years |
| Buckner | 44 | 74.1 years |
| Wolfenbarger | 39 | 70.0 years |
| Williams | 39 | 76.1 years |
| Graves | 39 | 74.4 years |
| Businesses in Union County, TN | ||||
| Name | Count | Name | Count | |
|---|---|---|---|---|
| Ace Hardware | 1 | Hardee's | 1 | |
| Advance Auto Parts | 1 | Rite Aid | 1 | |
| AutoZone | 1 | Subway | 2 | |
| Baskin-Robbins | 1 | U-Haul | 1 | |
| CVS | 1 | U.S. Cellular | 1 | |
| FedEx | 1 | Walgreens | 1 | |
| H&R Block | 1 | |||
Union County on our top lists:
- #66 on the list of "Top 101 counties with the highest Particulate Matter (PM10) Annual air pollution readings in 2012 (µg/m3)"
- #77 on the list of "Top 101 counties with the smallest number of people without health insurance coverage in 2000"