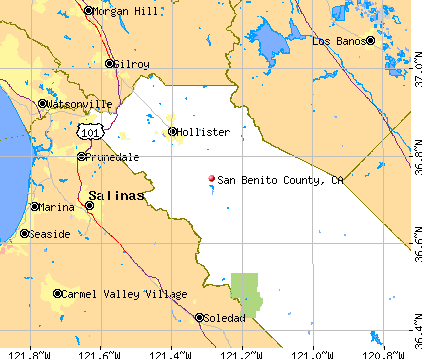
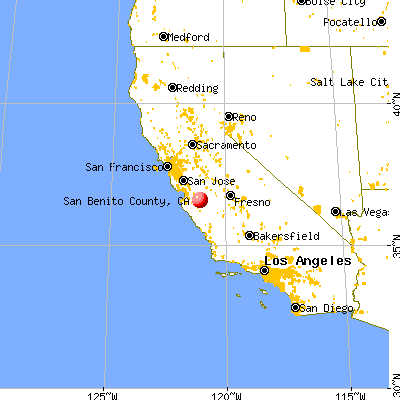
San Benito County, California (CA)
County owner-occupied free and clear houses and condos in 2010: 2,140
County owner-occupied houses and condos in 2000: 10,824
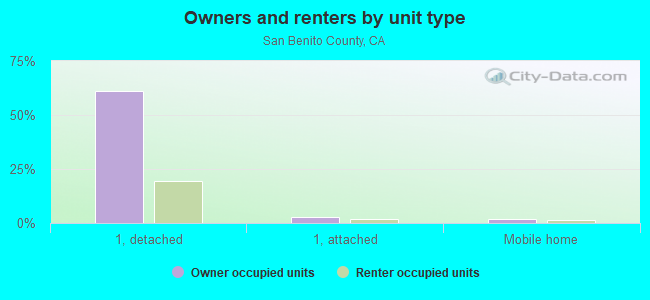
Renter-occupied apartments: 5,878 (it was 5,061 in 2000)
| % of renters here: | 32% |
| State: | 44% |
Land area: 1389 sq. mi.
Water area: 1.7 sq. mi.
Population density: 49 people per square mile (average).
Industries providing employment: Educational, health and social services (19.2%), Manufacturing (11.0%), Construction (10.6%), Professional, scientific, management, administrative, and waste management services (10.4%), Retail trade (10.4%).
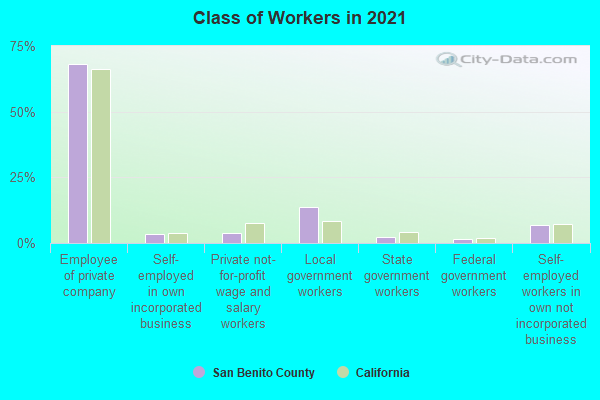
Type of workers:
- Private wage or salary: 78%
- Government: 16%
- Self-employed, not incorporated: 6%
- Unpaid family work: 0%
- OSM Map
- General Map
- Google Map
- MSN Map

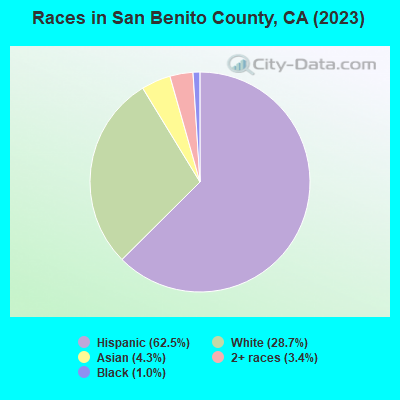
- 42,20262.4%Hispanic or Latino
- 18,69927.7%White Non-Hispanic Alone
- 3,4525.1%Two or more races
- 2,2933.4%Asian alone
- 6080.9%Black Non-Hispanic Alone
- 1830.3%American Indian and Alaska Native alone
- 840.1%Native Hawaiian and Other
Pacific Islander alone - 580.09%Some other race alone
| Median resident age: | 35.7 years |
| California median age: | 37.9 years |
| Males: 33,905 | |
| Females: 33,674 |


| San Benito County: | 3.0 people |
| California: | 3 people |
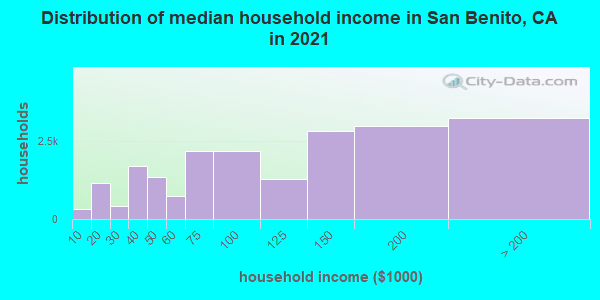
Estimated median household income in 2022: $111,544 ($57,469 in 1999)
| This county: | $111,544 |
| California: | $91,551 |
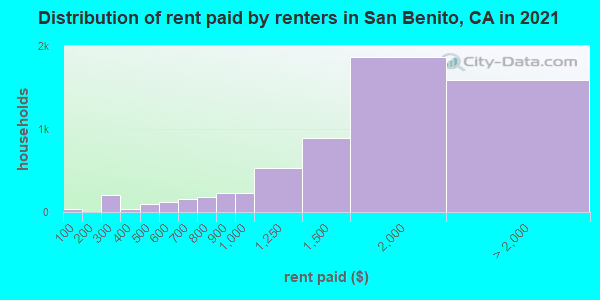
Median contract rent in 2022 for apartments: $1,448 (lower quartile is $745, upper quartile is $2,105)
| This county: | $1448 |
| State: | $1719 |
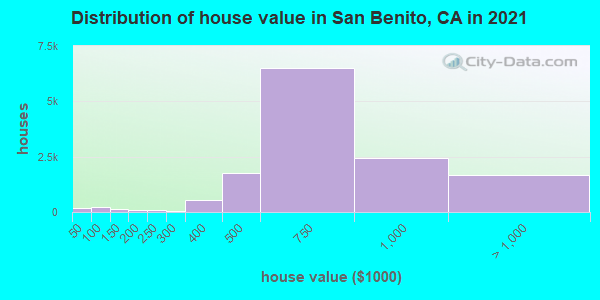
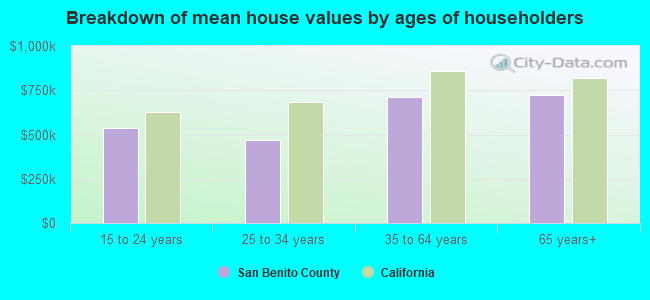
Estimated median house or condo value in 2022: $801,200 (it was $283,900 in 2000)
| San Benito: | $801,200 |
| California: | $715,900 |
Mean price in 2022:
Median monthly housing costs for homes and condos with a mortgage: $3,003Detached houses: $859,504
Here: $859,504 State: $988,808 Townhouses or other attached units: $670,998
Here: $670,998 State: $838,546 In 2-unit structures: $407,181
Here: $407,181 State: $1,138,100 In 3-to-4-unit structures: $687,481
Here: $687,481 State: $824,253 In 5-or-more-unit structures: $411,852
Here: $411,852 State: $730,996 Mobile homes: $375,896
Here: $375,896 State: $184,506 Occupied boats, RVs, vans, etc.: $118,823
Here: $118,823 State: $204,957
Median monthly housing costs for units without a mortgage: $827
Institutionalized population: 129
Crime in 2020 (reported by the sheriff's office or county police, not the county total):
- Murders: 1
- Rapes: 5
- Robberies: 2
- Assaults: 25
- Burglaries: 41
- Thefts: 100
- Auto thefts: 17
Crime in 2019 (reported by the sheriff's office or county police, not the county total):
- Murders: 0
- Rapes: 7
- Robberies: 2
- Assaults: 24
- Burglaries: 34
- Thefts: 105
- Auto thefts: 13
Health of residents in San Benito County based on CDC Behavioral Risk Factor Surveillance System Survey Questionnaires from 2013 to 2021:
General health status score of residents in this county from 1 (poor) to 5 (excellent) is 3.6. This is better than average.76.1% of residents exercised in the past month. This is about average.
30.2% of residents smoked 100+ cigarettes in their lives. This is less than average.
61.3% of adult residents drank alcohol in the past 30 days. This is less than average.
73.5% of residents visited a dentist within the past year. This is about average.
Average weight of males is 183 pounds. This is less than average.
Average weight of females is 151 pounds. This is less than average.
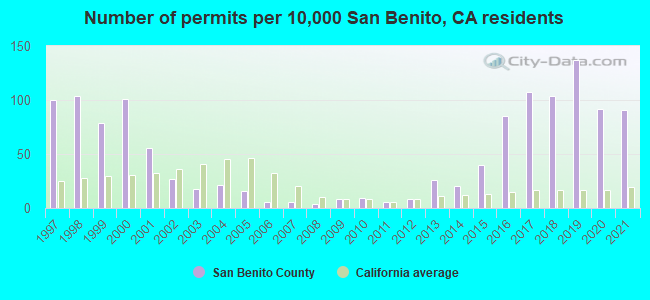
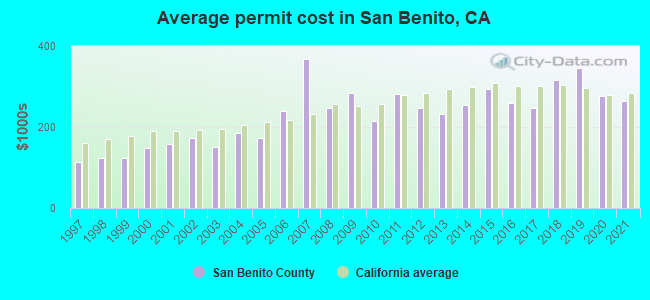
Single-family new house construction building permits:
- 2022: 354 buildings, average cost: $324,200
- 2021: 485 buildings, average cost: $264,700
- 2020: 492 buildings, average cost: $276,800
- 2019: 727 buildings, average cost: $346,400
- 2018: 551 buildings, average cost: $315,300
- 2017: 569 buildings, average cost: $246,300
- 2016: 453 buildings, average cost: $259,100
- 2015: 212 buildings, average cost: $293,600
- 2014: 105 buildings, average cost: $255,000
- 2013: 141 buildings, average cost: $231,800
- 2012: 41 buildings, average cost: $245,600
- 2011: 32 buildings, average cost: $282,200
- 2010: 47 buildings, average cost: $214,300
- 2009: 40 buildings, average cost: $283,900
- 2008: 19 buildings, average cost: $246,200
- 2007: 32 buildings, average cost: $367,400
- 2006: 30 buildings, average cost: $238,700
- 2005: 83 buildings, average cost: $173,800
- 2004: 112 buildings, average cost: $186,100
- 2003: 97 buildings, average cost: $151,400
- 2002: 142 buildings, average cost: $172,900
- 2001: 297 buildings, average cost: $158,800
- 2000: 538 buildings, average cost: $147,200
- 1999: 422 buildings, average cost: $123,700
- 1998: 555 buildings, average cost: $122,500
- 1997: 532 buildings, average cost: $112,900
Median real estate property taxes paid for housing units with mortgages in 2022: $7,025 (0.9%)
Median real estate property taxes paid for housing units with no mortgage in 2022: $5,220 (0.7%)
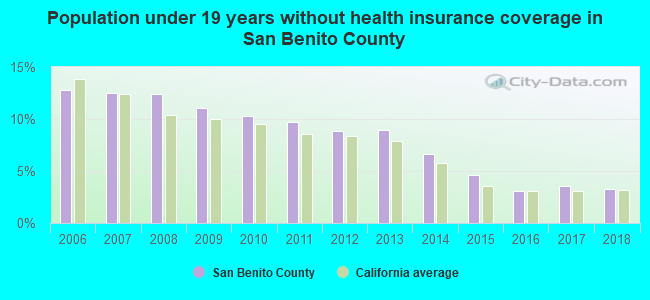
| San Benito County: | 3.6% |
| California: | 12.2% |
Median age of residents in 2022: 35.7 years old
(Males: 35.8 years old, Females: 35.6 years old)
(Median age for: White residents: 50.6 years old, Black residents: 66.3 years old, American Indian residents: 25.0 years old, Asian residents: 46.2 years old, Hispanic or Latino residents: 31.4 years old, Other race residents: 31.2 years old)
Fair market rent in 2006 for a 1-bedroom apartment in San Benito County is $831 a month.
Fair market rent for a 2-bedroom apartment is $924 a month.
Fair market rent for a 3-bedroom apartment is $1309 a month.
Cities in this county include: Hollister, Aromas, Ridgemark, San Juan Bautista, San Benito-Bitterwater, Tres Pinos.
| Zip code | City | Number of tests | Number of tests >= 4 pCi/L |
|---|---|---|---|
| 95023 | Hollister | 11 | 0 |
| 95045 | San Juan Bautista | 3 | 1 |
| 95075 | Tres Pinos | 1 | 0 |
2023 air pollution in San Benito County:
Ozone (1-hour): 0.030 ppm (standard limit: 0.12 ppm). Near U.S. average.
Particulate Matter (PM10) Annual: 10.6 µg/m3. Below U.S. average.
Particulate Matter (PM2.5) Annual: 3.7 µg/m3(standard limit: 15.0 µg/m3). Below U.S. average.
Neighboring counties: Ellis County, Oklahoma  , Howell County, Missouri , Scott County, Tennessee , Norfolk city, Virginia , Norton city, Virginia , Roanoke city, Virginia .
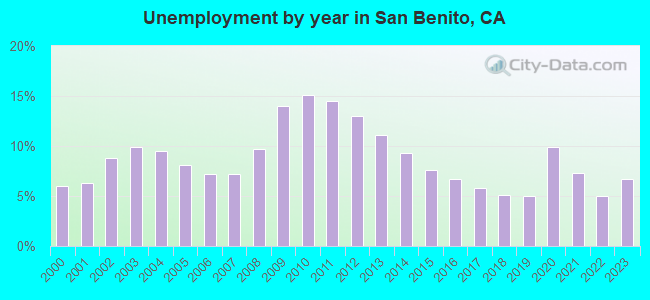
| Here: | 6.6% |
| California: | 5.1% |
Current college students: 2,570
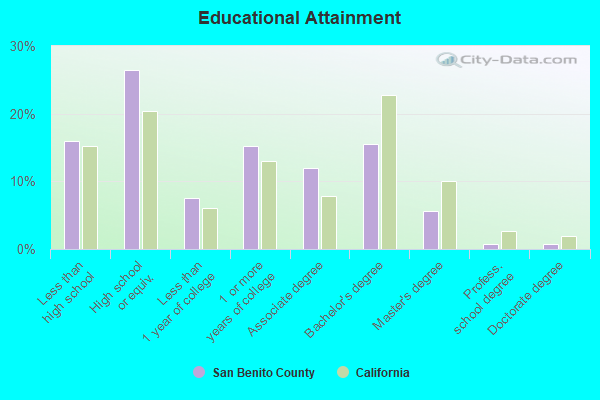
People 25 years of age or older with a high school degree or higher: 82.8%
People 25 years of age or older with a bachelor's degree or higher: 26.9%
Number of foreign born residents: 12,975 (45.6% naturalized citizens)
| San Benito County: | 19.2% |
| Whole state: | 26.7% |
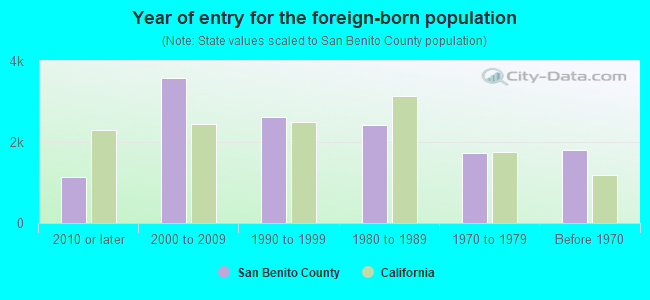
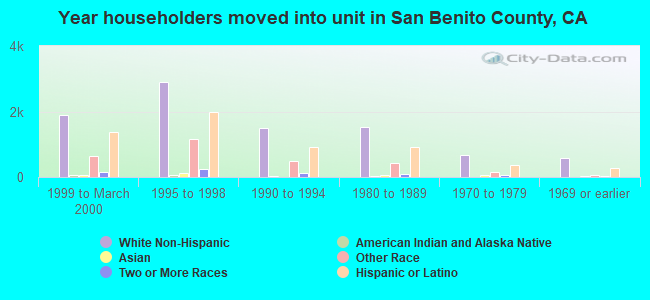
- Year of entry for the foreign-born population
- 1,2922010 or later
- 3,4142000 to 2009
- 2,8161990 to 1999
- 2,4321980 to 1989
- 1,7191970 to 1979
- 1,806Before 1970
Mean travel time to work (commute): " minutes
Percentage of county residents living and working in this county: 100.0%
Housing units in structures:
- One, detached: 17,461
- One, attached: 729
- Two: 68
- 3 or 4: 1,156
- 5 to 9: 304
- 10 to 19: 535
- 20 to 49: 167
- 50 or more: 82
- Mobile homes: 918
- Boats, RVs, vans, etc.: 17
Housing units in San Benito County with a mortgage: 10,489 (571 second mortgage, 0 home equity loan, 560 both second mortgage and home equity loan)
Houses without a mortgage: 45
| Here: | 18.2% with mortgage |
| State: | 98.6% with mortgage |
Religion statistics for San Benito County
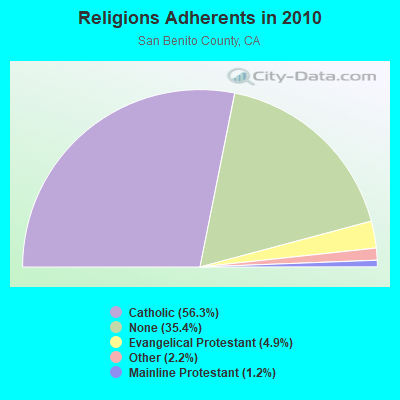
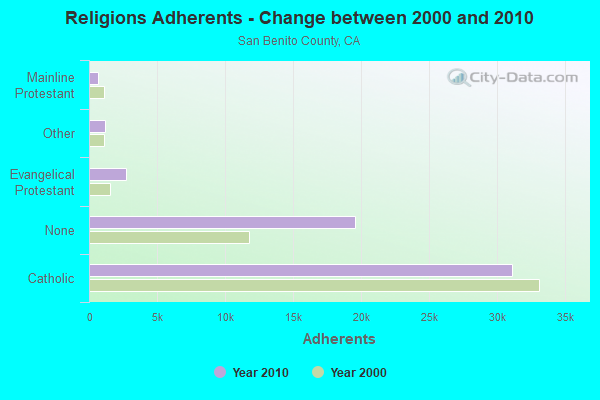
| Religion | Adherents | Congregations |
|---|---|---|
| Catholic | 31,105 | 3 |
| Evangelical Protestant | 2,694 | 21 |
| Other | 1,204 | 5 |
| Mainline Protestant | 687 | 3 |
| None | 19,579 | - |
Source: Clifford Grammich, Kirk Hadaway, Richard Houseal, Dale E.Jones, Alexei Krindatch, Richie Stanley and Richard H.Taylor. 2012. 2010 U.S.Religion Census: Religious Congregations & Membership Study. Association of Statisticians of American Religious Bodies. Jones, Dale E., et al. 2002. Congregations and Membership in the United States 2000. Nashville, TN: Glenmary Research Center.
Food Environment Statistics:
| San Benito County: | 2.39 / 10,000 pop. |
| State: | 2.14 / 10,000 pop. |
| This county: | 0.92 / 10,000 pop. |
| California: | 0.62 / 10,000 pop. |
| San Benito County: | 0.18 / 10,000 pop. |
| California: | 1.49 / 10,000 pop. |
| This county: | 7.17 / 10,000 pop. |
| State: | 7.42 / 10,000 pop. |
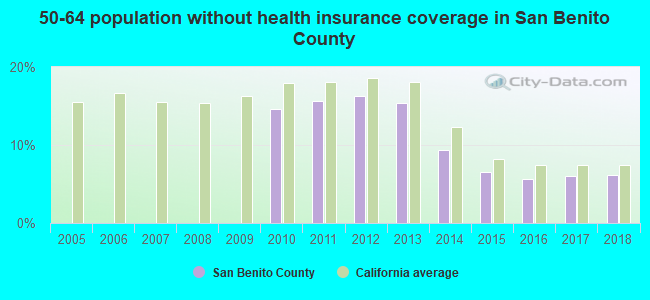
| San Benito County: | 6.6% |
| California: | 7.3% |
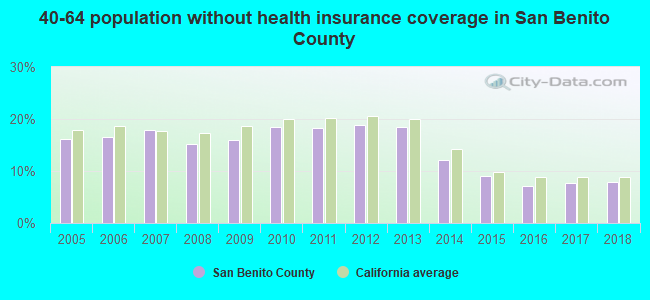
| San Benito County: | 22.9% |
| State: | 21.3% |
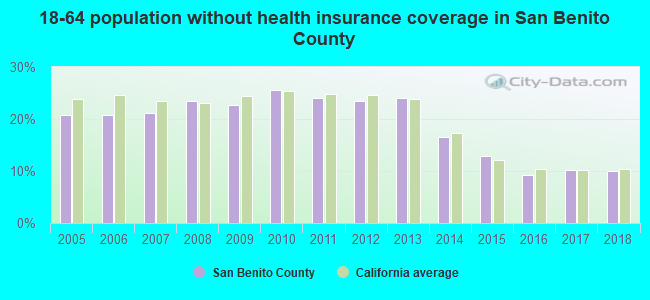
| Here: | 23.2% |
| State: | 17.9% |
Agriculture in San Benito County:
Average size of farms: 854 acresAverage value of agricultural products sold per farm: $292,311
Average value of crops sold per acre for harvested cropland: $4587.09
The value of livestock, poultry, and their products as a percentage of the total market value of agricultural products sold: 19.38%
Average total farm production expenses per farm: $240,765
Harvested cropland as a percentage of land in farms: 6.01%
Irrigated harvested cropland as a percentage of land in farms: 84.20%
Average market value of all machinery and equipment per farm: $63,852
The percentage of farms operated by a family or individual: 83.01%
Average age of principal farm operators: 56 years
Average number of cattle and calves per 100 acres of all land in farms: 6.81
Milk cows as a percentage of all cattle and calves: 2.37%
Vegetables: 22,180 harvested acres
Land in orchards: 9,201 acres
Earthquake activity:
San Benito County-area historical earthquake activity is significantly above California state average. It is 7949% greater than the overall U.S. average.On 4/18/1906 at 13:12:21, a magnitude 7.9 (7.9 UK, Class: Major, Intensity: VIII - XII) earthquake occurred 128.0 miles away from San Benito County center, causing $524,000,000 total damage
On 7/21/1952 at 11:52:14, a magnitude 7.7 (7.7 UK) earthquake occurred 176.2 miles away from the county center, causing $50,000,000 total damage
On 11/4/1927 at 13:51:53, a magnitude 7.5 (7.5 UK) earthquake occurred 127.5 miles away from the county center
On 10/18/1989 at 00:04:15, a magnitude 7.1 (6.5 MB, 7.1 MS, 6.9 MW, 7.0 ML) earthquake occurred 36.6 miles away from the county center, causing 62 deaths (62 shaking deaths) and 3757 injuries, causing $1,305,032,704 total damage
On 5/2/1983 at 23:42:37, a magnitude 6.7 (6.2 MB, 6.5 MS, 6.5 MW, 6.7 ML, Class: Strong, Intensity: VII - IX) earthquake occurred 65.8 miles away from San Benito County center, causing $31,000,000 total damage
On 12/21/1932 at 06:10:09, a magnitude 7.2 (7.2 UK) earthquake occurred 213.8 miles away from the county center
Magnitude types: body-wave magnitude (MB), local magnitude (ML), surface-wave magnitude (MS), moment magnitude (MW)
Most recent natural disasters:
- California Covid-19 Pandemic, Incident Period: January 20, 2020, FEMA Id: 4482, Natural disaster type: Other
- California Severe Winter Storms, Flooding, Mudslides, Incident Period: February 1, 2017 - February 23, 2017, FEMA Id: 4308, Natural disaster type: Winter Storm, Mudslide, Flood
- California Severe Winter Storms, Flooding, And Mudslides, Incident Period: January 3, 2017 - January 12, 2017, FEMA Id: 4301, Natural disaster type: Winter Storm, Mudslide, Flood
- California Hurricane Katrina Evacuation, Incident Period: August 29, 2005 to October 01, 2005, Emergency Declared EM-3248: September 13, 2005, FEMA Id: 3248, Natural disaster type: Hurricane
- California Severe Winter Storms and Flooding, Incident Period: February 02, 1998 to April 30, 1998, Major Disaster (Presidential) Declared DR-1203: February 09, 1998, FEMA Id: 1203, Natural disaster type: Winter Storm, Flood
- California Severe Storms/Flooding, Incident Period: December 28, 1996 to April 01, 1997, Major Disaster (Presidential) Declared DR-1155: January 04, 1997, FEMA Id: 1155, Natural disaster type: Storm, Flood
- California Severe Winter Storms, Flooding, Landslides, Mud Flows, Incident Period: February 13, 1995 to April 19, 1995, Major Disaster (Presidential) Declared DR-1046: March 12, 1995, FEMA Id: 1046, Natural disaster type: Winter Storm, Landslide, Flood
- California Severe Freeze, Incident Period: December 19, 1990 to January 03, 1991, Major Disaster (Presidential) Declared DR-894: February 11, 1991, FEMA Id: 894, Natural disaster type: Freeze
- California Loma Prieta Earthquake, Incident Period: October 17, 1989 to December 18, 1989, Major Disaster (Presidential) Declared DR-845: October 18, 1989, FEMA Id: 845, Natural disaster type: Earthquake
- California SEVERE STORMS, FLOODING, Incident Period: February 12, 1986 to March 10, 1986, Major Disaster (Presidential) Declared DR-758: February 21, 1986, FEMA Id: 758, Natural disaster type: Storm, Flood
- 3 other natural disasters have been reported since 1953.
The number of natural disasters in San Benito County (13) is near the US average (15).
Major Disasters (Presidential) Declared: 8
Emergencies Declared: 2
Causes of natural disasters: Floods: 8, Storms: 4, Winter Storms: 4, Mudslides: 2, Drought: 1, Earthquake: 1, Freeze: 1, Hurricane: 1, Landslide: 1, Tornado: 1, Other: 1 (Note: some incidents may be assigned to more than one category).
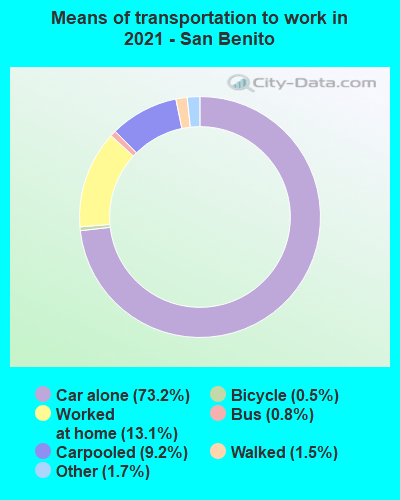
Means of transportation to work:
- Drove a car alone: 13,101 (67.9%)
- Carpooled: 1,877 (9.7%)
- Bus: 112 (0.6%)
- Subway or elevated rail: 24 (0.1%)
- Taxicab, motorcycle, or other means: 364 (1.9%)
- Bicycle: 88 (0.5%)
- Walked: 342 (1.8%)
- Worked at home: 3,546 (18.4%)
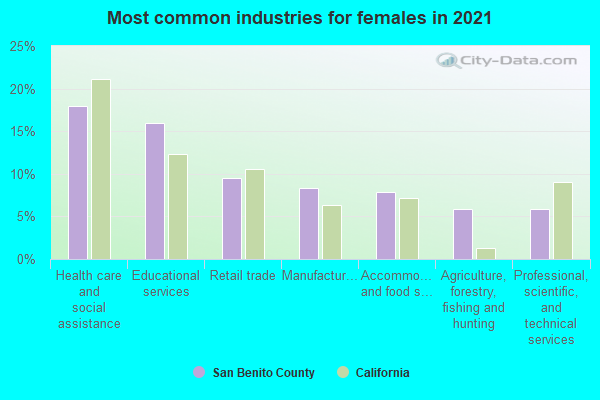
- Health care and social assistance (16%)
- Educational services (9%)
- Accommodation and food services (6%)
- Retail trade (5%)
- Professional, scientific, and technical services (5%)
- Construction (5%)
- Public administration (5%)
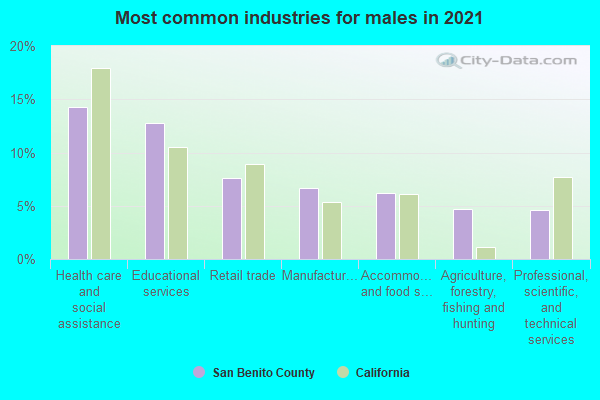
- Health care and social assistance (20%)
- Educational services (12%)
- Accommodation and food services (8%)
- Retail trade (7%)
- Professional, scientific, and technical services (7%)
- Construction (6%)
- Public administration (6%)
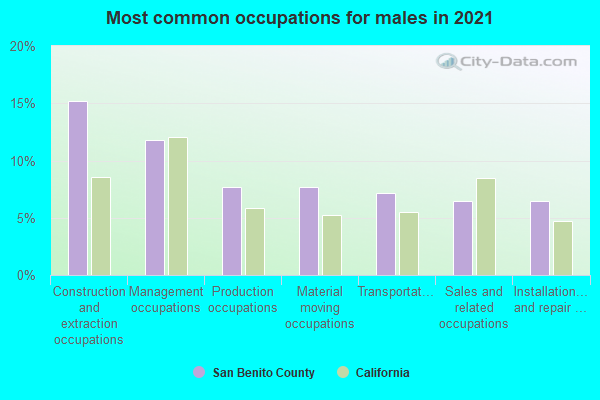
- Construction and extraction occupations (11%)
- Management occupations (11%)
- Installation, maintenance, and repair occupations (9%)
- Farming, fishing, and forestry occupations (9%)
- Sales and related occupations (8%)
- Material moving occupations (6%)
- Transportation occupations (5%)
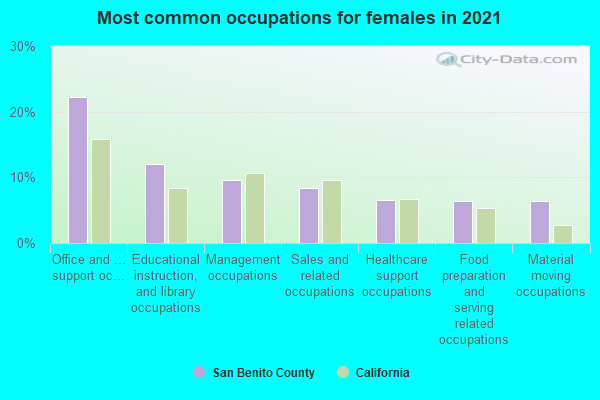
- Office and administrative support occupations (22%)
- Management occupations (10%)
- Business and financial operations occupations (7%)
- Food preparation and serving related occupations (6%)
- Educational instruction, and library occupations (6%)
- Health technologists and technicians (5%)
- Health diagnosing and treating practitioners and other technical occupations (5%)
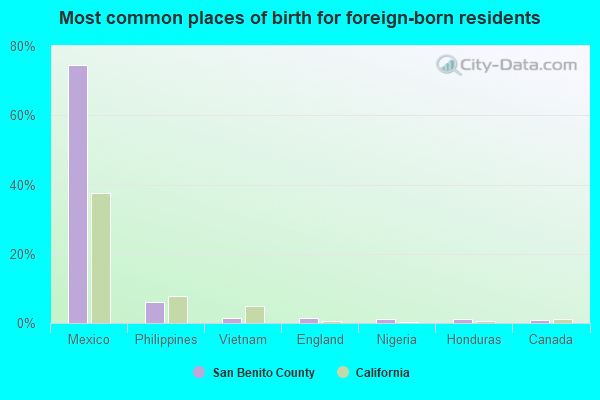
- Mexico (75%)
- Philippines (6%)
- El Salvador (2%)
- Guatemala (1%)
- Canada (1%)
- Honduras (1%)
- Vietnam (1%)
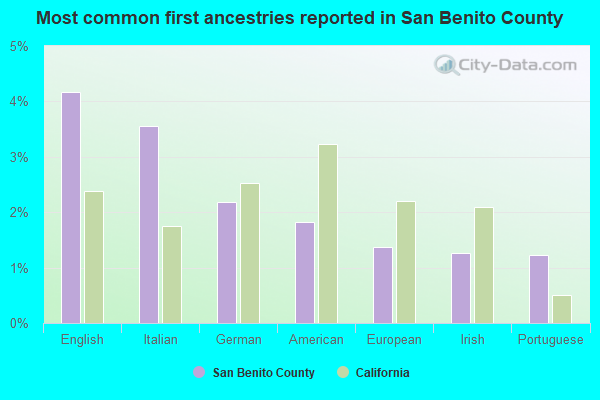
- English (4%)
- Italian (3%)
- American (2%)
- Irish (2%)
- German (2%)
- European (1%)
- Portuguese (1%)
People in group quarters in San Benito County, California in 2010:
- 102 people in nursing facilities/skilled-nursing facilities
- 98 people in workers' group living quarters and job corps centers
- 37 people in other noninstitutional facilities
- 27 people in group homes for juveniles (non-correctional)
- 16 people in emergency and transitional shelters (with sleeping facilities) for people experiencing homelessness
- 9 people in group homes intended for adults
People in group quarters in San Benito County, California in 2000:
- 135 people in agriculture workers' dormitories on farms
- 112 people in nursing homes
- 97 people in other types of correctional institutions
- 93 people in other noninstitutional group quarters
- 39 people in other group homes
- 10 people in other nonhousehold living situations
- 8 people in unknown juvenile institutions
- 7 people in homes for the mentally retarded
- 6 people in homes for the mentally ill
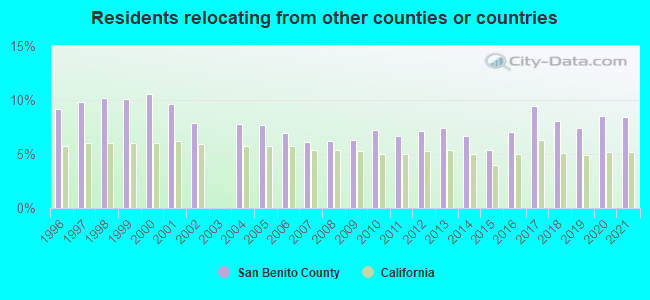
8.46% of this county's 2021 resident taxpayers lived in other counties in 2020 ($82,413 average adjusted gross income)
| Here: | 8.46% |
| California average: | 5.19% |
10 or fewer of this county's residents moved from foreign countries.
7.84% relocated from other counties in California ($78,106 average AGI)
0.62% relocated from other states ($4,307 average AGI)
San Benito County: 0.62% California average: 1.56%
Top counties from which taxpayers relocated into this county between 2020 and 2021:
| from Santa Clara County, CA | |
| from Monterey County, CA | |
| from Santa Cruz County, CA | |
| from Merced County, CA | |
| from Alameda County, CA | |
| from Los Angeles County, CA | |
| from San Diego County, CA |
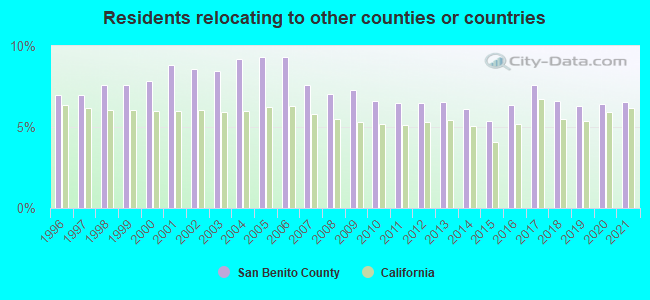
6.55% of this county's 2020 resident taxpayers moved to other counties in 2021 ($78,164 average adjusted gross income)
| Here: | 6.55% |
| California average: | 6.14% |
10 or fewer of this county's residents moved to foreign countries.
4.92% relocated to other counties in California ($54,879 average AGI)
1.63% relocated to other states ($23,286 average AGI)
San Benito County: 1.63% California average: 2.55%
Top counties to which taxpayers relocated from this county between 2020 and 2021:
| to Santa Clara County, CA | |
| to Monterey County, CA | |
| to Merced County, CA | |
| to Santa Cruz County, CA | |
| to Sacramento County, CA | |
| to Fresno County, CA | |
| to Alameda County, CA |
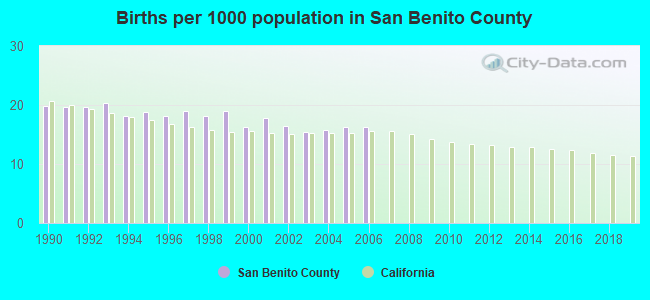
Births per 1000 population from 1990 to 1999: 19.1
Births per 1000 population from 2000 to 2006: 16.3
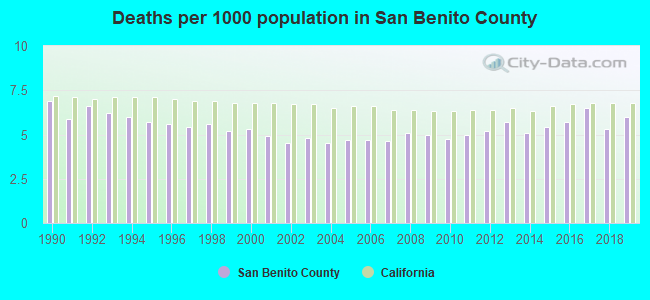
Deaths per 1000 population from 1990 to 1999: 5.9
Deaths per 1000 population from 2000 to 2009: 4.8
Deaths per 1000 population from 2010 to 2020: 5.6
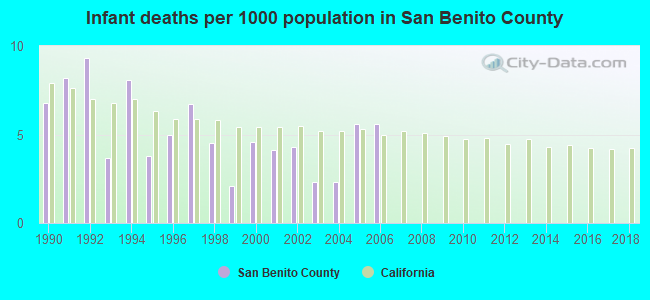
Infant deaths per 1000 live births from 1990 to 1999: 5.8
Infant deaths per 1000 live births from 2000 to 2006: 4.1
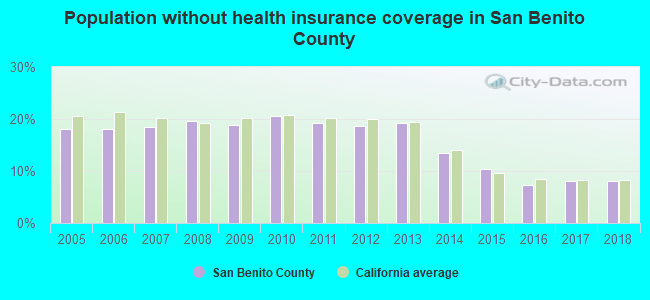
Persons under 19 years old without health insurance coverage in 2018: 3.3%
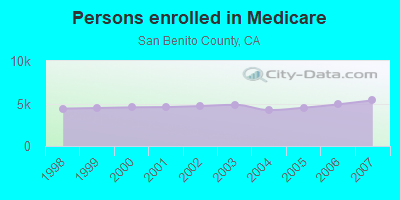
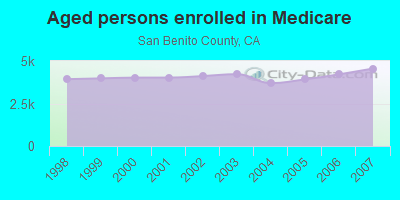
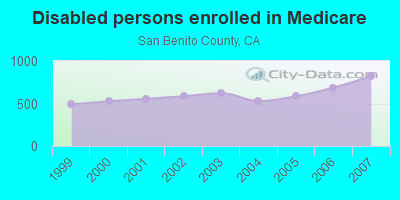
Persons enrolled in hospital insurance and/or supplemental medical insurance (Medicare) in July 1, 2007: 5,374 (4,553 aged, 821 disabled)
Children under 18 without health insurance coverage in 2007: 1,936 (12%)
Most common underlying causes of death in San Benito County, California in 1999 - 2019:
- Atherosclerotic heart disease (444)
- Bronchus or lung, unspecified - Malignant neoplasms (285)
- Acute myocardial infarction, unspecified (148)
- Chronic obstructive pulmonary disease, unspecified (147)
- Congestive heart failure (109)
- Stroke, not specified as haemorrhage or infarction (88)
- Pneumonia, unspecified (58)
- Unspecified dementia (52)
- Alzheimer disease, unspecified (14)
- Breast, unspecified - Malignant neoplasms (11)
Population without health insurance coverage in 2000: 18%
Children under 18 without health insurance coverage in 2000: 14%
Suicides per 1,000,000 population from 2000 to 2006: 75.7. This is less than state average.
Household type by relationship:
Households: 67,579- Male householders: 10,948 (1,463 living alone), Female householders: 9,662 (1,860 living alone)
10,960 spouses (10,960 opposite-sex spouses), 1,714 unmarried partners, (1,714 opposite-sex unmarried partners), 23,697 children (22,389 natural, 479 adopted, 829 stepchildren), 1,323 grandchildren, 1,788 brothers or sisters, 1,322 parents, 81 foster children, 1,690 other relatives, 3,918 non-relatives
- In group quarters: 476
Size of family households: 4,379 2-persons, 3,991 3-persons, 4,338 4-persons, 1,679 5-persons, 773 6-persons, 390 7-or-more-persons.
Size of nonfamily households: 3,323 1-person, 1,000 2-persons, 643 4-persons, 94 7-or-more-persons.
10,524 married couples with children.
4,691 single-parent households (1,954 men, 2,737 women).
57.7% of residents of San Benito speak English at home.
38.9% of residents speak Spanish at home (61% speak English very well, 16% speak English well, 17% speak English not well, 7% don't speak English at all).
1.2% of residents speak other Indo-European language at home (77% speak English very well, 18% speak English well, 3% speak English not well, 2% don't speak English at all).
1.8% of residents speak Asian or Pacific Island language at home (61% speak English very well, 30% speak English well, 9% speak English not well).
0.2% of residents speak other language at home (24% speak English very well, 65% speak English well, 11% speak English not well).
In fiscal year 2004:
Federal Government expenditure: $172,960,000 ($3,075 per capita)
Department of Defense expenditure: $28,562,000
Federal direct payments to individuals for retirement and disability: $70,526,000
Federal other direct payments to individuals: $34,838,000
Federal direct payments not to individuals: $740,000
Federal grants: $30,625,000
Federal procurement contracts: $27,265,000 ($24,769,000 Department of Defense)
Federal salaries and wages: $8,966,000 ($62,000 Department of Defense)
Federal Government direct loans: $224,000
Federal guaranteed/insured loans: $5,652,000
Federal Government insurance: $40,407,000
Population change from April 1, 2000 to July 1, 2005:
Births: 4,675| Here: | 84 per 1000 residents |
| State: | 77 per 1000 residents |
Deaths: 1,388
| Here: | 25 per 1000 residents |
| State: | 34 per 1000 residents |
Net international migration: +1,815
| Here: | +32 per 1000 residents |
| State: | +39 per 1000 residents |
Net internal migration: -2,302
| Here: | |
| State: |
Total withdrawal of fresh water for public supply: 6.30 millions of gallons per day (all from ground)
| Here: | 6.5 |
| State: | 6.0 |
| Here: | 4.3 |
| State: | 3.9 |
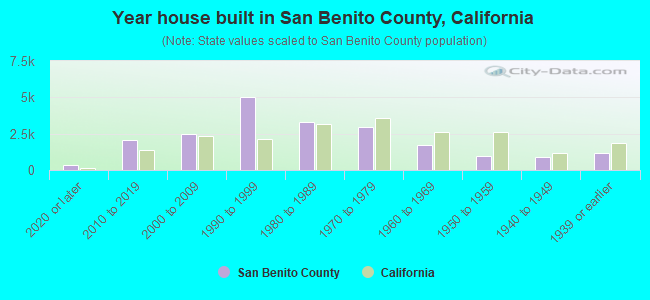
- Year house built in San Benito County, California
- 4112020 or later
- 3,4732010 to 2019
- 3,2972000 to 2009
- 3,2931990 to 1999
- 3,6921980 to 1989
- 2,5491970 to 1979
- 1,5381960 to 1969
- 1,1411950 to 1959
- 4661940 to 1949
- 1,5771939 or earlier
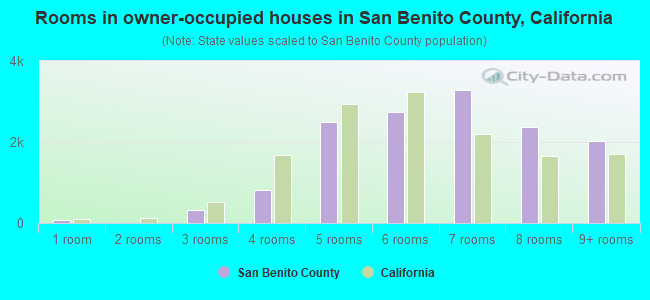
- Rooms in owner-occupied houses in San Benito County, California
- 211 room
- 3282 rooms
- 6373 rooms
- 7714 rooms
- 2,4885 rooms
- 2,9526 rooms
- 2,9527 rooms
- 2,3358 rooms
- 2,0299+ rooms
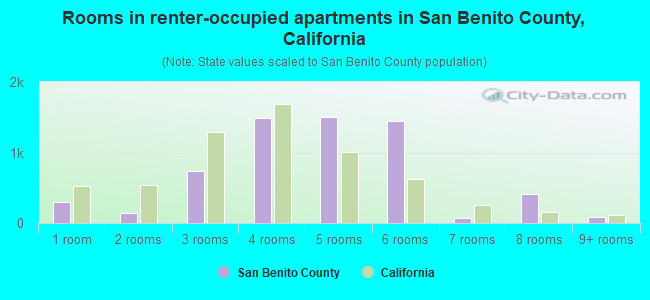
- Rooms in renter-occupied apartments in San Benito County, California
- 1071 room
- 4252 rooms
- 9283 rooms
- 1,9034 rooms
- 2695 rooms
- 1,5036 rooms
- 3357 rooms
- 5418 rooms
- 869+ rooms
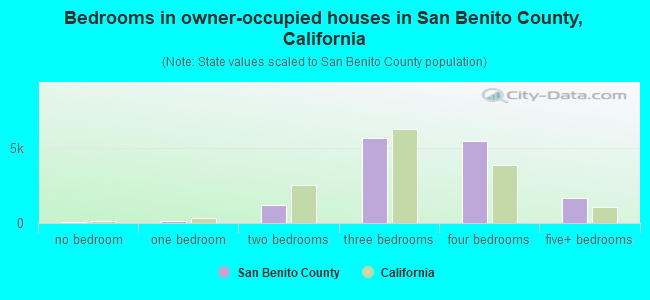
- Bedrooms in owner-occupied houses in San Benito County, California
- 21no bedroom
- 4261 bedroom
- 1,3902 bedrooms
- 6,4963 bedrooms
- 4,7244 bedrooms
- 1,4565+ bedrooms
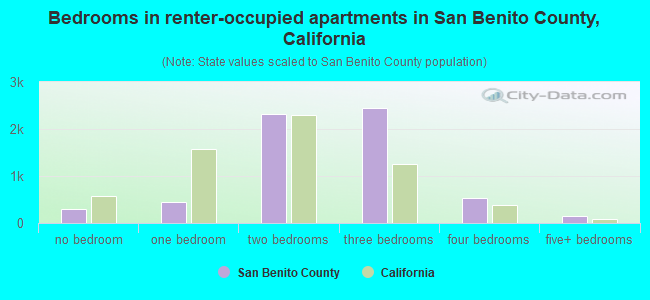
- Bedrooms in renter-occupied apartments in San Benito County, California
- 107no bedroom
- 1,0381 bedroom
- 2,2442 bedrooms
- 1,4413 bedrooms
- 1,2244 bedrooms
- 435+ bedrooms
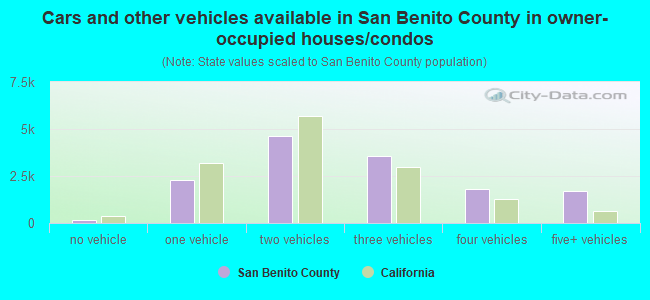
- Cars and other vehicles available in San Benito County in owner-occupied houses/condos
- 228no vehicle
- 1,7421 vehicle
- 7,2352 vehicles
- 2,2663 vehicles
- 1,6994 vehicles
- 1,3435+ vehicles
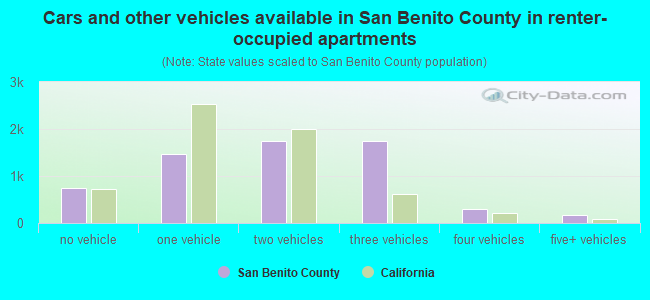
- Cars and other vehicles available in San Benito County in renter-occupied apartments
- 185no vehicle
- 1,2511 vehicle
- 2,7102 vehicles
- 1,4263 vehicles
- 4764 vehicles
- 495+ vehicles
90.6% of San Benito County residents lived in the same house 1 years ago.
Out of people who lived in different houses, 29% lived in this county.
Out of people who lived in different counties, 92% lived in California.
| San Benito County: | 90.6% |
| State average: | 88.9% |
Place of birth for U.S.-born residents:
- This state: 46,389
- Other state: 6,890
- Northeast: 585
- Midwest: 1,686
- South: 2,120
- West: 2,499
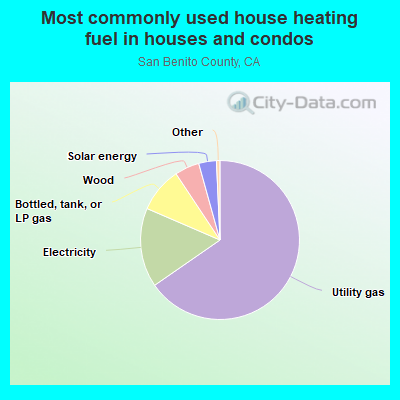
- 65.2%Utility gas
- 16.3%Electricity
- 9.5%Bottled, tank, or LP gas
- 4.8%Wood
- 3.8%Solar energy
- 0.2%No fuel used
- 0.2%Fuel oil, kerosene, etc.
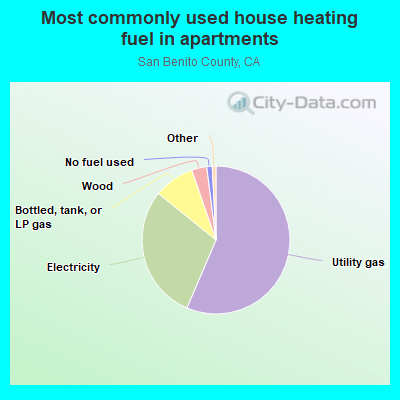
- 56.2%Utility gas
- 32.0%Electricity
- 7.3%Bottled, tank, or LP gas
- 2.7%Wood
- 0.9%No fuel used
- 0.5%Solar energy
- 0.4%Other fuel
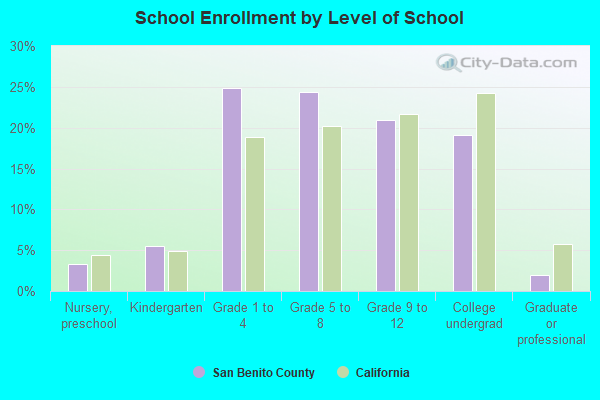
Private vs. public school enrollment:
| Here: | 2.0% |
| California: | 10.5% |
| Here: | 3.0% |
| California: | 8.5% |
| Here: | 5.9% |
| California: | 15.9% |

San Benito County government finances - Expenditure in 2018:
- Assistance and Subsidies - Public Welfare, Cash Assistance Programs - Other: $413,000
Public Welfare, Cash Assistance Programs - Other: $404,000
- Charges - Other: $10,276,000
Other: $5,134,000
Solid Waste Management: $1,700,000
Solid Waste Management: $1,249,000
Natural Resources - Other: $311,000
Natural Resources - Other: $279,000
Elementary and Secondary Education - Other: $72,000
Parks and Recreation: $69,000
Regular Highways: $42,000
Parks and Recreation: $40,000
Regular Highways: $33,000
Elementary and Secondary Education - Other: $21,000
Elementary and Secondary Education School Lunch: $8,000
Elementary and Secondary Education School Lunch: $4,000
- Construction - Elementary and Secondary Education: $106,000
- Current Operations - Public Welfare - Other: $22,668,000
Public Welfare - Other: $20,637,000
Health - Other: $14,169,000
Elementary and Secondary Education: $10,999,000
Health - Other: $10,806,000
Elementary and Secondary Education: $9,508,000
Correctional Institutions: $8,760,000
Police Protection: $8,211,000
Central Staff Services: $7,799,000
General - Other: $7,688,000
Correctional Institutions: $7,338,000
Police Protection: $7,162,000
Central Staff Services: $5,369,000
General - Other: $5,106,000
Judicial and Legal Services: $4,956,000
Regular Highways: $4,804,000
Financial Administration: $4,562,000
Judicial and Legal Services: $4,517,000
Corrections - Other: $3,266,000
Corrections - Other: $3,088,000
Financial Administration: $2,808,000
Regular Highways: $2,214,000
Protective Inspection and Regulation - Other: $1,876,000
Protective Inspection and Regulation - Other: $1,690,000
Local Fire Protection: $1,270,000
Libraries: $1,238,000
Solid Waste Management: $1,064,000
Natural Resources - Other: $1,013,000
Libraries: $998,000
Natural Resources - Other: $936,000
Solid Waste Management: $735,000
Transit Utilities: $431,000
Transit Utilities: $309,000
Parks and Recreation: $251,000
Parks and Recreation: $143,000
- Federal Intergovernmental - Other: $2,255,000
Highways: $1,982,000
Other: $1,861,000
General Local Government Support: $298,000
General Local Government Support: $280,000
Highways: $238,000
Housing and Community Development: $172,000
Housing and Community Development: $155,000
Transit Utilities: $50,000
Education: $38,000
Education: $27,000
- General - Interest on Debt: $673,000
- Intergovernmental to Local - Other - Elementary and Secondary Education: $4,400,000
Other - Elementary and Secondary Education: $3,777,000
- Intergovernmental to State - Judicial and Legal Services: $271,000
Judicial and Legal Services: $271,000
- Local Intergovernmental - Education: $4,790,000
Education: $4,352,000
Other: $265,000
Other: $76,000
- Long Term Debt - Outstanding Unspecified Public Purpose: $26,852,000
Beginning Outstanding - Unspecified Public Purpose: $16,830,000
Issue, Unspecified Public Purpose: $10,190,000
Retired Unspecified Public Purpose: $168,000
- Miscellaneous - Special Assessments: $8,419,000
Special Assessments: $4,373,000
Fines and Forfeits: $3,101,000
General Revenue - Other: $2,649,000
Interest Earnings: $2,637,000
General Revenue - Other: $598,000
Fines and Forfeits: $380,000
Rents: $158,000
Donations From Private Sources: $1,000
Interest Earnings: $-1,123,000
- Other Capital Outlay - Regular Highways: $9,905,000
Police Protection: $2,814,000
Correctional Institutions: $1,815,000
Health - Other: $1,606,000
Regular Highways: $541,000
Financial Administration: $533,000
Public Welfare - Other: $155,000
Elementary and Secondary Education: $21,000
Elementary and Secondary Education: $19,000
Public Welfare - Other: $12,000
Central Staff Services: $7,000
Local Fire Protection: $4,000
Solid Waste Management: $2,000
Solid Waste Management: $2,000
- Other Funds - Cash and Securities: $13,489,000
Cash and Securities: $12,539,000
- State Intergovernmental - Public Welfare: $31,493,000
Public Welfare: $26,972,000
Other: $15,337,000
Other: $12,761,000
Education: $10,060,000
Education: $8,658,000
Health and Hospitals: $8,543,000
Health and Hospitals: $8,145,000
Highways: $4,500,000
Highways: $2,726,000
Transit Utilities: $416,000
Transit Utilities: $300,000
General Local Government Support: $198,000
General Local Government Support: $157,000
- Tax - Property: $20,807,000
Property: $18,706,000
General Sales and Gross Receipts: $3,475,000
General Sales and Gross Receipts: $2,199,000
Occupation and Business License - Other: $1,920,000
Other License: $929,000
Occupation and Business License - Other: $848,000
Documentary and Stock Transfer: $647,000
Documentary and Stock Transfer: $610,000
Other License: $513,000
Public Utilities Sales: $488,000
Public Utilities Sales: $299,000
Other Selective Sales: $205,000
Other Selective Sales: $119,000
- Total Salaries and Wages: $5,470,000
: $4,686,000
San Benito County government finances - Revenue in 2018:
- Assistance and Subsidies - Public Welfare, Cash Assistance Programs - Other: $413,000
Public Welfare, Cash Assistance Programs - Other: $404,000
- Charges - Other: $10,276,000
Other: $5,134,000
Solid Waste Management: $1,700,000
Solid Waste Management: $1,249,000
Natural Resources - Other: $311,000
Natural Resources - Other: $279,000
Elementary and Secondary Education - Other: $72,000
Parks and Recreation: $69,000
Regular Highways: $42,000
Parks and Recreation: $40,000
Regular Highways: $33,000
Elementary and Secondary Education - Other: $21,000
Elementary and Secondary Education School Lunch: $8,000
Elementary and Secondary Education School Lunch: $4,000
- Construction - Elementary and Secondary Education: $106,000
- Current Operations - Public Welfare - Other: $22,668,000
Public Welfare - Other: $20,637,000
Health - Other: $14,169,000
Elementary and Secondary Education: $10,999,000
Health - Other: $10,806,000
Elementary and Secondary Education: $9,508,000
Correctional Institutions: $8,760,000
Police Protection: $8,211,000
Central Staff Services: $7,799,000
General - Other: $7,688,000
Correctional Institutions: $7,338,000
Police Protection: $7,162,000
Central Staff Services: $5,369,000
General - Other: $5,106,000
Judicial and Legal Services: $4,956,000
Regular Highways: $4,804,000
Financial Administration: $4,562,000
Judicial and Legal Services: $4,517,000
Corrections - Other: $3,266,000
Corrections - Other: $3,088,000
Financial Administration: $2,808,000
Regular Highways: $2,214,000
Protective Inspection and Regulation - Other: $1,876,000
Protective Inspection and Regulation - Other: $1,690,000
Local Fire Protection: $1,270,000
Libraries: $1,238,000
Solid Waste Management: $1,064,000
Natural Resources - Other: $1,013,000
Libraries: $998,000
Natural Resources - Other: $936,000
Solid Waste Management: $735,000
Transit Utilities: $431,000
Transit Utilities: $309,000
Parks and Recreation: $251,000
Parks and Recreation: $143,000
- Federal Intergovernmental - Other: $2,255,000
Highways: $1,982,000
Other: $1,861,000
General Local Government Support: $298,000
General Local Government Support: $280,000
Highways: $238,000
Housing and Community Development: $172,000
Housing and Community Development: $155,000
Transit Utilities: $50,000
Education: $38,000
Education: $27,000
- General - Interest on Debt: $673,000
- Intergovernmental to Local - Other - Elementary and Secondary Education: $4,400,000
Other - Elementary and Secondary Education: $3,777,000
- Intergovernmental to State - Judicial and Legal Services: $271,000
Judicial and Legal Services: $271,000
- Local Intergovernmental - Education: $4,790,000
Education: $4,352,000
Other: $265,000
Other: $76,000
- Long Term Debt - Outstanding Unspecified Public Purpose: $26,852,000
Beginning Outstanding - Unspecified Public Purpose: $16,830,000
Issue, Unspecified Public Purpose: $10,190,000
Retired Unspecified Public Purpose: $168,000
- Miscellaneous - Special Assessments: $8,419,000
Special Assessments: $4,373,000
Fines and Forfeits: $3,101,000
General Revenue - Other: $2,649,000
Interest Earnings: $2,637,000
General Revenue - Other: $598,000
Fines and Forfeits: $380,000
Rents: $158,000
Donations From Private Sources: $1,000
Interest Earnings: $-1,123,000
- Other Capital Outlay - Regular Highways: $9,905,000
Police Protection: $2,814,000
Correctional Institutions: $1,815,000
Health - Other: $1,606,000
Regular Highways: $541,000
Financial Administration: $533,000
Public Welfare - Other: $155,000
Elementary and Secondary Education: $21,000
Elementary and Secondary Education: $19,000
Public Welfare - Other: $12,000
Central Staff Services: $7,000
Local Fire Protection: $4,000
Solid Waste Management: $2,000
Solid Waste Management: $2,000
- Other Funds - Cash and Securities: $13,489,000
Cash and Securities: $12,539,000
- State Intergovernmental - Public Welfare: $31,493,000
Public Welfare: $26,972,000
Other: $15,337,000
Other: $12,761,000
Education: $10,060,000
Education: $8,658,000
Health and Hospitals: $8,543,000
Health and Hospitals: $8,145,000
Highways: $4,500,000
Highways: $2,726,000
Transit Utilities: $416,000
Transit Utilities: $300,000
General Local Government Support: $198,000
General Local Government Support: $157,000
- Tax - Property: $20,807,000
Property: $18,706,000
General Sales and Gross Receipts: $3,475,000
General Sales and Gross Receipts: $2,199,000
Occupation and Business License - Other: $1,920,000
Other License: $929,000
Occupation and Business License - Other: $848,000
Documentary and Stock Transfer: $647,000
Documentary and Stock Transfer: $610,000
Other License: $513,000
Public Utilities Sales: $488,000
Public Utilities Sales: $299,000
Other Selective Sales: $205,000
Other Selective Sales: $119,000
- Total Salaries and Wages: $5,470,000
: $4,686,000
San Benito County government finances - Debt in 2018:
- Assistance and Subsidies - Public Welfare, Cash Assistance Programs - Other: $413,000
Public Welfare, Cash Assistance Programs - Other: $404,000
- Charges - Other: $10,276,000
Other: $5,134,000
Solid Waste Management: $1,700,000
Solid Waste Management: $1,249,000
Natural Resources - Other: $311,000
Natural Resources - Other: $279,000
Elementary and Secondary Education - Other: $72,000
Parks and Recreation: $69,000
Regular Highways: $42,000
Parks and Recreation: $40,000
Regular Highways: $33,000
Elementary and Secondary Education - Other: $21,000
Elementary and Secondary Education School Lunch: $8,000
Elementary and Secondary Education School Lunch: $4,000
- Construction - Elementary and Secondary Education: $106,000
- Current Operations - Public Welfare - Other: $22,668,000
Public Welfare - Other: $20,637,000
Health - Other: $14,169,000
Elementary and Secondary Education: $10,999,000
Health - Other: $10,806,000
Elementary and Secondary Education: $9,508,000
Correctional Institutions: $8,760,000
Police Protection: $8,211,000
Central Staff Services: $7,799,000
General - Other: $7,688,000
Correctional Institutions: $7,338,000
Police Protection: $7,162,000
Central Staff Services: $5,369,000
General - Other: $5,106,000
Judicial and Legal Services: $4,956,000
Regular Highways: $4,804,000
Financial Administration: $4,562,000
Judicial and Legal Services: $4,517,000
Corrections - Other: $3,266,000
Corrections - Other: $3,088,000
Financial Administration: $2,808,000
Regular Highways: $2,214,000
Protective Inspection and Regulation - Other: $1,876,000
Protective Inspection and Regulation - Other: $1,690,000
Local Fire Protection: $1,270,000
Libraries: $1,238,000
Solid Waste Management: $1,064,000
Natural Resources - Other: $1,013,000
Libraries: $998,000
Natural Resources - Other: $936,000
Solid Waste Management: $735,000
Transit Utilities: $431,000
Transit Utilities: $309,000
Parks and Recreation: $251,000
Parks and Recreation: $143,000
- Federal Intergovernmental - Other: $2,255,000
Highways: $1,982,000
Other: $1,861,000
General Local Government Support: $298,000
General Local Government Support: $280,000
Highways: $238,000
Housing and Community Development: $172,000
Housing and Community Development: $155,000
Transit Utilities: $50,000
Education: $38,000
Education: $27,000
- General - Interest on Debt: $673,000
- Intergovernmental to Local - Other - Elementary and Secondary Education: $4,400,000
Other - Elementary and Secondary Education: $3,777,000
- Intergovernmental to State - Judicial and Legal Services: $271,000
Judicial and Legal Services: $271,000
- Local Intergovernmental - Education: $4,790,000
Education: $4,352,000
Other: $265,000
Other: $76,000
- Long Term Debt - Outstanding Unspecified Public Purpose: $26,852,000
Beginning Outstanding - Unspecified Public Purpose: $16,830,000
Issue, Unspecified Public Purpose: $10,190,000
Retired Unspecified Public Purpose: $168,000
- Miscellaneous - Special Assessments: $8,419,000
Special Assessments: $4,373,000
Fines and Forfeits: $3,101,000
General Revenue - Other: $2,649,000
Interest Earnings: $2,637,000
General Revenue - Other: $598,000
Fines and Forfeits: $380,000
Rents: $158,000
Donations From Private Sources: $1,000
Interest Earnings: $-1,123,000
- Other Capital Outlay - Regular Highways: $9,905,000
Police Protection: $2,814,000
Correctional Institutions: $1,815,000
Health - Other: $1,606,000
Regular Highways: $541,000
Financial Administration: $533,000
Public Welfare - Other: $155,000
Elementary and Secondary Education: $21,000
Elementary and Secondary Education: $19,000
Public Welfare - Other: $12,000
Central Staff Services: $7,000
Local Fire Protection: $4,000
Solid Waste Management: $2,000
Solid Waste Management: $2,000
- Other Funds - Cash and Securities: $13,489,000
Cash and Securities: $12,539,000
- State Intergovernmental - Public Welfare: $31,493,000
Public Welfare: $26,972,000
Other: $15,337,000
Other: $12,761,000
Education: $10,060,000
Education: $8,658,000
Health and Hospitals: $8,543,000
Health and Hospitals: $8,145,000
Highways: $4,500,000
Highways: $2,726,000
Transit Utilities: $416,000
Transit Utilities: $300,000
General Local Government Support: $198,000
General Local Government Support: $157,000
- Tax - Property: $20,807,000
Property: $18,706,000
General Sales and Gross Receipts: $3,475,000
General Sales and Gross Receipts: $2,199,000
Occupation and Business License - Other: $1,920,000
Other License: $929,000
Occupation and Business License - Other: $848,000
Documentary and Stock Transfer: $647,000
Documentary and Stock Transfer: $610,000
Other License: $513,000
Public Utilities Sales: $488,000
Public Utilities Sales: $299,000
Other Selective Sales: $205,000
Other Selective Sales: $119,000
- Total Salaries and Wages: $5,470,000
: $4,686,000
San Benito County government finances - Cash and Securities in 2018:
- Assistance and Subsidies - Public Welfare, Cash Assistance Programs - Other: $413,000
Public Welfare, Cash Assistance Programs - Other: $404,000
- Charges - Other: $10,276,000
Other: $5,134,000
Solid Waste Management: $1,700,000
Solid Waste Management: $1,249,000
Natural Resources - Other: $311,000
Natural Resources - Other: $279,000
Elementary and Secondary Education - Other: $72,000
Parks and Recreation: $69,000
Regular Highways: $42,000
Parks and Recreation: $40,000
Regular Highways: $33,000
Elementary and Secondary Education - Other: $21,000
Elementary and Secondary Education School Lunch: $8,000
Elementary and Secondary Education School Lunch: $4,000
- Construction - Elementary and Secondary Education: $106,000
- Current Operations - Public Welfare - Other: $22,668,000
Public Welfare - Other: $20,637,000
Health - Other: $14,169,000
Elementary and Secondary Education: $10,999,000
Health - Other: $10,806,000
Elementary and Secondary Education: $9,508,000
Correctional Institutions: $8,760,000
Police Protection: $8,211,000
Central Staff Services: $7,799,000
General - Other: $7,688,000
Correctional Institutions: $7,338,000
Police Protection: $7,162,000
Central Staff Services: $5,369,000
General - Other: $5,106,000
Judicial and Legal Services: $4,956,000
Regular Highways: $4,804,000
Financial Administration: $4,562,000
Judicial and Legal Services: $4,517,000
Corrections - Other: $3,266,000
Corrections - Other: $3,088,000
Financial Administration: $2,808,000
Regular Highways: $2,214,000
Protective Inspection and Regulation - Other: $1,876,000
Protective Inspection and Regulation - Other: $1,690,000
Local Fire Protection: $1,270,000
Libraries: $1,238,000
Solid Waste Management: $1,064,000
Natural Resources - Other: $1,013,000
Libraries: $998,000
Natural Resources - Other: $936,000
Solid Waste Management: $735,000
Transit Utilities: $431,000
Transit Utilities: $309,000
Parks and Recreation: $251,000
Parks and Recreation: $143,000
- Federal Intergovernmental - Other: $2,255,000
Highways: $1,982,000
Other: $1,861,000
General Local Government Support: $298,000
General Local Government Support: $280,000
Highways: $238,000
Housing and Community Development: $172,000
Housing and Community Development: $155,000
Transit Utilities: $50,000
Education: $38,000
Education: $27,000
- General - Interest on Debt: $673,000
- Intergovernmental to Local - Other - Elementary and Secondary Education: $4,400,000
Other - Elementary and Secondary Education: $3,777,000
- Intergovernmental to State - Judicial and Legal Services: $271,000
Judicial and Legal Services: $271,000
- Local Intergovernmental - Education: $4,790,000
Education: $4,352,000
Other: $265,000
Other: $76,000
- Long Term Debt - Outstanding Unspecified Public Purpose: $26,852,000
Beginning Outstanding - Unspecified Public Purpose: $16,830,000
Issue, Unspecified Public Purpose: $10,190,000
Retired Unspecified Public Purpose: $168,000
- Miscellaneous - Special Assessments: $8,419,000
Special Assessments: $4,373,000
Fines and Forfeits: $3,101,000
General Revenue - Other: $2,649,000
Interest Earnings: $2,637,000
General Revenue - Other: $598,000
Fines and Forfeits: $380,000
Rents: $158,000
Donations From Private Sources: $1,000
Interest Earnings: $-1,123,000
- Other Capital Outlay - Regular Highways: $9,905,000
Police Protection: $2,814,000
Correctional Institutions: $1,815,000
Health - Other: $1,606,000
Regular Highways: $541,000
Financial Administration: $533,000
Public Welfare - Other: $155,000
Elementary and Secondary Education: $21,000
Elementary and Secondary Education: $19,000
Public Welfare - Other: $12,000
Central Staff Services: $7,000
Local Fire Protection: $4,000
Solid Waste Management: $2,000
Solid Waste Management: $2,000
- Other Funds - Cash and Securities: $13,489,000
Cash and Securities: $12,539,000
- State Intergovernmental - Public Welfare: $31,493,000
Public Welfare: $26,972,000
Other: $15,337,000
Other: $12,761,000
Education: $10,060,000
Education: $8,658,000
Health and Hospitals: $8,543,000
Health and Hospitals: $8,145,000
Highways: $4,500,000
Highways: $2,726,000
Transit Utilities: $416,000
Transit Utilities: $300,000
General Local Government Support: $198,000
General Local Government Support: $157,000
- Tax - Property: $20,807,000
Property: $18,706,000
General Sales and Gross Receipts: $3,475,000
General Sales and Gross Receipts: $2,199,000
Occupation and Business License - Other: $1,920,000
Other License: $929,000
Occupation and Business License - Other: $848,000
Documentary and Stock Transfer: $647,000
Documentary and Stock Transfer: $610,000
Other License: $513,000
Public Utilities Sales: $488,000
Public Utilities Sales: $299,000
Other Selective Sales: $205,000
Other Selective Sales: $119,000
- Total Salaries and Wages: $5,470,000
: $4,686,000
Supplemental Security Income (SSI) in 2006:
- Total number of recipients: 854
- Number of aged recipients: 265
- Number of blind and disabled recipients: 589
- Number of recipients under 18: 67
- Number of recipients between 18 and 64: 418
- Number of recipients older than 64: 369
- Number of recipients also receiving OASDI: 510
- Amount of payments (thousands of dollars): 397
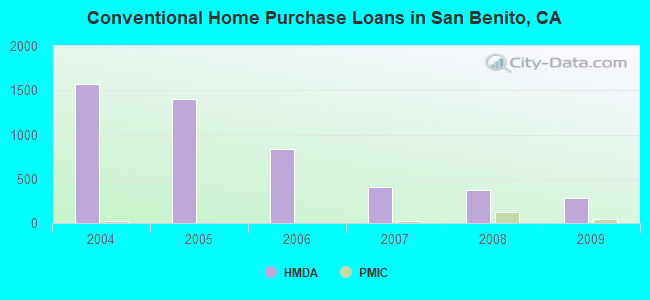
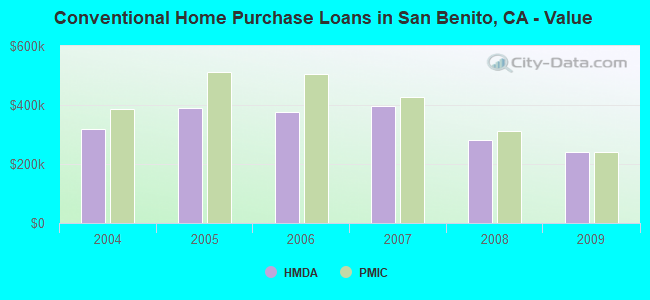
| Home Mortgage Disclosure Act Aggregated Statistics For Year 2009 (Based on 8 full tracts) | ||||||||||||
| A) FHA, FSA/RHS & VA Home Purchase Loans | B) Conventional Home Purchase Loans | C) Refinancings | D) Home Improvement Loans | F) Non-occupant Loans on < 5 Family Dwellings (A B C & D) | G) Loans On Manufactured Home Dwelling (A B C & D) | |||||||
|---|---|---|---|---|---|---|---|---|---|---|---|---|
| Number | Average Value | Number | Average Value | Number | Average Value | Number | Average Value | Number | Average Value | Number | Average Value | |
| LOANS ORIGINATED | 368 | $264,565 | 288 | $239,681 | 650 | $287,612 | 12 | $201,250 | 105 | $214,267 | 8 | $240,375 |
| APPLICATIONS APPROVED, NOT ACCEPTED | 26 | $237,846 | 37 | $295,514 | 56 | $288,786 | 4 | $197,750 | 14 | $241,214 | 1 | $81,000 |
| APPLICATIONS DENIED | 64 | $276,062 | 68 | $228,529 | 404 | $326,800 | 15 | $134,733 | 64 | $234,844 | 10 | $145,700 |
| APPLICATIONS WITHDRAWN | 44 | $277,977 | 45 | $233,800 | 145 | $322,497 | 4 | $169,500 | 25 | $209,240 | 0 | $0 |
| FILES CLOSED FOR INCOMPLETENESS | 15 | $252,867 | 9 | $238,556 | 57 | $316,632 | 3 | $361,333 | 1 | $100,000 | 0 | $0 |
| Private Mortgage Insurance Companies Aggregated Statistics For Year 2009 (Based on 8 full tracts) | ||||||
| A) Conventional Home Purchase Loans | B) Refinancings | D) Loans On Manufactured Home Dwelling (A & B) | ||||
|---|---|---|---|---|---|---|
| Number | Average Value | Number | Average Value | Number | Average Value | |
| LOANS ORIGINATED | 50 | $241,740 | 7 | $279,429 | 1 | $200,000 |
| APPLICATIONS APPROVED, NOT ACCEPTED | 23 | $276,000 | 5 | $328,200 | 0 | $0 |
| APPLICATIONS DENIED | 5 | $232,800 | 4 | $320,500 | 0 | $0 |
| APPLICATIONS WITHDRAWN | 2 | $209,500 | 1 | $349,000 | 0 | $0 |
| FILES CLOSED FOR INCOMPLETENESS | 2 | $308,000 | 0 | $0 | 0 | $0 |
| Most common first names in San Benito County, CA among deceased individuals | ||
| Name | Count | Lived (average) |
|---|---|---|
| John | 160 | 76.9 years |
| Mary | 157 | 80.2 years |
| Frank | 112 | 79.0 years |
| Robert | 105 | 70.2 years |
| James | 104 | 71.5 years |
| William | 104 | 77.4 years |
| Joseph | 89 | 77.3 years |
| Maria | 86 | 77.6 years |
| George | 80 | 76.8 years |
| Helen | 67 | 81.2 years |
| Most common last names in San Benito County, CA among deceased individuals | ||
| Last name | Count | Lived (average) |
|---|---|---|
| Garcia | 69 | 77.3 years |
| Smith | 58 | 78.1 years |
| Sanchez | 48 | 73.2 years |
| Martinez | 48 | 70.9 years |
| Rodriguez | 43 | 73.5 years |
| Johnson | 37 | 80.9 years |
| Miller | 35 | 77.2 years |
| Martin | 33 | 77.4 years |
| Anderson | 31 | 75.6 years |
| Lopez | 30 | 69.9 years |
| Businesses in San Benito County, CA | ||||
| Name | Count | Name | Count | |
|---|---|---|---|---|
| 7-Eleven | 1 | Little Caesars Pizza | 1 | |
| AT&T | 1 | McDonald's | 2 | |
| Ace Hardware | 1 | Nike | 2 | |
| AutoZone | 1 | Payless | 1 | |
| Baskin-Robbins | 1 | Quiznos | 1 | |
| Best Western | 1 | RadioShack | 1 | |
| Blockbuster | 1 | Rite Aid | 1 | |
| Burger King | 1 | Sears | 1 | |
| Chevrolet | 1 | Staples | 1 | |
| Curves | 1 | Starbucks | 3 | |
| Domino's Pizza | 1 | Subway | 3 | |
| FedEx | 3 | Taco Bell | 2 | |
| Ford | 1 | Target | 1 | |
| GNC | 1 | True Value | 1 | |
| H&R Block | 1 | U-Haul | 3 | |
| Jack In The Box | 1 | UPS | 6 | |
| Jones New York | 1 | Vans | 1 | |
| KFC | 1 | Verizon Wireless | 2 | |
| Kmart | 1 | Vons | 1 | |
| Kroger | 2 | YMCA | 1 | |
| Lane Furniture | 1 | |||
San Benito County on our top lists:
- #22 on the list of "Top 101 counties with the lowest Particulate Matter (PM2.5) Annual air pollution readings in 2012 (µg/m3)"
- #36 on the list of "Top 101 counties with the lowest number of deaths per 1000 residents 2007-2013 (pop. 50,000+)"
- #61 on the list of "Top 101 counties with the largest number of children under 18 without health insurance coverage in 2000 (pop. 50,000+)"
- #93 on the list of "Top 101 counties with the lowest number of deaths per 1000 residents 2007-2013"