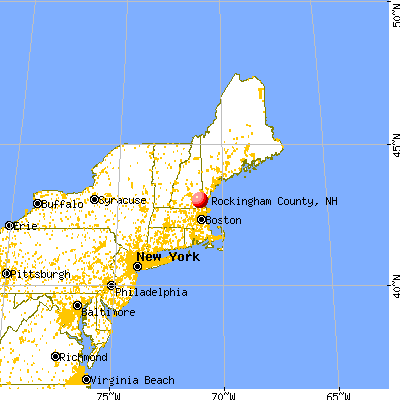
Rockingham County, New Hampshire (NH)
County owner-occupied free and clear houses and condos in 2010: 20,920
County owner-occupied houses and condos in 2000: 78,999
Renter-occupied apartments: 26,668 (it was 25,530 in 2000)
| % of renters here: | 24% |
| State: | 29% |
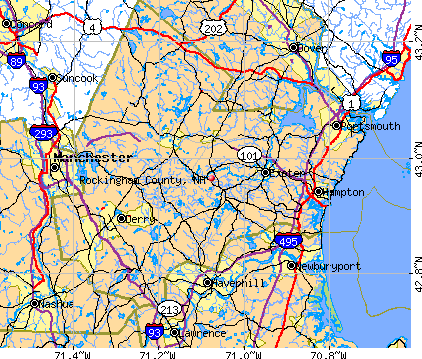
Land area: 695 sq. mi.
Water area: 99.0 sq. mi.
Population density: 460 people per square mile (high).
Industries providing employment: Educational, health and social services (23.9%), Professional, scientific, management, administrative, and waste management services (12.7%), Manufacturing (12.7%), Retail trade (12.4%).
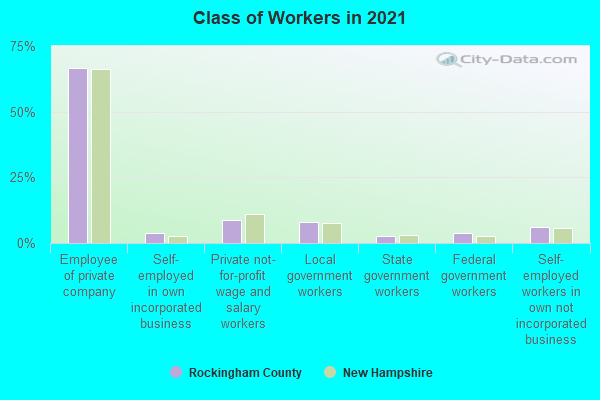
Type of workers:
- Private wage or salary: 81%
- Government: 13%
- Self-employed, not incorporated: 6%
- Unpaid family work: 0%
- OSM Map
- General Map
- Google Map
- MSN Map

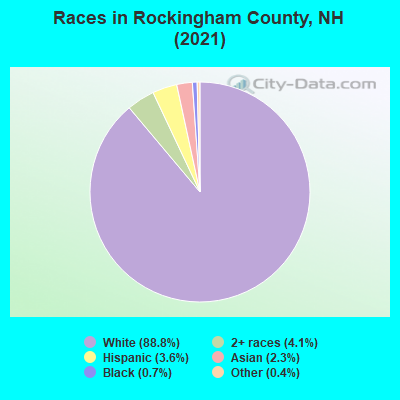
- 286,76989.8%White Non-Hispanic Alone
- 12,1023.8%Hispanic or Latino
- 9,7623.1%Two or more races
- 6,5272.0%Asian alone
- 2,3380.7%Black Non-Hispanic Alone
- 1,7990.6%Some other race alone
- 710.02%Native Hawaiian and Other
Pacific Islander alone - 560.02%American Indian and Alaska Native alone
| Median resident age: | 44.9 years |
| New Hampshire median age: | 43.3 years |
| Males: 158,660 | |
| Females: 160,764 |

 | Hollis, NH, to retire? is New Hampshire conservative (85 replies) |
| New Hampshire - Who Puts Voting Ballot in Box ? (25 replies) |
| Political climate in Portsmouth area (53 replies) |
| New Hampshire's first coronavirus case violated self-quarantine, exposed HUNDREDS! (134 replies) |
| Relocation suggestions (30 replies) |
| Looking for Horse Riding Opportunities (5 replies) |
| Rockingham County: | 2.0 people |
| New Hampshire: | 2 people |
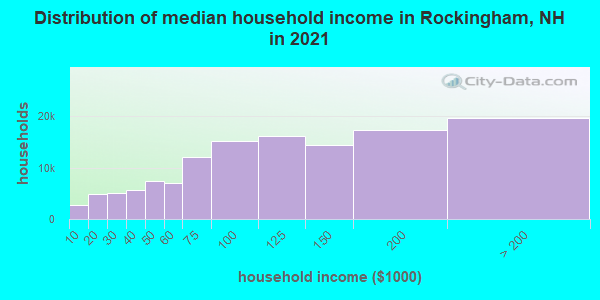
Estimated median household income in 2022: $107,442 ($58,150 in 1999)
| This county: | $107,442 |
| New Hampshire: | $89,992 |
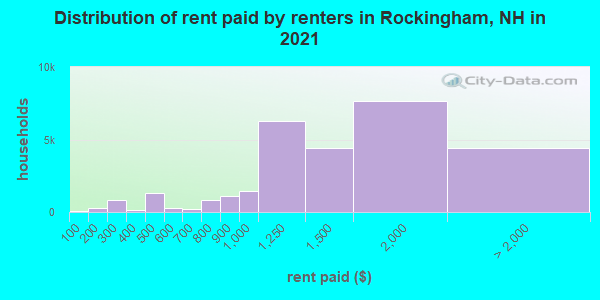
Median contract rent in 2022 for apartments: $1,440 (lower quartile is $1,122, upper quartile is $1,930)
| This county: | $1440 |
| State: | $1231 |
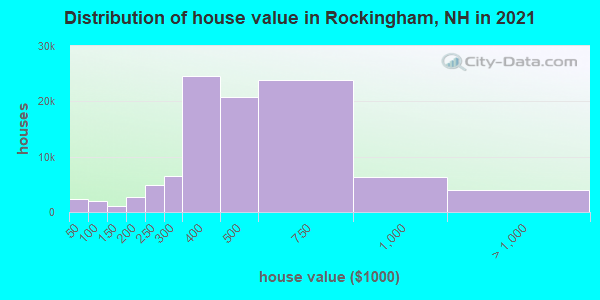
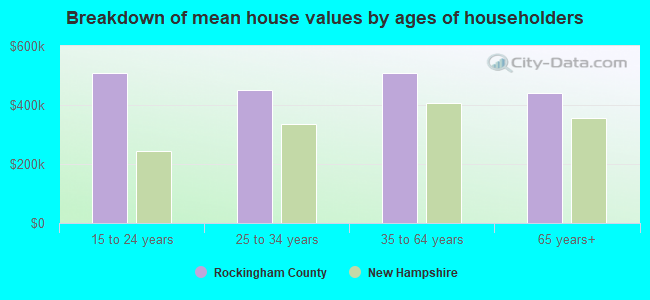
Estimated median house or condo value in 2022: $483,700 (it was $158,300 in 2000)
| Rockingham: | $483,700 |
| New Hampshire: | $384,700 |
Mean price in 2022:
Median monthly housing costs for homes and condos with a mortgage: $2,440Detached houses: $665,470
Here: $665,470 State: $491,479 Townhouses or other attached units: $408,866
Here: $408,866 State: $361,001 In 2-unit structures: $730,084
Here: $730,084 State: $368,847 In 3-to-4-unit structures: $1,020,944
Here: $1,020,944 State: $575,942 In 5-or-more-unit structures: $329,099
Here: $329,099 State: $274,068 Mobile homes: $126,160
Here: $126,160 State: $124,817
Median monthly housing costs for units without a mortgage: $1,088
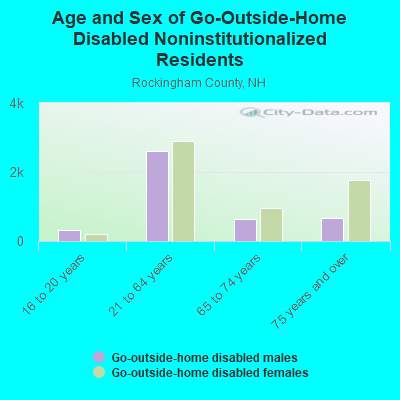
Institutionalized population: 1,438
Crime in 2021 (reported by the sheriff's office or county police, not the county total):
- Murders: 0
- Rapes: 2
- Robberies: 0
- Assaults: 7
- Burglaries: 1
- Thefts: 2
- Auto thefts: 0
Crime in 2020 (reported by the sheriff's office or county police, not the county total):
- Murders: 0
- Rapes: 1
- Robberies: 0
- Assaults: 4
- Burglaries: 0
- Thefts: 3
- Auto thefts: 1
Health of residents in Rockingham County based on CDC Behavioral Risk Factor Surveillance System Survey Questionnaires from 2003 to 2012:
General health status score of residents in this county from 1 (poor) to 5 (excellent) is 3.7. This is significantly better than average.78.9% of residents exercised in the past month. This is about average.
52.0% of residents smoked 100+ cigarettes in their lives. This is more than average.
82.2% of adult residents drank alcohol in the past 30 days. This is more than average.
79.5% of residents visited a dentist within the past year. This is more than average.
Average weight of males is 196 pounds. This is about average.
Average weight of females is 163 pounds. This is about average.
25.0% of residents keep firearms around their homes. This is about average.
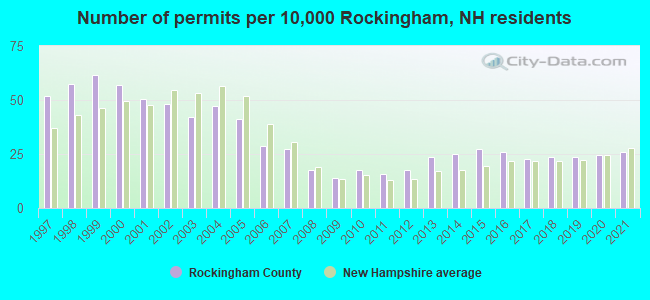
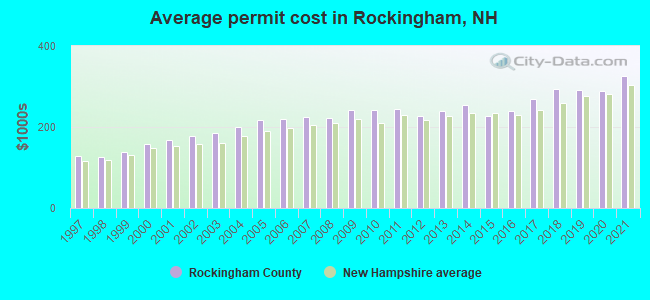
Single-family new house construction building permits:
- 2022: 631 buildings, average cost: $364,100
- 2021: 716 buildings, average cost: $325,000
- 2020: 684 buildings, average cost: $289,500
- 2019: 661 buildings, average cost: $292,300
- 2018: 652 buildings, average cost: $293,500
- 2017: 625 buildings, average cost: $269,500
- 2016: 718 buildings, average cost: $239,000
- 2015: 753 buildings, average cost: $226,300
- 2014: 698 buildings, average cost: $255,000
- 2013: 659 buildings, average cost: $238,600
- 2012: 493 buildings, average cost: $227,400
- 2011: 440 buildings, average cost: $244,100
- 2010: 483 buildings, average cost: $241,000
- 2009: 384 buildings, average cost: $240,600
- 2008: 486 buildings, average cost: $222,800
- 2007: 755 buildings, average cost: $224,100
- 2006: 801 buildings, average cost: $219,300
- 2005: 1140 buildings, average cost: $218,100
- 2004: 1308 buildings, average cost: $200,300
- 2003: 1164 buildings, average cost: $186,300
- 2002: 1332 buildings, average cost: $176,600
- 2001: 1395 buildings, average cost: $168,600
- 2000: 1579 buildings, average cost: $157,700
- 1999: 1707 buildings, average cost: $137,900
- 1998: 1589 buildings, average cost: $125,900
- 1997: 1435 buildings, average cost: $128,600
Median real estate property taxes paid for housing units with mortgages in 2022: $7,270 (1.5%)
Median real estate property taxes paid for housing units with no mortgage in 2022: $6,989 (1.6%)
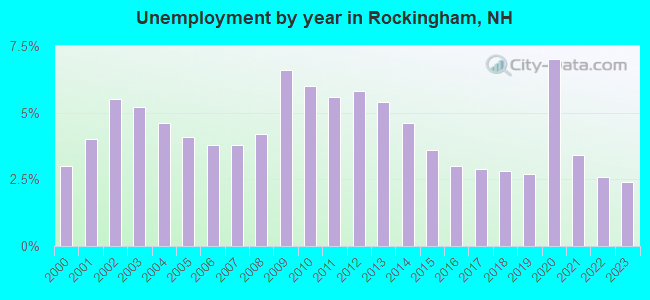
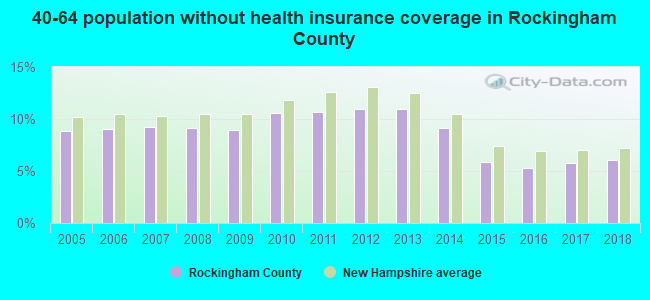
| Rockingham County: | 5.2% |
| New Hampshire: | 7.2% |
Median age of residents in 2022: 44.9 years old
(Males: 43.3 years old, Females: 46.3 years old)
(Median age for: White residents: 46.7 years old, Black residents: 40.1 years old, American Indian residents: 69.1 years old, Asian residents: 41.1 years old, Hispanic or Latino residents: 34.0 years old, Other race residents: 34.4 years old)
Area name: Lawrence, MA-NH HUD Metro FMR Area
Fair market rent in 2006 for a 1-bedroom apartment in Rockingham County is $862 a month.
Fair market rent for a 2-bedroom apartment is $1042 a month.
Fair market rent for a 3-bedroom apartment is $1244 a month.
Cities in this county include: Salem, Derry, Portsmouth, Londonderry, Windham, Exeter, Hampton, Hampstead, Seabrook, Plaistow.
2023 air pollution in Rockingham County:
Carbon Monoxide: 0.154 ppm (standard limit: 9 ppm). Near U.S. average.
Nitrogen Dioxide: 0.00 ppm (standard limit: 0.053 ppm). Below U.S. average.
Ozone (1-hour): 0.035 ppm (standard limit: 0.12 ppm). Near U.S. average.
Particulate Matter (PM10) Annual: 11.6 µg/m3. Near U.S. average.
Particulate Matter (PM2.5) Annual: 6.1 µg/m3(standard limit: 15.0 µg/m3). Near U.S. average.
Sulfur Oxides Annual: 0.001 ppm (standard limit: 0.03 ppm). Near U.S. average.
Neighboring counties: Cumberland County, Maine  , Crawford County, Wisconsin
  , Milwaukee County, Wisconsin , Rock County, Nebraska .
| Here: | 2.6% |
| New Hampshire: | 2.5% |
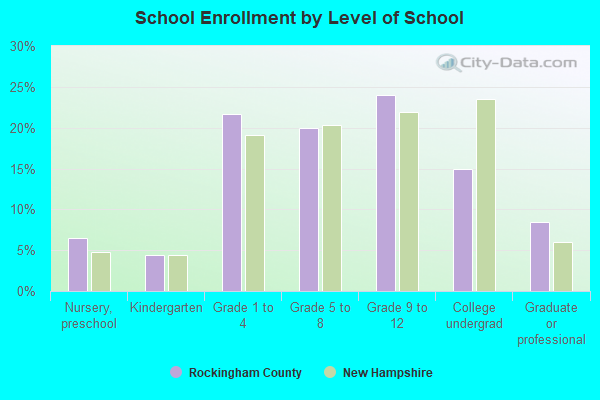
Current college students: 12,255
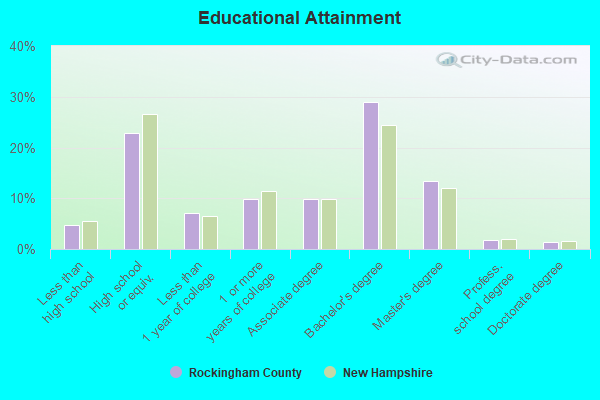
People 25 years of age or older with a high school degree or higher: 96.6%
People 25 years of age or older with a bachelor's degree or higher: 46.2%
Number of foreign born residents: 17,014 (65.0% naturalized citizens)
| Rockingham County: | 5.3% |
| Whole state: | 6.2% |
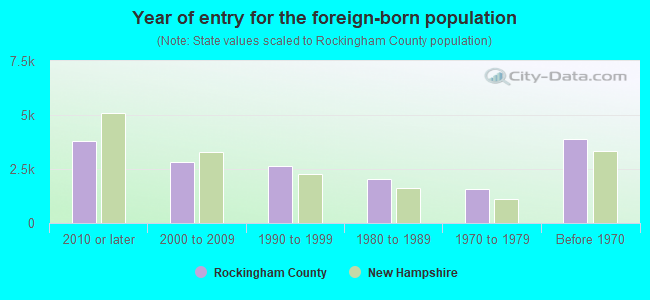
- Year of entry for the foreign-born population
- 4,0692010 or later
- 2,6352000 to 2009
- 3,7731990 to 1999
- 2,0211980 to 1989
- 1,5701970 to 1979
- 3,895Before 1970
Mean travel time to work (commute): minutes
Percentage of county residents living and working in this county: 78.4%
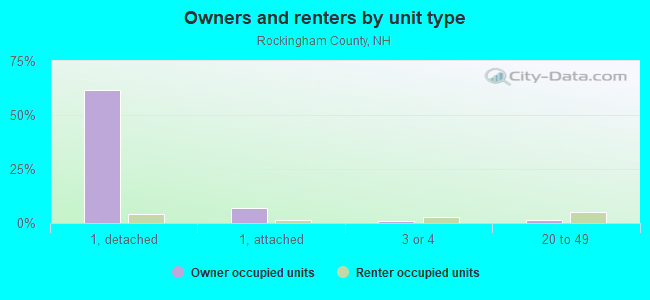
Housing units in structures:
- One, detached: 90,472
- One, attached: 11,282
- Two: 4,761
- 3 or 4: 3,957
- 5 to 9: 5,093
- 10 to 19: 5,715
- 20 to 49: 8,079
- 50 or more: 2,826
- Mobile homes: 5,610
Housing units in Rockingham County with a mortgage: 63,283 (8,257 second mortgage, 95 home equity loan, 7,607 both second mortgage and home equity loan)
Houses without a mortgage: 2,817
| Here: | 96.9% with mortgage |
| State: | 95.9% with mortgage |
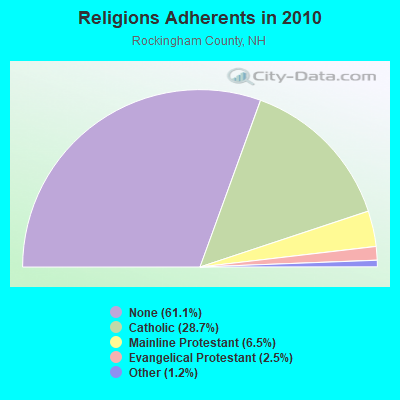
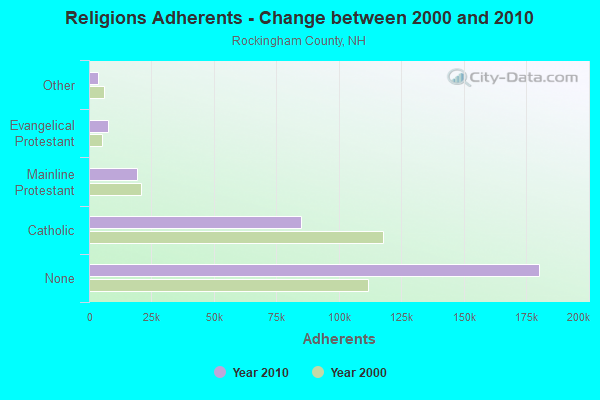
Religion statistics for Rockingham County
| Religion | Adherents | Congregations |
|---|---|---|
| Catholic | 84,697 | 24 |
| Mainline Protestant | 19,072 | 78 |
| Evangelical Protestant | 7,456 | 61 |
| Other | 3,490 | 20 |
| Orthodox | 200 | 1 |
| None | 180,308 | - |
Source: Clifford Grammich, Kirk Hadaway, Richard Houseal, Dale E.Jones, Alexei Krindatch, Richie Stanley and Richard H.Taylor. 2012. 2010 U.S.Religion Census: Religious Congregations & Membership Study. Association of Statisticians of American Religious Bodies. Jones, Dale E., et al. 2002. Congregations and Membership in the United States 2000. Nashville, TN: Glenmary Research Center.
Food Environment Statistics:
| Rockingham County: | 1.59 / 10,000 pop. |
| State: | 2.14 / 10,000 pop. |
| Here: | 0.17 / 10,000 pop. |
| New Hampshire: | 0.15 / 10,000 pop. |
| This county: | 1.86 / 10,000 pop. |
| New Hampshire: | 1.78 / 10,000 pop. |
| Rockingham County: | 3.31 / 10,000 pop. |
| New Hampshire: | 4.02 / 10,000 pop. |
| This county: | 9.56 / 10,000 pop. |
| State: | 9.70 / 10,000 pop. |
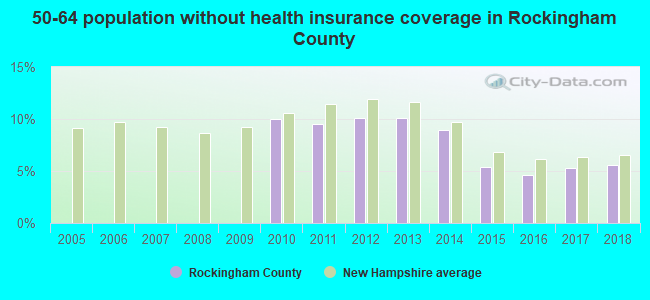
| Rockingham County: | 7.6% |
| New Hampshire: | 7.6% |
| Rockingham County: | 23.3% |
| State: | 24.4% |
| Here: | 16.8% |
| State: | 15.9% |
Agriculture in Rockingham County:
Average size of farms: 71 acresAverage value of agricultural products sold per farm: $38,101
Average value of crops sold per acre for harvested cropland: $1556.03
The value of nursery, greenhouse, floriculture, and sod as a percentage of the total market value of agricultural products sold: 47.52%
The value of livestock, poultry, and their products as a percentage of the total market value of agricultural products sold: 21.82%
Average total farm production expenses per farm: $40,476
Harvested cropland as a percentage of land in farms: 26.91%
Average market value of all machinery and equipment per farm: $35,995
The percentage of farms operated by a family or individual: 80.90%
Average age of principal farm operators: 54 years
Average number of cattle and calves per 100 acres of all land in farms: 8.66
Milk cows as a percentage of all cattle and calves: 37.05%
Corn for grain: 5 harvested acres
Vegetables: 648 harvested acres
Land in orchards: 585 acres
Earthquake activity:
Rockingham County-area historical earthquake activity is significantly above New Hampshire state average. It is 72% smaller than the overall U.S. average.On 4/20/2002 at 10:50:47, a magnitude 5.3 (5.3 ML, Depth: 3.0 mi, Class: Moderate, Intensity: VI - VII) earthquake occurred 169.2 miles away from Rockingham County center
On 1/19/1982 at 00:14:42, a magnitude 4.7 (4.5 MB, 4.7 MD, 4.5 LG, Class: Light, Intensity: IV - V) earthquake occurred 45.5 miles away from the county center
On 10/16/2012 at 23:12:25, a magnitude 4.7 (4.7 ML, Depth: 10.0 mi) earthquake occurred 48.7 miles away from the county center
On 10/7/1983 at 10:18:46, a magnitude 5.3 (5.1 MB, 5.3 LG, 5.1 ML) earthquake occurred 177.6 miles away from the county center
On 4/20/2002 at 10:50:47, a magnitude 5.2 (5.2 MB, 4.2 MS, 5.2 MW, 5.0 MW) earthquake occurred 168.9 miles away from Rockingham County center
On 8/22/1992 at 12:20:32, a magnitude 4.8 (4.8 MB, 3.8 MS, 4.7 LG, Depth: 6.2 mi) earthquake occurred 269.7 miles away from the county center
Magnitude types: regional Lg-wave magnitude (LG), body-wave magnitude (MB), duration magnitude (MD), local magnitude (ML), surface-wave magnitude (MS), moment magnitude (MW)
Most recent natural disasters:
- New Hampshire Severe Winter Storm and Snowstorm, Incident Period: January 26, 2015 to January 29, 2015, Major Disaster (Presidential) Declared DR-4209: March 25, 2015, FEMA Id: 4209, Natural disaster type: Snowstorm, Winter Storm
- New Hampshire Severe Winter Storm and Snowstorm, Incident Period: February 08, 2013 to February 11, 2013, Major Disaster (Presidential) Declared DR-4105: March 19, 2013, FEMA Id: 4105, Natural disaster type: Snowstorm, Winter Storm
- New Hampshire Hurricane Sandy, Incident Period: October 26, 2012 to October 31, 2012, Emergency Declared EM-3360: October 30, 2012, FEMA Id: 3360, Natural disaster type: Hurricane
- New Hampshire Hurricane Sandy, Incident Period: October 26, 2012 to November 08, 2012, Major Disaster (Presidential) Declared DR-4095: November 28, 2012, FEMA Id: 4095, Natural disaster type: Hurricane
- New Hampshire Severe Storm, Incident Period: October 29, 2011 to October 30, 2011, Emergency Declared EM-3344: November 01, 2011, FEMA Id: 3344, Natural disaster type: Storm
- New Hampshire Severe Storms and Flooding, Incident Period: March 14, 2010 to March 31, 2010, Major Disaster (Presidential) Declared DR-1913: May 12, 2010, FEMA Id: 1913, Natural disaster type: Storm, Flood
- New Hampshire Severe Winter Storm, Incident Period: February 23, 2010 to March 03, 2010, Major Disaster (Presidential) Declared DR-1892: March 29, 2010, FEMA Id: 1892, Natural disaster type: Winter Storm
- New Hampshire Severe Winter Storm, Incident Period: December 11, 2008 to December 23, 2008, Major Disaster (Presidential) Declared DR-1812: January 02, 2009, FEMA Id: 1812, Natural disaster type: Winter Storm
- New Hampshire Severe Winter Storm, Incident Period: December 11, 2008 to December 23, 2008, Emergency Declared EM-3297: December 13, 2008, FEMA Id: 3297, Natural disaster type: Winter Storm
- New Hampshire Severe Storms, Tornado, and Flooding, Incident Period: July 24, 2008, Major Disaster (Presidential) Declared DR-1782: August 11, 2008, FEMA Id: 1782, Natural disaster type: Storm, Tornado, Flood
- 16 other natural disasters have been reported since 1953.
The number of natural disasters in Rockingham County (26) is a lot greater than the US average (15).
Major Disasters (Presidential) Declared: 17
Emergencies Declared: 9
Causes of natural disasters: Storms: 12, Floods: 9, Winter Storms: 5, Hurricanes: 4, Snowstorms: 4, Snows: 2, Winds: 2, Blizzard: 1, Snowfall: 1, Tornado: 1 (Note: some incidents may be assigned to more than one category).
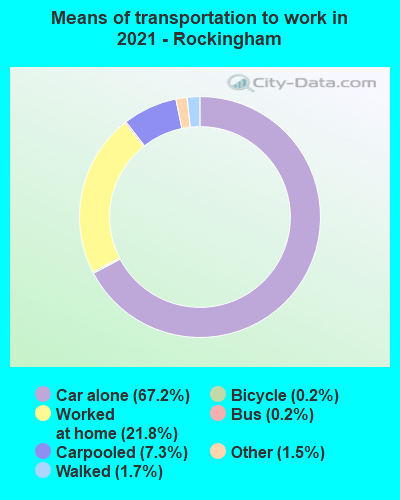
Means of transportation to work:
- Drove a car alone: 118,998 (69.3%)
- Carpooled: 11,602 (6.8%)
- Bus: 257 (0.1%)
- Taxicab, motorcycle, or other means: 2,383 (1.4%)
- Bicycle: 672 (0.4%)
- Walked: 1,974 (1.1%)
- Worked at home: 35,866 (20.9%)
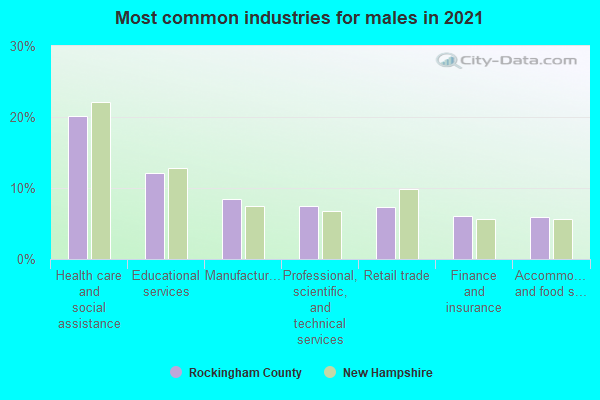
- Health care and social assistance (21%)
- Educational services (12%)
- Retail trade (9%)
- Professional, scientific, and technical services (7%)
- Manufacturing (7%)
- Accommodation and food services (6%)
- Finance and insurance (6%)
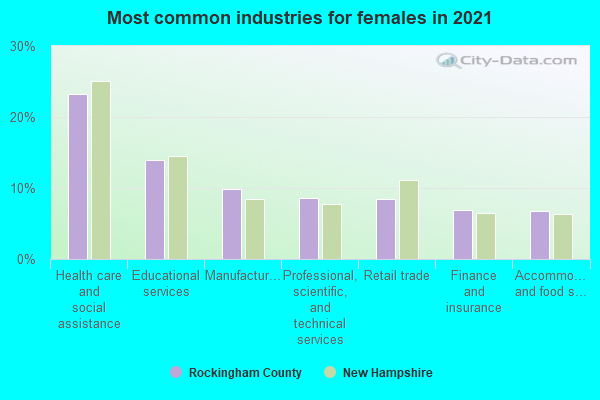
- Health care and social assistance (24%)
- Educational services (14%)
- Retail trade (10%)
- Professional, scientific, and technical services (8%)
- Manufacturing (8%)
- Accommodation and food services (7%)
- Finance and insurance (6%)
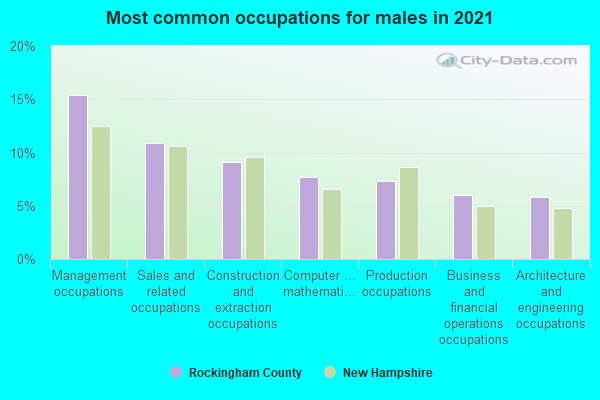
- Management occupations (16%)
- Sales and related occupations (11%)
- Architecture and engineering occupations (8%)
- Production occupations (8%)
- Construction and extraction occupations (7%)
- Business and financial operations occupations (6%)
- Installation, maintenance, and repair occupations (6%)
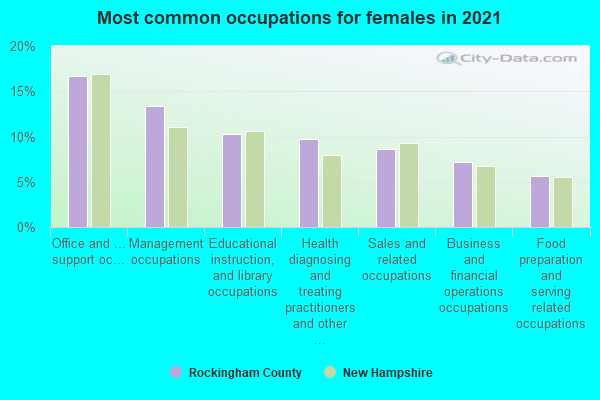
- Office and administrative support occupations (14%)
- Management occupations (14%)
- Educational instruction, and library occupations (11%)
- Sales and related occupations (10%)
- Business and financial operations occupations (9%)
- Health diagnosing and treating practitioners and other technical occupations (9%)
- Food preparation and serving related occupations (6%)
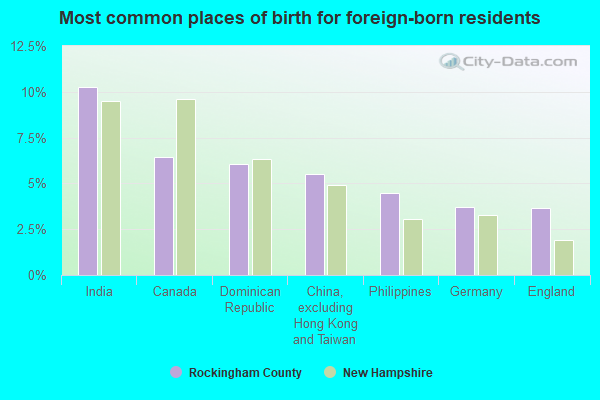
- India (9%)
- Dominican Republic (8%)
- Canada (7%)
- China, excluding Hong Kong and Taiwan (6%)
- Philippines (4%)
- Korea (4%)
- Germany (4%)
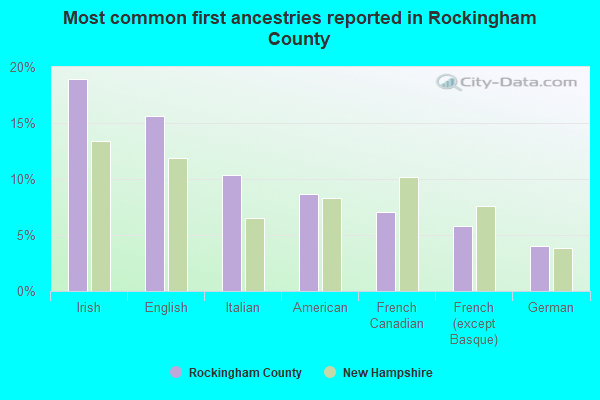
- Irish (18%)
- English (15%)
- Italian (10%)
- American (9%)
- French Canadian (7%)
- French (except Basque) (5%)
- German (4%)
People in group quarters in Rockingham County, New Hampshire in 2010:
- 1,129 people in nursing facilities/skilled-nursing facilities
- 454 people in military ships
- 287 people in local jails and other municipal confinement facilities
- 178 people in workers' group living quarters and job corps centers
- 121 people in other noninstitutional facilities
- 107 people in college/university student housing
- 98 people in emergency and transitional shelters (with sleeping facilities) for people experiencing homelessness
- 88 people in group homes intended for adults
- 15 people in residential treatment centers for juveniles (non-correctional)
- 14 people in residential treatment centers for adults
- 7 people in group homes for juveniles (non-correctional)
People in group quarters in Rockingham County, New Hampshire in 2000:
- 1,368 people in nursing homes
- 406 people in other noninstitutional group quarters
- 214 people in local jails and other confinement facilities (including police lockups)
- 90 people in other group homes
- 89 people in military ships
- 40 people in homes for the mentally retarded
- 36 people in college dormitories (includes college quarters off campus)
- 33 people in religious group quarters
- 29 people in homes for the mentally ill
- 27 people in homes or halfway houses for drug/alcohol abuse
- 23 people in unknown juvenile institutions
- 17 people in homes for abused, dependent, and neglected children
- 15 people in other nonhousehold living situations
- 11 people in crews of maritime vessels
- 4 people in mental (psychiatric) hospitals or wards
- 4 people in short-term care, detention or diagnostic centers for delinquent children
- 3 people in hospitals/wards and hospices for chronically ill
- 3 people in hospices or homes for chronically ill
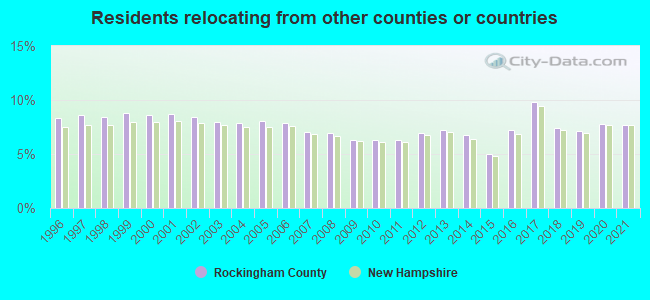
7.69% of this county's 2021 resident taxpayers lived in other counties in 2020 ($114,534 average adjusted gross income)
| Here: | 7.69% |
| New Hampshire average: | 7.66% |
0.01% of residents moved from foreign countries ($203 average AGI)
Rockingham County: 0.01% New Hampshire average: 0.01%
2.35% relocated from other counties in New Hampshire ($25,246 average AGI)
5.33% relocated from other states ($89,084 average AGI)
Rockingham County: 5.33% New Hampshire average: 4.81%
Top counties from which taxpayers relocated into this county between 2020 and 2021:
| from Essex County, MA | |
| from Hillsborough County, NH | |
| from Middlesex County, MA | |
| from Strafford County, NH | |
| from Merrimack County, NH | |
| from Suffolk County, MA | |
| from York County, ME |
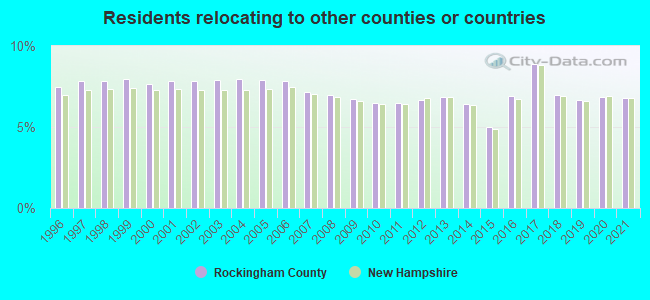
6.82% of this county's 2020 resident taxpayers moved to other counties in 2021 ($88,778 average adjusted gross income)
| Here: | 6.82% |
| New Hampshire average: | 6.80% |
0.01% of residents moved to foreign countries ($126 average AGI)
Rockingham County: 0.01% New Hampshire average: 0.01%
2.95% relocated to other counties in New Hampshire ($35,333 average AGI)
3.85% relocated to other states ($53,318 average AGI)
Rockingham County: 3.85% New Hampshire average: 3.93%
Top counties to which taxpayers relocated from this county between 2020 and 2021:
| to Hillsborough County, NH | |
| to Strafford County, NH | |
| to Essex County, MA | |
| to Merrimack County, NH | |
| to Middlesex County, MA | |
| to York County, ME | |
| to Suffolk County, MA |
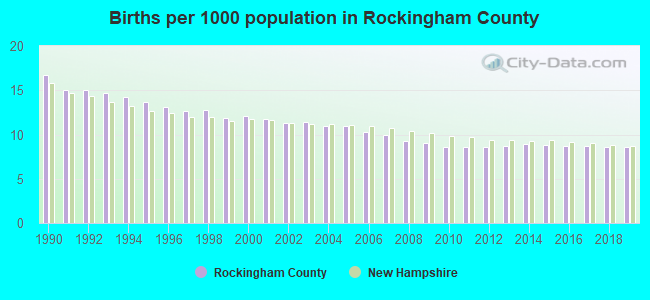
Births per 1000 population from 1990 to 1999: 14.0
Births per 1000 population from 2000 to 2009: 10.7
Births per 1000 population from 2010 to 2022: 7.3
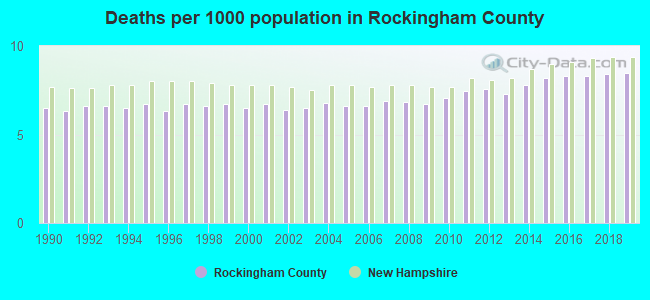
Deaths per 1000 population from 1990 to 1999: 6.5
Deaths per 1000 population from 2000 to 2009: 6.6
Deaths per 1000 population from 2010 to 2020: 8.0
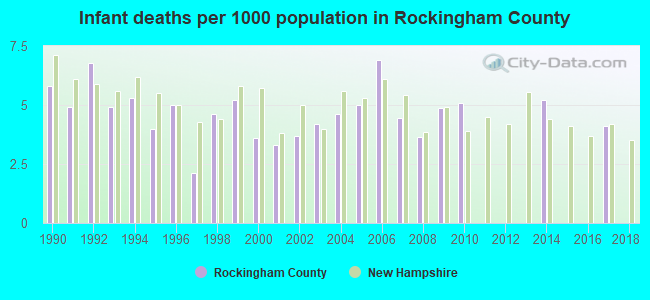
Infant deaths per 1000 live births from 1990 to 1999: 4.9
Infant deaths per 1000 live births from 2000 to 2009: 4.4
Infant deaths per 1000 live births from 2010 to 2021: 1.2
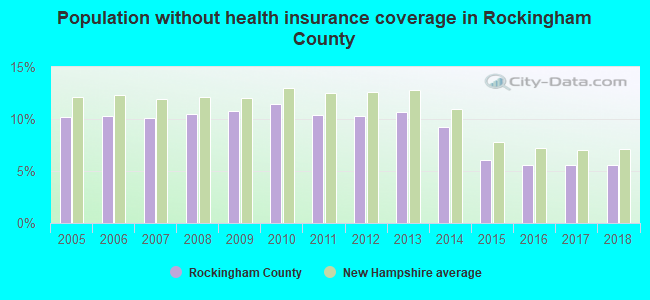
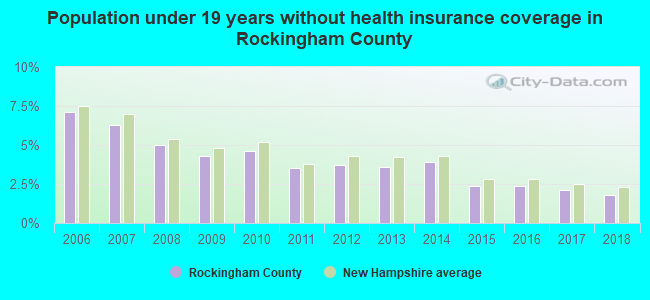
Persons under 19 years old without health insurance coverage in 2018: 1.8%

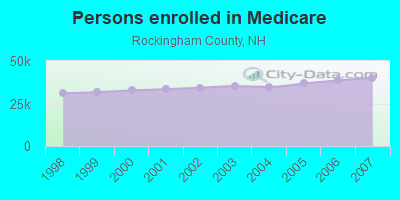
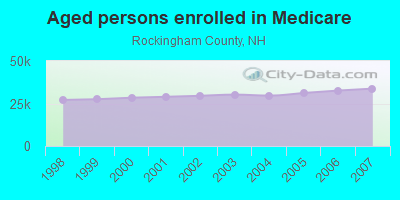
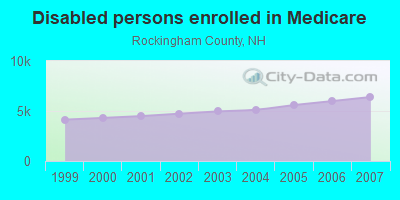
Persons enrolled in hospital insurance and/or supplemental medical insurance (Medicare) in July 1, 2007: 40,146 (33,747 aged, 6,399 disabled)
Children under 18 without health insurance coverage in 2007: 3,791 (5%)
Most common underlying causes of death in Rockingham County, New Hampshire in 1999 - 2019:
- Bronchus or lung, unspecified - Malignant neoplasms (3,122)
- Atherosclerotic heart disease (3,060)
- Unspecified dementia (1,880)
- Chronic obstructive pulmonary disease, unspecified (1,874)
- Acute myocardial infarction, unspecified (1,653)
- Atherosclerotic cardiovascular disease, so described (1,495)
- Alzheimer disease, unspecified (1,433)
- Congestive heart failure (1,266)
- Stroke, not specified as haemorrhage or infarction (1,089)
- Breast, unspecified - Malignant neoplasms (802)
Population without health insurance coverage in 2000: 7%
Children under 18 without health insurance coverage in 2000: 6%
Short term general hospital admissions per 100,000 population in 2004: 5,245
Short term general hospital beds per 100,000 population in 2004: 115
Emergency room visits per 100,000 population in 2004: 29,757
General practice office based MDs per 100,000 population in 2005: 1,041
Medical specialist MDs per 100,000 population in 2005: 696
Dentists per 100,000 population in 1998: 5
Total births per 100,000 population, July 2005 - July 2006 : 52
Total deaths per 100,000 population, July 2005 - July 2006: 129
Limited-service eating places per 100,000 population in 2005 : 20
Beer, wine & liquor stores per 100,000 population in 2005: 1
Homicides per 1,000,000 population from 2000 to 2006: 10.4. This is less than state average.
Suicides per 1,000,000 population from 2000 to 2006: 104.1. This is less than state average.
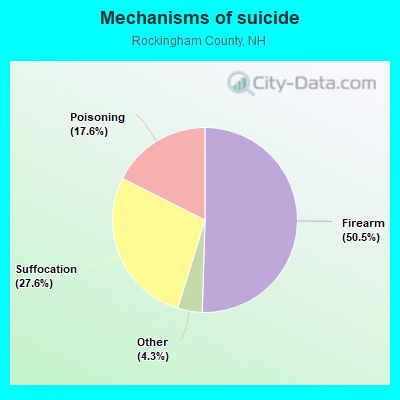
- Firearm - 52.6
- Suffocation - 28.8
- Poisoning - 18.3
- Other - 4.5
Household type by relationship:
Households: 319,424- Male householders: 62,665 (14,879 living alone), Female householders: 64,625 (19,300 living alone)
69,318 spouses (68,290 opposite-sex spouses), 10,389 unmarried partners, (9,841 opposite-sex unmarried partners), 89,437 children (84,411 natural, 1,725 adopted, 3,301 stepchildren), 4,446 grandchildren, 1,863 brothers or sisters, 2,779 parents, 139 foster children, 3,565 other relatives, 8,016 non-relatives
- In group quarters: 2,182
Size of family households: 36,989 2-persons, 20,411 3-persons, 17,407 4-persons, 6,013 5-persons, 1,261 6-persons, 232 7-or-more-persons.
Size of nonfamily households: 34,179 1-person, 9,557 2-persons, 1,089 3-persons, 152 5-persons.
44,511 married couples with children.
9,050 single-parent households (2,715 men, 6,335 women).
94.0% of residents of Rockingham speak English at home.
2.2% of residents speak Spanish at home (75% speak English very well, 17% speak English well, 7% speak English not well, 2% don't speak English at all).
2.2% of residents speak other Indo-European language at home (87% speak English very well, 10% speak English well, 3% speak English not well).
1.4% of residents speak Asian or Pacific Island language at home (72% speak English very well, 22% speak English well, 5% speak English not well).
0.4% of residents speak other language at home (79% speak English very well, 15% speak English well, 5% speak English not well, 2% don't speak English at all).
In fiscal year 2004:
Federal Government expenditure: $1,401,494,000 ($4,791 per capita)
Department of Defense expenditure: $254,897,000
Federal direct payments to individuals for retirement and disability: $627,869,000
Federal other direct payments to individuals: $198,125,000
Federal direct payments not to individuals: $1,241,000
Federal grants: $195,973,000
Federal procurement contracts: $211,951,000 ($121,277,000 Department of Defense)
Federal salaries and wages: $166,335,000 ($80,637,000 Department of Defense)
Federal Government direct loans: $9,808,000
Federal guaranteed/insured loans: $118,606,000
Federal Government insurance: $322,780,000
Population change from April 1, 2000 to July 1, 2005:
Births: 17,185| Here: | 58 per 1000 residents |
| State: | 57 per 1000 residents |
Deaths: 9,811
| Here: | 33 per 1000 residents |
| State: | 39 per 1000 residents |
Net international migration: +1,328
| Here: | +5 per 1000 residents |
| State: | +8 per 1000 residents |
Net internal migration: +9,378
| Here: | +32 per 1000 residents |
| State: | +31 per 1000 residents |
Total withdrawal of fresh water for public supply: 13.26 millions of gallons per day (60% from ground, 40% from surface)
| Here: | 6.5 |
| State: | 6.4 |
| Here: | 3.8 |
| State: | 4.0 |
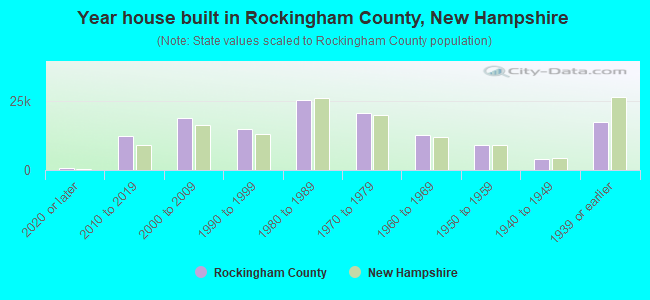
- Year house built in Rockingham County, New Hampshire
- 2,4462020 or later
- 13,8042010 to 2019
- 17,1572000 to 2009
- 16,5601990 to 1999
- 25,7481980 to 1989
- 18,5881970 to 1979
- 12,3811960 to 1969
- 9,5951950 to 1959
- 4,4341940 to 1949
- 17,0821939 or earlier
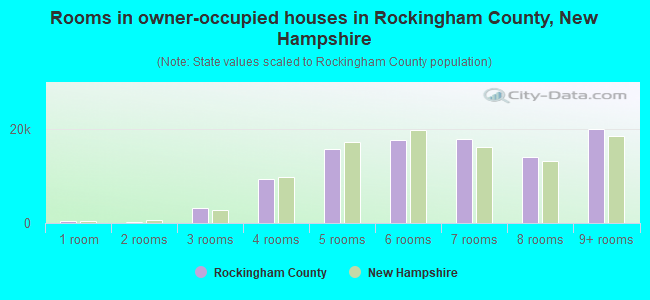
- Rooms in owner-occupied houses in Rockingham County, New Hampshire
- 3031 room
- 5292 rooms
- 2,9503 rooms
- 9,9944 rooms
- 15,9185 rooms
- 19,8476 rooms
- 15,3187 rooms
- 13,4518 rooms
- 19,7349+ rooms
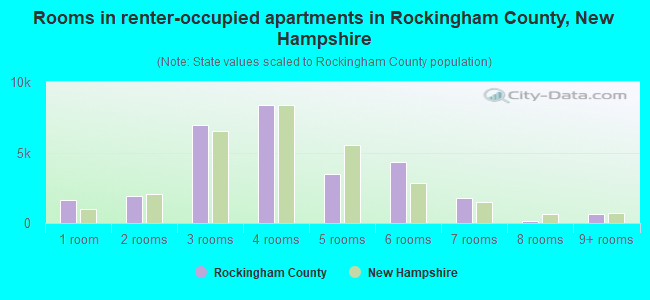
- Rooms in renter-occupied apartments in Rockingham County, New Hampshire
- 8041 room
- 4,9922 rooms
- 6,4403 rooms
- 8,5804 rooms
- 3,9455 rooms
- 1,6746 rooms
- 1,2867 rooms
- 4318 rooms
- 1,0949+ rooms
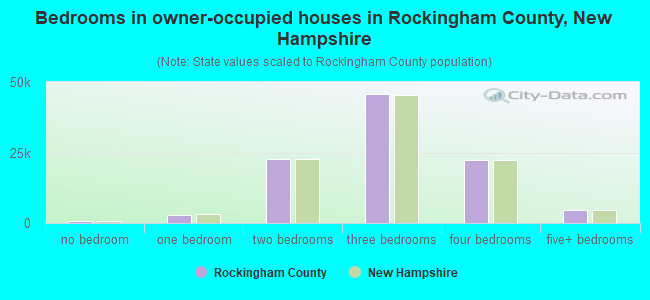
- Bedrooms in owner-occupied houses in Rockingham County, New Hampshire
- 512no bedroom
- 2,6531 bedroom
- 22,9442 bedrooms
- 45,6353 bedrooms
- 21,2144 bedrooms
- 5,0865+ bedrooms
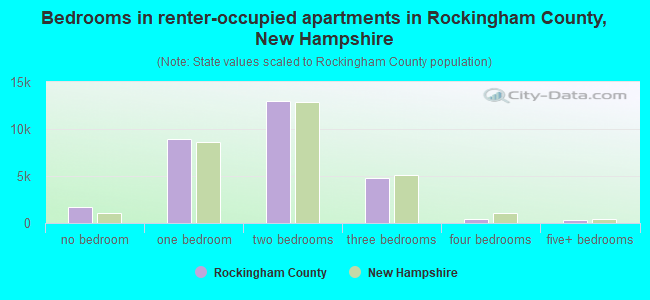
- Bedrooms in renter-occupied apartments in Rockingham County, New Hampshire
- 974no bedroom
- 8,9731 bedroom
- 14,2902 bedrooms
- 3,7263 bedrooms
- 1,0624 bedrooms
- 2215+ bedrooms
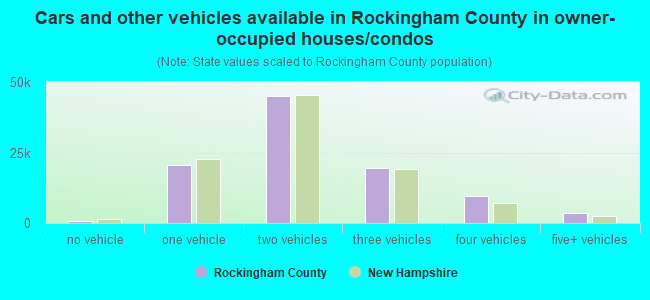
- Cars and other vehicles available in Rockingham County in owner-occupied houses/condos
- 1,349no vehicle
- 21,8961 vehicle
- 45,9812 vehicles
- 18,6073 vehicles
- 6,9194 vehicles
- 3,2925+ vehicles
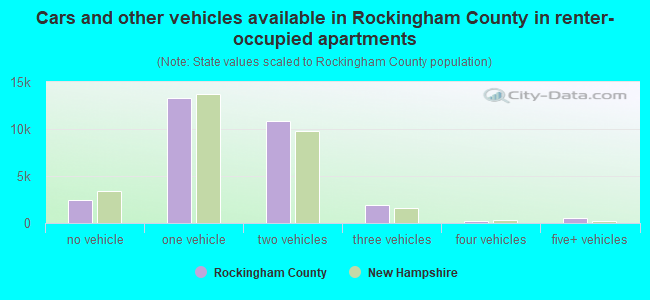
- Cars and other vehicles available in Rockingham County in renter-occupied apartments
- 2,412no vehicle
- 16,2021 vehicle
- 8,2162 vehicles
- 2,2833 vehicles
- 1334 vehicles
- 05+ vehicles
91.2% of Rockingham County residents lived in the same house 1 years ago.
Out of people who lived in different houses, 26% lived in this county.
Out of people who lived in different counties, 38% lived in New Hampshire.
| Rockingham County: | 91.2% |
| State average: | 89.8% |
Place of birth for U.S.-born residents:
- This state: 93,120
- Other state: 206,867
- Northeast: 174,864
- Midwest: 9,951
- South: 13,811
- West: 8,241
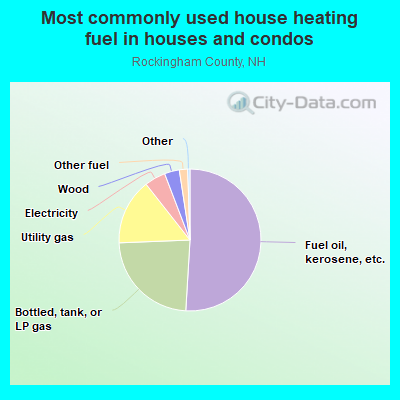
- 49.1%Fuel oil, kerosene, etc.
- 23.8%Bottled, tank, or LP gas
- 13.9%Utility gas
- 6.1%Electricity
- 3.7%Wood
- 3.1%Other fuel
- 0.3%No fuel used
- 0.1%Solar energy
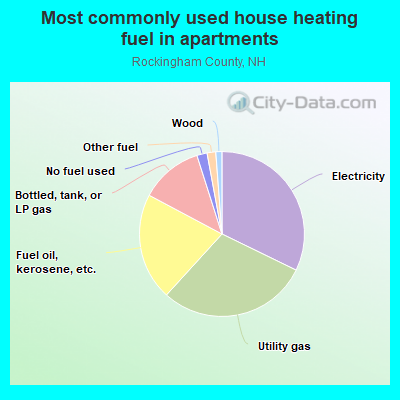
- 32.9%Utility gas
- 28.7%Electricity
- 18.4%Fuel oil, kerosene, etc.
- 16.8%Bottled, tank, or LP gas
- 2.5%No fuel used
- 0.6%Other fuel
Private vs. public school enrollment:
| Here: | 9.2% |
| New Hampshire: | 11.4% |
| Here: | 16.9% |
| New Hampshire: | 14.0% |
| Here: | 40.4% |
| New Hampshire: | 38.0% |
Rockingham County government finances - Expenditure in 2020:
- Charges - Other: $11,748,000
Other: $10,265,000
- Construction - General - Other: $982,000
General Public Buildings: $27,000
General Public Buildings: $23,000
- Current Operations - Public Welfare Institutions: $26,991,000
Public Welfare Institutions: $23,400,000
Correctional Institutions: $11,184,000
Correctional Institutions: $10,660,000
General Public Buildings: $6,269,000
Police Protection: $5,872,000
Police Protection: $5,549,000
General Public Buildings: $4,276,000
Judicial and Legal Services: $3,911,000
Judicial and Legal Services: $3,625,000
Central Staff Services: $2,393,000
General - Other: $1,932,000
General - Other: $1,363,000
Financial Administration: $1,257,000
Financial Administration: $1,117,000
Natural Resources - Other: $488,000
Natural Resources - Other: $401,000
- Federal Intergovernmental - Other: $3,393,000
Other: $1,251,000
- General - Interest on Debt: $435,000
Interest on Debt: $185,000
- Intergovernmental to Local - Other - General - Other: $2,463,000
- Intergovernmental to State - Public Welfare: $20,030,000
Public Welfare: $18,025,000
- Long Term Debt - Beginning Outstanding - Unspecified Public Purpose: $9,896,000
Outstanding Unspecified Public Purpose: $8,435,000
Beginning Outstanding - Unspecified Public Purpose: $6,145,000
Outstanding Unspecified Public Purpose: $5,050,000
Retired Unspecified Public Purpose: $1,461,000
Retired Unspecified Public Purpose: $1,095,000
- Miscellaneous - General Revenue - Other: $1,189,000
General Revenue - Other: $876,000
Interest Earnings: $187,000
Interest Earnings: $45,000
- Other Capital Outlay - Police Protection: $203,000
General Public Building: $29,000
- Other Funds - Cash and Securities: $57,489,000
Cash and Securities: $51,282,000
- State Intergovernmental - Other: $12,254,000
Public Welfare: $7,257,000
Public Welfare: $6,866,000
Other: $6,421,000
- Tax - Property: $50,297,000
Property: $48,369,000
- Total Salaries and Wages: $25,121,000
: $24,815,000
Rockingham County government finances - Revenue in 2020:
- Charges - Other: $11,748,000
Other: $10,265,000
- Construction - General - Other: $982,000
General Public Buildings: $27,000
General Public Buildings: $23,000
- Current Operations - Public Welfare Institutions: $26,991,000
Public Welfare Institutions: $23,400,000
Correctional Institutions: $11,184,000
Correctional Institutions: $10,660,000
General Public Buildings: $6,269,000
Police Protection: $5,872,000
Police Protection: $5,549,000
General Public Buildings: $4,276,000
Judicial and Legal Services: $3,911,000
Judicial and Legal Services: $3,625,000
Central Staff Services: $2,393,000
General - Other: $1,932,000
General - Other: $1,363,000
Financial Administration: $1,257,000
Financial Administration: $1,117,000
Natural Resources - Other: $488,000
Natural Resources - Other: $401,000
- Federal Intergovernmental - Other: $3,393,000
Other: $1,251,000
- General - Interest on Debt: $435,000
Interest on Debt: $185,000
- Intergovernmental to Local - Other - General - Other: $2,463,000
- Intergovernmental to State - Public Welfare: $20,030,000
Public Welfare: $18,025,000
- Long Term Debt - Beginning Outstanding - Unspecified Public Purpose: $9,896,000
Outstanding Unspecified Public Purpose: $8,435,000
Beginning Outstanding - Unspecified Public Purpose: $6,145,000
Outstanding Unspecified Public Purpose: $5,050,000
Retired Unspecified Public Purpose: $1,461,000
Retired Unspecified Public Purpose: $1,095,000
- Miscellaneous - General Revenue - Other: $1,189,000
General Revenue - Other: $876,000
Interest Earnings: $187,000
Interest Earnings: $45,000
- Other Capital Outlay - Police Protection: $203,000
General Public Building: $29,000
- Other Funds - Cash and Securities: $57,489,000
Cash and Securities: $51,282,000
- State Intergovernmental - Other: $12,254,000
Public Welfare: $7,257,000
Public Welfare: $6,866,000
Other: $6,421,000
- Tax - Property: $50,297,000
Property: $48,369,000
- Total Salaries and Wages: $25,121,000
: $24,815,000
Rockingham County government finances - Debt in 2020:
- Charges - Other: $11,748,000
Other: $10,265,000
- Construction - General - Other: $982,000
General Public Buildings: $27,000
General Public Buildings: $23,000
- Current Operations - Public Welfare Institutions: $26,991,000
Public Welfare Institutions: $23,400,000
Correctional Institutions: $11,184,000
Correctional Institutions: $10,660,000
General Public Buildings: $6,269,000
Police Protection: $5,872,000
Police Protection: $5,549,000
General Public Buildings: $4,276,000
Judicial and Legal Services: $3,911,000
Judicial and Legal Services: $3,625,000
Central Staff Services: $2,393,000
General - Other: $1,932,000
General - Other: $1,363,000
Financial Administration: $1,257,000
Financial Administration: $1,117,000
Natural Resources - Other: $488,000
Natural Resources - Other: $401,000
- Federal Intergovernmental - Other: $3,393,000
Other: $1,251,000
- General - Interest on Debt: $435,000
Interest on Debt: $185,000
- Intergovernmental to Local - Other - General - Other: $2,463,000
- Intergovernmental to State - Public Welfare: $20,030,000
Public Welfare: $18,025,000
- Long Term Debt - Beginning Outstanding - Unspecified Public Purpose: $9,896,000
Outstanding Unspecified Public Purpose: $8,435,000
Beginning Outstanding - Unspecified Public Purpose: $6,145,000
Outstanding Unspecified Public Purpose: $5,050,000
Retired Unspecified Public Purpose: $1,461,000
Retired Unspecified Public Purpose: $1,095,000
- Miscellaneous - General Revenue - Other: $1,189,000
General Revenue - Other: $876,000
Interest Earnings: $187,000
Interest Earnings: $45,000
- Other Capital Outlay - Police Protection: $203,000
General Public Building: $29,000
- Other Funds - Cash and Securities: $57,489,000
Cash and Securities: $51,282,000
- State Intergovernmental - Other: $12,254,000
Public Welfare: $7,257,000
Public Welfare: $6,866,000
Other: $6,421,000
- Tax - Property: $50,297,000
Property: $48,369,000
- Total Salaries and Wages: $25,121,000
: $24,815,000
Rockingham County government finances - Cash and Securities in 2020:
- Charges - Other: $11,748,000
Other: $10,265,000
- Construction - General - Other: $982,000
General Public Buildings: $27,000
General Public Buildings: $23,000
- Current Operations - Public Welfare Institutions: $26,991,000
Public Welfare Institutions: $23,400,000
Correctional Institutions: $11,184,000
Correctional Institutions: $10,660,000
General Public Buildings: $6,269,000
Police Protection: $5,872,000
Police Protection: $5,549,000
General Public Buildings: $4,276,000
Judicial and Legal Services: $3,911,000
Judicial and Legal Services: $3,625,000
Central Staff Services: $2,393,000
General - Other: $1,932,000
General - Other: $1,363,000
Financial Administration: $1,257,000
Financial Administration: $1,117,000
Natural Resources - Other: $488,000
Natural Resources - Other: $401,000
- Federal Intergovernmental - Other: $3,393,000
Other: $1,251,000
- General - Interest on Debt: $435,000
Interest on Debt: $185,000
- Intergovernmental to Local - Other - General - Other: $2,463,000
- Intergovernmental to State - Public Welfare: $20,030,000
Public Welfare: $18,025,000
- Long Term Debt - Beginning Outstanding - Unspecified Public Purpose: $9,896,000
Outstanding Unspecified Public Purpose: $8,435,000
Beginning Outstanding - Unspecified Public Purpose: $6,145,000
Outstanding Unspecified Public Purpose: $5,050,000
Retired Unspecified Public Purpose: $1,461,000
Retired Unspecified Public Purpose: $1,095,000
- Miscellaneous - General Revenue - Other: $1,189,000
General Revenue - Other: $876,000
Interest Earnings: $187,000
Interest Earnings: $45,000
- Other Capital Outlay - Police Protection: $203,000
General Public Building: $29,000
- Other Funds - Cash and Securities: $57,489,000
Cash and Securities: $51,282,000
- State Intergovernmental - Other: $12,254,000
Public Welfare: $7,257,000
Public Welfare: $6,866,000
Other: $6,421,000
- Tax - Property: $50,297,000
Property: $48,369,000
- Total Salaries and Wages: $25,121,000
: $24,815,000
Supplemental Security Income (SSI) in 2006:
- Total number of recipients: 1,792
- Number of aged recipients: 116
- Number of blind and disabled recipients: 1,676
- Number of recipients under 18: 202
- Number of recipients between 18 and 64: 1,374
- Number of recipients older than 64: 216
- Number of recipients also receiving OASDI: 649
- Amount of payments (thousands of dollars): 808
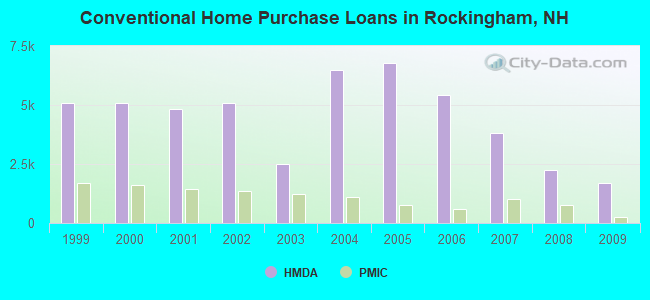
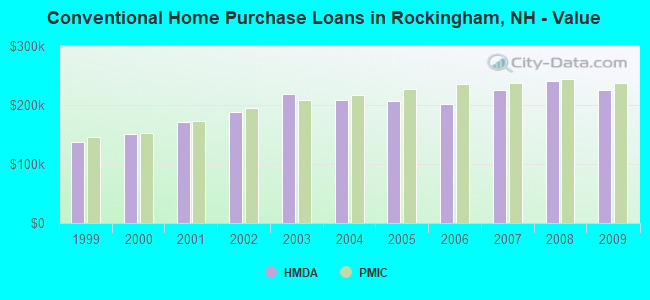
| Home Mortgage Disclosure Act Aggregated Statistics For Year 2009 (Based on 55 full tracts) | ||||||||||||||
| A) FHA, FSA/RHS & VA Home Purchase Loans | B) Conventional Home Purchase Loans | C) Refinancings | D) Home Improvement Loans | E) Loans on Dwellings For 5+ Families | F) Non-occupant Loans on < 5 Family Dwellings (A B C & D) | G) Loans On Manufactured Home Dwelling (A B C & D) | ||||||||
|---|---|---|---|---|---|---|---|---|---|---|---|---|---|---|
| Number | Average Value | Number | Average Value | Number | Average Value | Number | Average Value | Number | Average Value | Number | Average Value | Number | Average Value | |
| LOANS ORIGINATED | 1,154 | $229,140 | 1,686 | $224,665 | 9,464 | $231,300 | 440 | $116,657 | 18 | $1,061,667 | 535 | $220,086 | 127 | $70,394 |
| APPLICATIONS APPROVED, NOT ACCEPTED | 74 | $218,108 | 115 | $214,035 | 790 | $239,085 | 43 | $82,907 | 1 | $2,000,000 | 45 | $253,156 | 18 | $81,500 |
| APPLICATIONS DENIED | 216 | $201,556 | 348 | $169,833 | 3,452 | $245,240 | 290 | $90,228 | 4 | $427,000 | 208 | $205,875 | 157 | $67,140 |
| APPLICATIONS WITHDRAWN | 148 | $206,716 | 240 | $246,688 | 1,906 | $242,319 | 61 | $182,934 | 5 | $682,600 | 106 | $240,142 | 23 | $88,348 |
| FILES CLOSED FOR INCOMPLETENESS | 30 | $208,400 | 46 | $227,543 | 571 | $241,042 | 35 | $156,657 | 0 | $0 | 16 | $172,125 | 16 | $50,500 |
| Private Mortgage Insurance Companies Aggregated Statistics For Year 2009 (Based on 55 full tracts) | ||||||||
| A) Conventional Home Purchase Loans | B) Refinancings | C) Non-occupant Loans on < 5 Family Dwellings (A & B) | D) Loans On Manufactured Home Dwelling (A & B) | |||||
|---|---|---|---|---|---|---|---|---|
| Number | Average Value | Number | Average Value | Number | Average Value | Number | Average Value | |
| LOANS ORIGINATED | 249 | $236,667 | 216 | $277,792 | 6 | $220,000 | 1 | $89,000 |
| APPLICATIONS APPROVED, NOT ACCEPTED | 84 | $247,690 | 113 | $276,540 | 4 | $213,250 | 0 | $0 |
| APPLICATIONS DENIED | 55 | $228,164 | 71 | $285,000 | 4 | $272,000 | 0 | $0 |
| APPLICATIONS WITHDRAWN | 19 | $234,947 | 26 | $258,577 | 4 | $247,000 | 0 | $0 |
| FILES CLOSED FOR INCOMPLETENESS | 8 | $194,875 | 3 | $247,000 | 0 | $0 | 0 | $0 |
| Most common first names in Rockingham County, NH among deceased individuals | ||
| Name | Count | Lived (average) |
|---|---|---|
| John | 1,568 | 73.7 years |
| Mary | 1,425 | 80.7 years |
| William | 1,115 | 74.6 years |
| Robert | 1,104 | 69.8 years |
| George | 907 | 75.8 years |
| Joseph | 841 | 75.0 years |
| James | 769 | 73.1 years |
| Helen | 735 | 81.9 years |
| Charles | 734 | 75.4 years |
| Dorothy | 640 | 79.7 years |
| Most common last names in Rockingham County, NH among deceased individuals | ||
| Last name | Count | Lived (average) |
|---|---|---|
| Smith | 442 | 77.8 years |
| Brown | 346 | 76.6 years |
| Johnson | 244 | 78.3 years |
| Clark | 187 | 77.9 years |
| Sullivan | 147 | 76.8 years |
| Wilson | 143 | 77.4 years |
| White | 136 | 75.3 years |
| Davis | 134 | 77.7 years |
| Eaton | 133 | 75.8 years |
| Murphy | 131 | 77.1 years |
| Businesses in Rockingham County, NH | ||||
| Name | Count | Name | Count | |
|---|---|---|---|---|
| 7-Eleven | 5 | Journeys | 2 | |
| ALDO | 1 | Justice | 2 | |
| AT&T | 7 | KFC | 4 | |
| Abercrombie & Fitch | 2 | Kmart | 2 | |
| Abercrombie Kids | 1 | Kohl's | 4 | |
| Ace Hardware | 8 | La Quinta | 1 | |
| Advance Auto Parts | 7 | La-Z-Boy | 1 | |
| Aeropostale | 2 | Lane Bryant | 1 | |
| American Eagle Outfitters | 3 | Lane Furniture | 5 | |
| Ann Taylor | 1 | LensCrafters | 3 | |
| Apple Store | 1 | Long John Silver's | 1 | |
| Applebee's | 4 | Lowe's | 4 | |
| Ashley Furniture | 1 | Macy's | 2 | |
| Audi | 1 | Marriott | 4 | |
| AutoZone | 6 | Marshalls | 3 | |
| BMW | 1 | MasterBrand Cabinets | 68 | |
| Bakers | 1 | Maurices | 1 | |
| Banana Republic | 2 | McDonald's | 15 | |
| Barnes & Noble | 2 | Men's Wearhouse | 3 | |
| Bath & Body Works | 3 | Motel 6 | 1 | |
| Bed Bath & Beyond | 3 | Motherhood Maternity | 5 | |
| Best Western | 3 | New Balance | 8 | |
| Blockbuster | 2 | Nike | 6 | |
| Brookstone | 1 | Nissan | 3 | |
| Burger King | 8 | Old Navy | 1 | |
| CVS | 9 | Olive Garden | 1 | |
| Cache | 1 | Pac Sun | 2 | |
| Casual Male XL | 1 | Panera Bread | 1 | |
| Charlotte Russe | 2 | Payless | 5 | |
| Chevrolet | 2 | Penske | 3 | |
| Chico's | 1 | PetSmart | 1 | |
| Chipotle | 1 | Pier 1 Imports | 1 | |
| Cinnabon | 1 | Pizza Hut | 3 | |
| Circle K | 8 | Pottery Barn | 1 | |
| Cold Stone Creamery | 1 | Quiznos | 2 | |
| Comfort Inn | 1 | RadioShack | 9 | |
| Cracker Barrel | 1 | Red Roof Inn | 1 | |
| Curves | 3 | Rite Aid | 16 | |
| DHL | 3 | Ruby Tuesday | 2 | |
| Dairy Queen | 1 | Ryder Rental & Truck Leasing | 1 | |
| Deb | 1 | Sam's Club | 1 | |
| Decora Cabinetry | 12 | Sears | 6 | |
| Dennys | 1 | Sephora | 1 | |
| Domino's Pizza | 5 | Shaw's | 9 | |
| DressBarn | 1 | Sheraton | 1 | |
| Dressbarn | 2 | Skechers USA | 1 | |
| Dunkin Donuts | 48 | Sleep Inn | 1 | |
| Express | 2 | Spencer Gifts | 2 | |
| Famous Footwear | 2 | Sprint Nextel | 10 | |
| Fashion Bug | 2 | Staples | 7 | |
| FedEx | 66 | Starbucks | 6 | |
| Finish Line | 1 | Subaru | 3 | |
| Foot Locker | 2 | Subway | 20 | |
| Ford | 5 | T-Mobile | 20 | |
| Forever 21 | 1 | T.G.I. Driday's | 1 | |
| Fredericks Of Hollywood | 1 | T.J.Maxx | 5 | |
| GNC | 13 | Taco Bell | 5 | |
| GameStop | 9 | Talbots | 2 | |
| Gap | 2 | Target | 2 | |
| Goodwill | 4 | The Limited | 1 | |
| Gymboree | 2 | The Room Place | 1 | |
| H&M | 1 | Torrid | 1 | |
| H&R Block | 10 | Toyota | 3 | |
| Hilton | 3 | Toys"R"Us | 4 | |
| Holiday Inn | 3 | True Value | 3 | |
| Hollister Co. | 2 | U-Haul | 15 | |
| Home Depot | 6 | UPS | 75 | |
| Honda | 2 | Verizon Wireless | 8 | |
| Hot Topic | 2 | Victoria's Secret | 2 | |
| Hyundai | 2 | Volkswagen | 1 | |
| IHOP | 2 | Walgreens | 7 | |
| J. Jill | 1 | Walmart | 7 | |
| J.Crew | 1 | Wendy's | 6 | |
| JCPenney | 2 | Wet Seal | 1 | |
| Jones New York | 8 | YMCA | 4 | |
Rockingham County on our top lists:
- #9 on the list of "Top 101 counties with the largest decrease in the number of births per 1000 residents 2000-2006 to 2007-2013 (pop 50,000+)"
- #14 on the list of "Top 101 counties with the best general health status score of residents (1-5), 3 years of data"
- #16 on the list of "Top 101 counties with the lowest number of births per 1000 residents 2007-2013"
- #16 on the list of "Top 101 counties with the lowest number of births per 1000 residents 2007-2013 (pop 50,000+)"
- #22 on the list of "Top 101 counties with the lowest Particulate Matter (PM10) Annual air pollution readings in 2012 (µg/m3)"
- #36 on the list of "Top 101 counties with the highest percentage of residents that visited a dentist within the past year"
- #46 on the list of "Top 101 counties with the highest percentage of residents that smoked 100+ cigarettes in their lives"
- #56 on the list of "Top 101 counties with the largest increase in the number of deaths per 1000 residents 2000-2006 to 2007-2013 (pop. 50,000+)"
- #62 on the list of "Top 101 counties with the lowest Sulfur Oxides Annual air pollution readings in 2012 (µg/m3)"
- #68 on the list of "Top 101 counties with the highest average weight of females"
- #73 on the list of "Top 101 counties with the lowest Particulate Matter (PM2.5) Annual air pollution readings in 2012 (µg/m3)"
- #76 on the list of "Top 101 counties with the highest percentage of residents that exercised in the past month"
- #84 on the list of "Top 101 counties with the lowest percentage of residents that keep firearms around their homes"
- #87 on the list of "Top 101 counties with the highest carbon monoxide air pollution readings in 2012 (ppm)"