Fort Bend County, Texas (TX)
County owner-occupied free and clear houses and condos in 2010: 30,960
County owner-occupied houses and condos in 2000: 89,628
Renter-occupied apartments: 37,635 (it was 21,287 in 2000)
| % of renters here: | 19% |
| State: | 36% |
Land area: 875 sq. mi.
Water area: 11.4 sq. mi.
Population density: 1017 people per square mile (very high).
Industries providing employment: Educational, health and social services (24.3%), Professional, scientific, management, administrative, and waste management services (15.5%), Retail trade (10.4%).
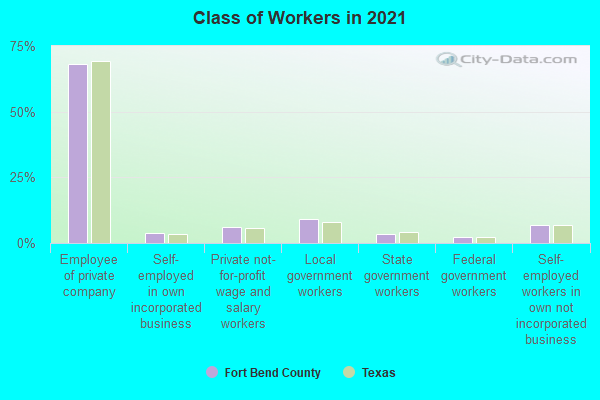
Type of workers:
- Private wage or salary: 80%
- Government: 13%
- Self-employed, not incorporated: 6%
- Unpaid family work: 0%
- OSM Map
- General Map
- Google Map
- MSN Map

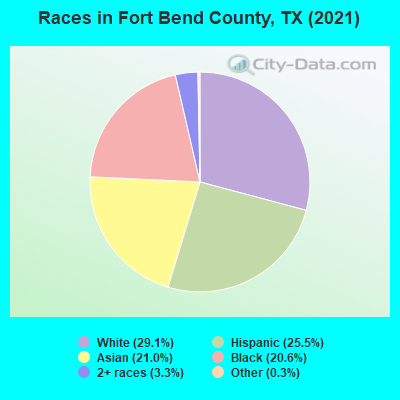
- 256,09828.8%White Non-Hispanic Alone
- 227,01025.5%Hispanic or Latino
- 192,48721.6%Asian alone
- 175,36019.7%Black Non-Hispanic Alone
- 33,1893.7%Two or more races
- 3,0850.3%Some other race alone
- 1,3460.2%Native Hawaiian and Other
Pacific Islander alone - 5710.06%American Indian and Alaska Native alone
| Median resident age: | 37.4 years |
| Texas median age: | 35.6 years |
| Males: 439,315 | |
| Females: 449,831 |

 | Crime in Houston is out of control... (1040 replies) |
| When will new segments of Grand Parkway 99 open? (44 replies) |
| Areas in Houston that are similar to Southern Orange County, California (108 replies) |
| What Are The Best Neighborhoods In Fort Bend County?? (26 replies) |
| Looking for advice on Briar Forest area (18 replies) |
| Cost of living in different parts of Texas (31 replies) |
| Fort Bend County: | 3.0 people |
| Texas: | 3 people |
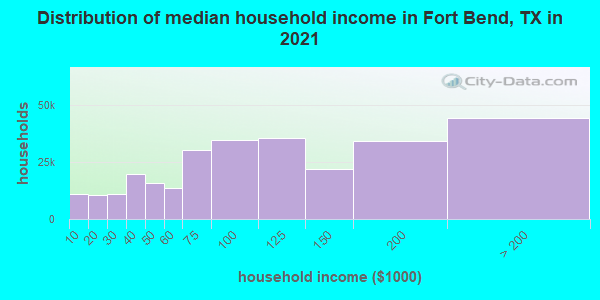
Estimated median household income in 2022: $105,205 ($63,831 in 1999)
| This county: | $105,205 |
| Texas: | $72,284 |
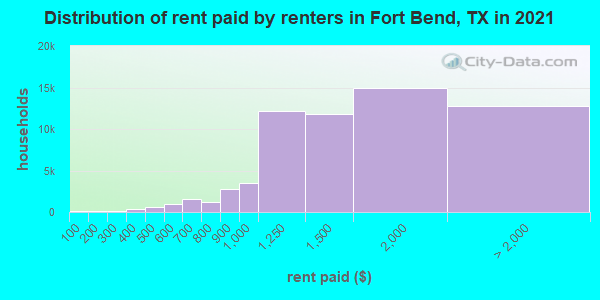
Median contract rent in 2022 for apartments: $1,479 (lower quartile is $1,144, upper quartile is $1,952)
| This county: | $1479 |
| State: | $1117 |
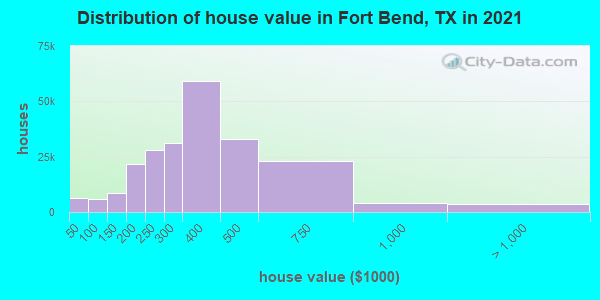
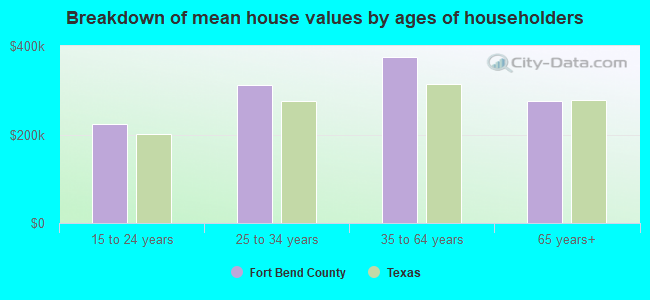
Estimated median house or condo value in 2022: $351,600 (it was $110,800 in 2000)
| Fort Bend: | $351,600 |
| Texas: | $275,400 |
Mean price in 2022:
Median monthly housing costs for homes and condos with a mortgage: $2,334Detached houses: $434,590
Here: $434,590 State: $369,058 Townhouses or other attached units: $309,701
Here: $309,701 State: $327,631 In 2-unit structures: $1,166,534
Here: $1,166,534 State: $374,947 In 3-to-4-unit structures: $332,074
Here: $332,074 State: $209,652 In 5-or-more-unit structures: $1,931,539
Here: $1,931,539 State: $413,944 Mobile homes: $193,064
Here: $193,064 State: $124,413 Occupied boats, RVs, vans, etc.: $100,189
Here: $100,189 State: $73,921
Median monthly housing costs for units without a mortgage: $916
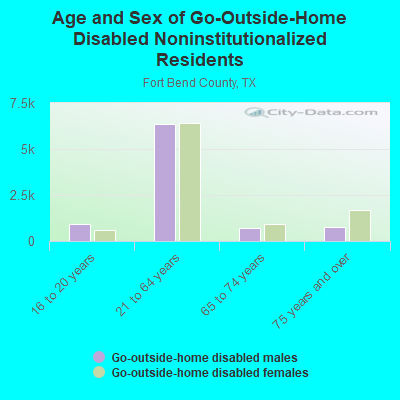
Institutionalized population: 5,604
Crime in 2021 (reported by the sheriff's office or county police, not the county total):
- Murders: 17
- Rapes: 147
- Robberies: 107
- Assaults: 717
- Burglaries: 636
- Thefts: 3626
- Auto thefts: 409
Crime in 2020 (reported by the sheriff's office or county police, not the county total):
- Murders: 11
- Rapes: 151
- Robberies: 113
- Assaults: 728
- Burglaries: 674
- Thefts: 3652
- Auto thefts: 363
Health of residents in Fort Bend County based on CDC Behavioral Risk Factor Surveillance System Survey Questionnaires from 2013 to 2021:
General health status score of residents in this county from 1 (poor) to 5 (excellent) is 3.4. This is about average.68.8% of residents exercised in the past month. This is less than average.
37.5% of residents smoked 100+ cigarettes in their lives. This is less than average.
51.1% of adult residents drank alcohol in the past 30 days. This is less than average.
64.1% of residents visited a dentist within the past year. This is less than average.
Average weight of males is 198 pounds. This is about average.
Average weight of females is 164 pounds. This is about average.
Health of residents in Fort Bend County based on CDC Behavioral Risk Factor Surveillance System Survey Questionnaires from 2003 to 2012:
General health status score of residents in this county from 1 (poor) to 5 (excellent) is 3.6. This is better than average.75.9% of residents exercised in the past month. This is about average.
35.4% of residents smoked 100+ cigarettes in their lives. This is less than average.
80.3% of adult residents drank alcohol in the past 30 days. This is more than average.
73.7% of residents visited a dentist within the past year. This is about average.
Average weight of males is 196 pounds. This is about average.
Average weight of females is 156 pounds. This is about average.
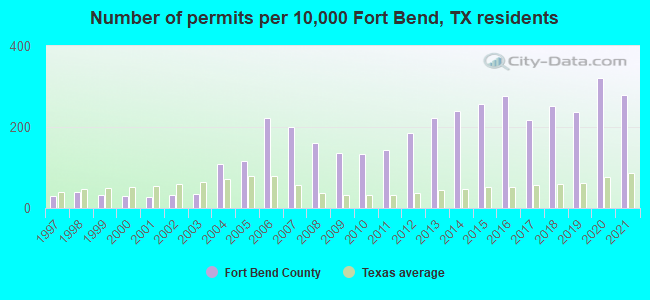
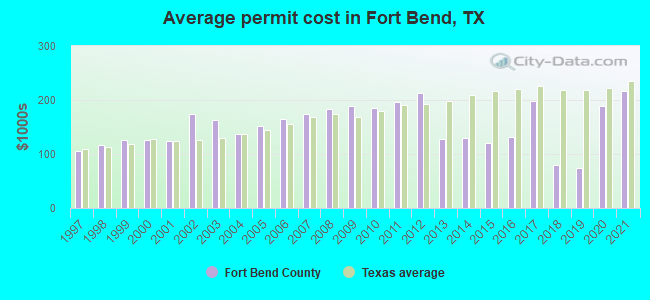
Single-family new house construction building permits:
- 2022: 8917 buildings, average cost: $240,800
- 2021: 9938 buildings, average cost: $216,100
- 2020: 11403 buildings, average cost: $188,300
- 2019: 8452 buildings, average cost: $74,500
- 2018: 8949 buildings, average cost: $80,100
- 2017: 7711 buildings, average cost: $197,900
- 2016: 9777 buildings, average cost: $130,800
- 2015: 9096 buildings, average cost: $120,800
- 2014: 8465 buildings, average cost: $129,200
- 2013: 7912 buildings, average cost: $126,600
- 2012: 6516 buildings, average cost: $213,200
- 2011: 5110 buildings, average cost: $196,300
- 2010: 4724 buildings, average cost: $185,400
- 2009: 4845 buildings, average cost: $189,100
- 2008: 5689 buildings, average cost: $182,500
- 2007: 7046 buildings, average cost: $175,400
- 2006: 7910 buildings, average cost: $164,000
- 2005: 4097 buildings, average cost: $151,300
- 2004: 3858 buildings, average cost: $136,500
- 2003: 1235 buildings, average cost: $163,000
- 2002: 1130 buildings, average cost: $174,800
- 2001: 936 buildings, average cost: $124,300
- 2000: 1063 buildings, average cost: $126,100
- 1999: 1148 buildings, average cost: $125,800
- 1998: 1368 buildings, average cost: $115,600
- 1997: 1044 buildings, average cost: $105,100
Median real estate property taxes paid for housing units with mortgages in 2022: $7,064 (1.9%)
Median real estate property taxes paid for housing units with no mortgage in 2022: $5,705 (1.8%)
| Fort Bend County: | 8.0% |
| Texas: | 14.0% |
Median age of residents in 2022: 37.4 years old
(Males: 36.8 years old, Females: 38.0 years old)
(Median age for: White residents: 41.5 years old, Black residents: 37.0 years old, American Indian residents: 40.5 years old, Asian residents: 38.8 years old, Hispanic or Latino residents: 32.1 years old, Other race residents: 33.1 years old)
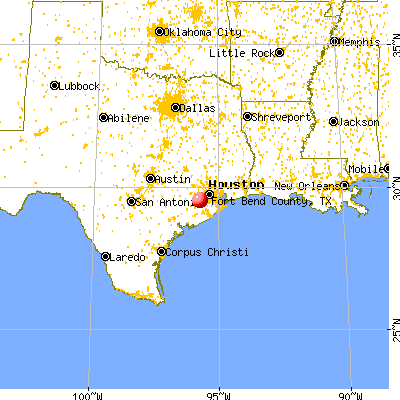
Area name: Houston-Baytown-Sugar Land, TX HUD Metro FMR Area
Fair market rent in 2006 for a 1-bedroom apartment in Fort Bend County is $612 a month.
Fair market rent for a 2-bedroom apartment is $743 a month.
Fair market rent for a 3-bedroom apartment is $990 a month.
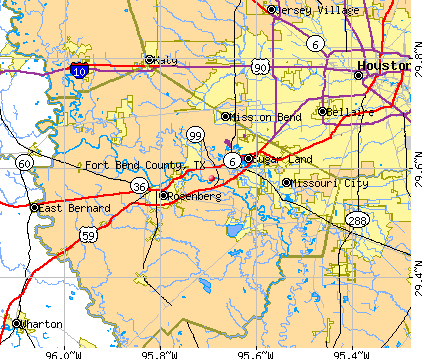
Cities in this county include: Sugar Land, Missouri City, Mission Bend, Rosenberg, Stafford, New Territory, Pecan Grove, Cinco Ranch, Richmond, Greatwood.
Notable locations in this county outside city limits:
Notable locations in Fort Bend County: DuBose Ranch Headquarters (A), Abercrombie Ranch (B), Quien Sabe Ranch (C), Wells Ranch (D), Kennard House (E), Luling Public Library (F), Pioneer Village (G), Belmont Volunteer Fire Department (H), Gonzales Warm Springs Rehabilitation Foundation (I), Braches House (J). Display/hide their locations on the map
Churches in Fort Bend County include: Princeville Church (A), Saint James Church (B), Saint Luke Church (C), Saint Union Church (D), Saturn Church (E), Pilgrim Church (F), Williams Chapel (G), Camp Valley Church (H), Clark Church (I). Display/hide their locations on the map
Cemeteries: Terrysville Cemetery (1), Andrews Chapel Cemetery (2), Antioch Cemetery (3), Askey Cemetery (4), Billings Cemetery (5), Watson Cemetery (6), Burrls Cemetery (7). Display/hide their locations on the map
Lakes and reservoirs: Bailey Lake (A), Pilgrim Lake (B), Jones Lake (C), Horseshoe Lake (D), Rinehart Lake (E), Mooney Lake (F), Long Lake (G), Wood Lake (H). Display/hide their locations on the map
Streams, rivers, and creeks: Board Branch (A), Williams Creek (B), Watson Creek (C), Vanham Creek (D), Valley Branch (E), Turkey Creek (F), Thompson Branch (G), Talley Branch (H), Sulphur Branch (I). Display/hide their locations on the map
Parks in Fort Bend County include: Independence Park (1), Gonzales Memorial Park (2), Palmetto State Park (3), M O Neasloney Wildlife Management Area (4), Palmetto State Park (5). Display/hide their locations on the map
Neighboring counties: Chambers County  , Marion County, Florida , St. Bernard Parish, Louisiana , St. James Parish, Louisiana , Volusia County, Florida , Matagorda County
  , Wharton County
  .
.
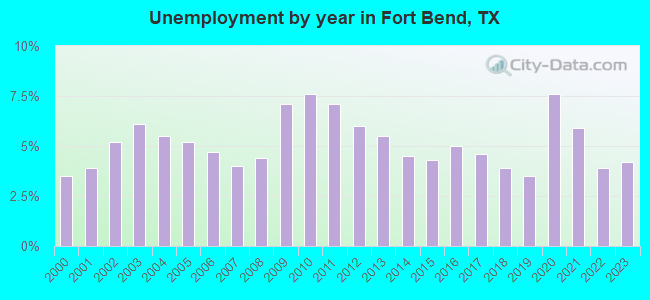
| Here: | 3.6% |
| Texas: | 3.5% |
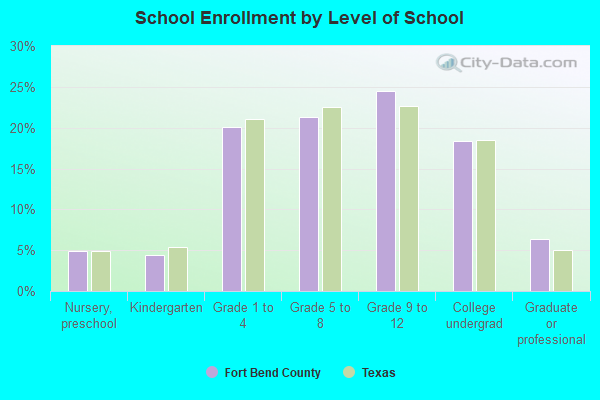
Current college students: 18,037
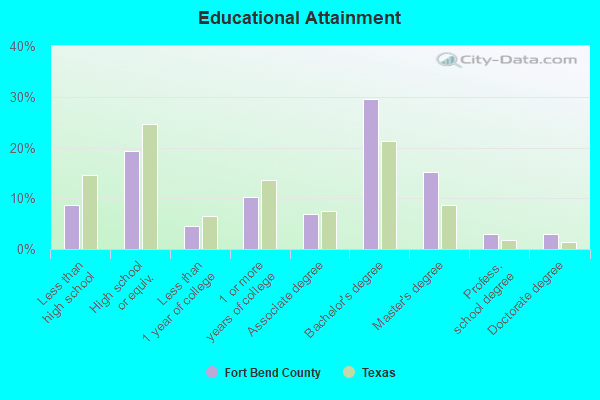
People 25 years of age or older with a high school degree or higher: 91.7%
People 25 years of age or older with a bachelor's degree or higher: 50.3%
Number of foreign born residents: 268,936 (63.5% naturalized citizens)
| Fort Bend County: | 30.2% |
| Whole state: | 17.2% |
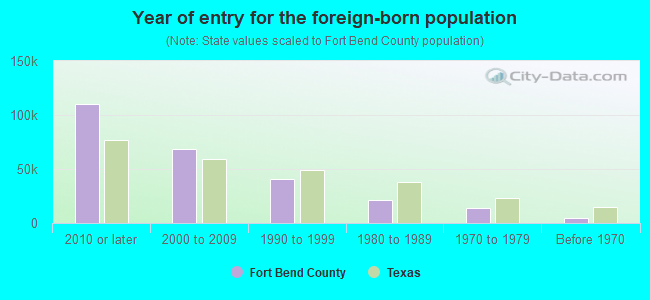
- Year of entry for the foreign-born population
- 100,5422010 or later
- 66,6872000 to 2009
- 49,2141990 to 1999
- 21,6821980 to 1989
- 14,3241970 to 1979
- 4,685Before 1970
Mean travel time to work (commute): minutes
Percentage of county residents living and working in this county: 99.6%
Housing units in structures:
- One, detached: 253,852
- One, attached: 5,491
- Two: 1,618
- 3 or 4: 2,496
- 5 to 9: 4,505
- 10 to 19: 6,303
- 20 to 49: 5,229
- 50 or more: 16,883
- Mobile homes: 9,275
- Boats, RVs, vans, etc.: 96
Housing units in Fort Bend County with a mortgage: 146,199 (6,531 second mortgage, 0 home equity loan, 5,054 both second mortgage and home equity loan)
Houses without a mortgage: 2,073
| Here: | 98.6% with mortgage |
| State: | 98.4% with mortgage |
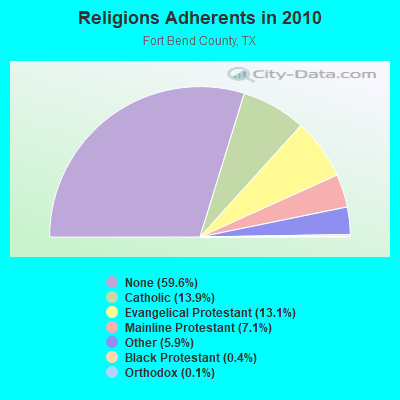
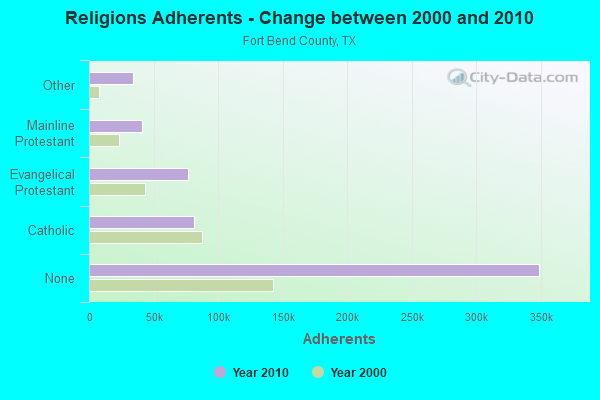
Religion statistics for Fort Bend County
| Religion | Adherents | Congregations |
|---|---|---|
| Catholic | 81,096 | 12 |
| Evangelical Protestant | 76,590 | 240 |
| Mainline Protestant | 41,419 | 39 |
| Other | 34,339 | 42 |
| Black Protestant | 2,103 | 11 |
| Orthodox | 865 | 3 |
| None | 348,963 | - |
Source: Clifford Grammich, Kirk Hadaway, Richard Houseal, Dale E.Jones, Alexei Krindatch, Richie Stanley and Richard H.Taylor. 2012. 2010 U.S.Religion Census: Religious Congregations & Membership Study. Association of Statisticians of American Religious Bodies. Jones, Dale E., et al. 2002. Congregations and Membership in the United States 2000. Nashville, TN: Glenmary Research Center.
Food Environment Statistics:
| Fort Bend County: | 1.30 / 10,000 pop. |
| State: | 1.47 / 10,000 pop. |
| Here: | 0.16 / 10,000 pop. |
| Texas: | 0.14 / 10,000 pop. |
| This county: | 1.10 / 10,000 pop. |
| Texas: | 1.11 / 10,000 pop. |
| Fort Bend County: | 3.01 / 10,000 pop. |
| Texas: | 3.95 / 10,000 pop. |
| This county: | 4.57 / 10,000 pop. |
| State: | 6.13 / 10,000 pop. |
| Fort Bend County: | 8.8% |
| Texas: | 8.9% |
| Fort Bend County: | 25.8% |
| State: | 26.6% |
| Here: | 16.2% |
| State: | 15.7% |
Agriculture in Fort Bend County:
Average size of farms: 266 acresAverage value of agricultural products sold per farm: $31,956
Average value of crops sold per acre for harvested cropland: $279.91
The value of nursery, greenhouse, floriculture, and sod as a percentage of the total market value of agricultural products sold: 21.49%
The value of livestock, poultry, and their products as a percentage of the total market value of agricultural products sold: 26.71%
Average total farm production expenses per farm: $33,753
Harvested cropland as a percentage of land in farms: 31.43%
Irrigated harvested cropland as a percentage of land in farms: 11.41%
Average market value of all machinery and equipment per farm: $45,762
The percentage of farms operated by a family or individual: 90.32%
Average age of principal farm operators: 55 years
Average number of cattle and calves per 100 acres of all land in farms: 13.15
Corn for grain: 12775 harvested acres
Upland cotton: 54654 harvested acres
Soybeans for beans: 1994 harvested acres
Land in orchards: 1,317 acres
Tornado activity:
Fort Bend County historical area-adjusted tornado activity is significantly below Texas state average. It is 5850096.9 times below overall U.S. average.Tornadoes in this county have caused 3 injuries recorded between 1950 and 2004.
On 9/20/1967, a tornado injured one person and caused between $50,000 and $500,000 in damages.
Earthquake activity:
Fort Bend County-area historical earthquake activity is significantly above Texas state average. It is 37% smaller than the overall U.S. average.On 10/20/2011 at 12:24:41, a magnitude 4.8 (4.8 MW, Depth: 3.1 mi, Class: Light, Intensity: IV - V) earthquake occurred 152.2 miles away from Fort Bend County center
On 5/17/2012 at 08:12:00, a magnitude 4.8 (4.8 MW, Depth: 3.1 mi) earthquake occurred 180.4 miles away from the county center
On 4/9/1993 at 12:29:19, a magnitude 4.3 (4.1 MB, 4.3 LG, Depth: 3.1 mi) earthquake occurred 156.0 miles away from the county center
On 9/2/2013 at 23:51:15, a magnitude 4.3 (4.3 MW, Depth: 2.9 mi) earthquake occurred 177.9 miles away from the county center
On 9/2/2013 at 21:52:38, a magnitude 4.2 (4.2 MW, Depth: 3.0 mi) earthquake occurred 179.1 miles away from Fort Bend County center
On 5/1/2018 at 16:28:56, a magnitude 4.0 (4.0 MW, Depth: 3.1 mi) earthquake occurred 145.9 miles away from the county center
Magnitude types: regional Lg-wave magnitude (LG), body-wave magnitude (MB), moment magnitude (MW)
Most recent natural disasters:
- Texas Covid-19 Pandemic, Incident Period: January 20, 2020, FEMA Id: 4485, Natural disaster type: Other
- Texas Hurricane Harvey, Incident Period: August 23, 2017 - September 15, 2017, FEMA Id: 4332, Natural disaster type: Hurricane
- Texas Severe Storms and Flooding, Incident Period: May 22, 2016 to June 24, 2016, Major Disaster (Presidential) Declared DR-4272: June 11, 2016, FEMA Id: 4272, Natural disaster type: Storm, Flood
- Texas Severe Storms and Flooding, Incident Period: April 17, 2016 to April 30, 2016, Major Disaster (Presidential) Declared DR-4269: April 25, 2016, FEMA Id: 4269, Natural disaster type: Storm, Flood
- Texas Severe Storms, Tornadoes, Straight-line Winds, and Flooding, Incident Period: May 04, 2015 to June 23, 2015, Major Disaster (Presidential) Declared DR-4223: May 29, 2015, FEMA Id: 4223, Natural disaster type: Storm, Tornado, Flood, Wind
- Texas Hurricane Ike, Incident Period: September 07, 2008 to October 02, 2008, Major Disaster (Presidential) Declared DR-1791: September 13, 2008, FEMA Id: 1791, Natural disaster type: Hurricane
- Texas Hurricane Ike, Incident Period: September 07, 2008 to September 26, 2008, Emergency Declared EM-3294: September 10, 2008, FEMA Id: 3294, Natural disaster type: Hurricane
- Texas Hurricane Gustav, Incident Period: August 27, 2008 to September 07, 2008, Emergency Declared EM-3290: August 29, 2008, FEMA Id: 3290, Natural disaster type: Hurricane
- Texas Hurricane Dean, Incident Period: August 17, 2007 to September 05, 2007, Emergency Declared EM-3277: August 18, 2007, FEMA Id: 3277, Natural disaster type: Hurricane
- Texas Lake Olympia Fire, Incident Period: May 26, 2006, Fire Management Assistance Declared: May 26, 2006, FEMA Id: 2639, Natural disaster type: Fire
- 10 other natural disasters have been reported since 1953.
The number of natural disasters in Fort Bend County (20) is greater than the US average (15).
Major Disasters (Presidential) Declared: 11
Emergencies Declared: 6
Causes of natural disasters: Hurricanes: 9, Storms: 8, Floods: 7, Tornadoes: 3, Fires: 2, Wind: 1, Other: 1 (Note: some incidents may be assigned to more than one category).
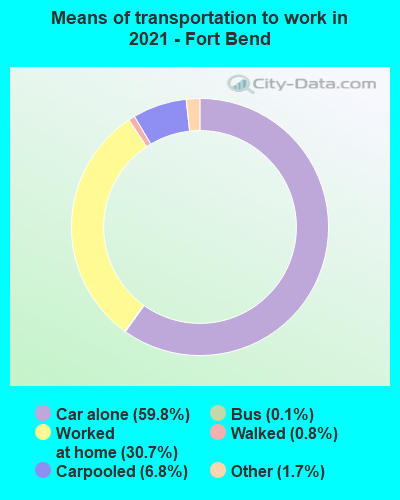
Means of transportation to work:
- Drove a car alone: 177,164 (63.2%)
- Carpooled: 26,159 (9.3%)
- Bus: 238 (0.1%)
- Ferryboat: 127 (0.0%)
- Taxicab, motorcycle, or other means: 4,209 (1.5%)
- Bicycle: 170 (0.1%)
- Walked: 2,892 (1.0%)
- Worked at home: 69,492 (24.8%)
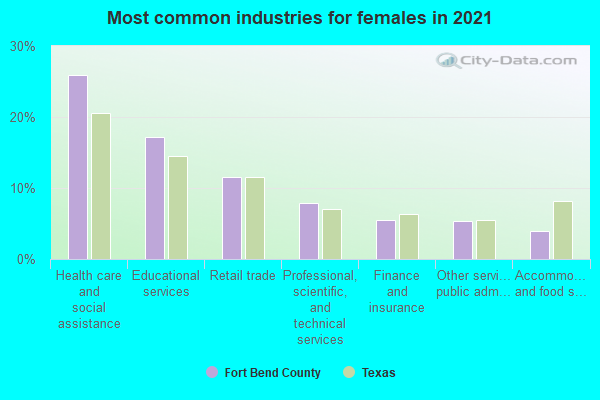
- Health care and social assistance (19%)
- Educational services (14%)
- Professional, scientific, and technical services (8%)
- Retail trade (7%)
- Finance and insurance (6%)
- Accommodation and food services (5%)
- Other services, except public administration (4%)
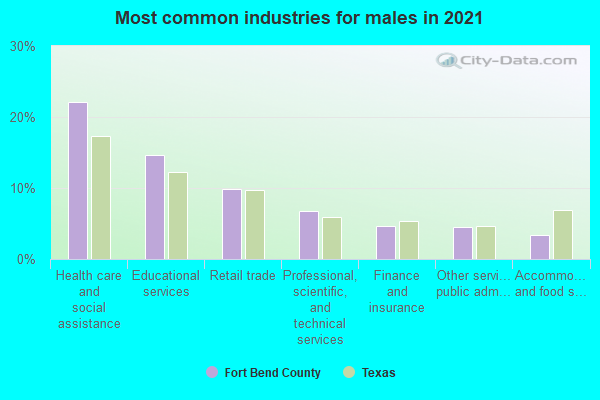
- Health care and social assistance (22%)
- Educational services (17%)
- Professional, scientific, and technical services (9%)
- Retail trade (8%)
- Finance and insurance (7%)
- Accommodation and food services (6%)
- Other services, except public administration (5%)
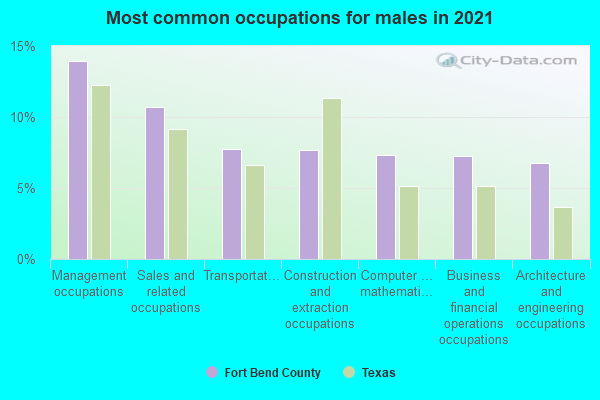
- Management occupations (16%)
- Sales and related occupations (10%)
- Business and financial operations occupations (8%)
- Architecture and engineering occupations (8%)
- Computer and mathematical occupations (7%)
- Construction and extraction occupations (6%)
- Production occupations (5%)
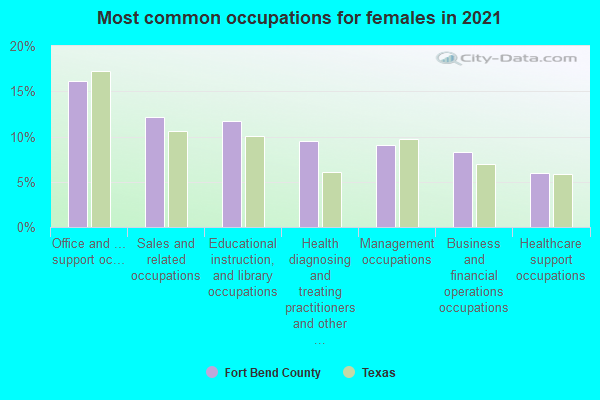
- Office and administrative support occupations (15%)
- Educational instruction, and library occupations (12%)
- Management occupations (10%)
- Business and financial operations occupations (10%)
- Health diagnosing and treating practitioners and other technical occupations (9%)
- Sales and related occupations (9%)
- Healthcare support occupations (5%)
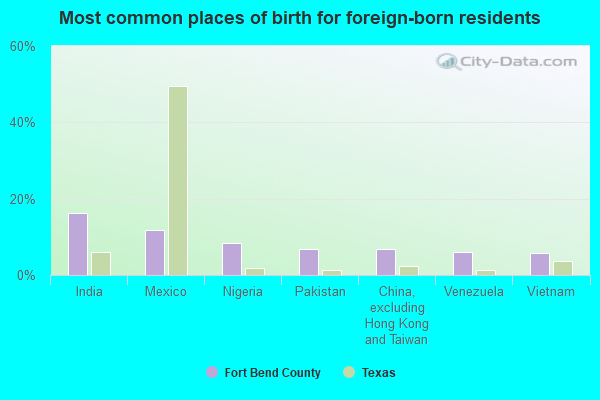
- India (17%)
- Mexico (11%)
- Pakistan (7%)
- China, excluding Hong Kong and Taiwan (7%)
- Nigeria (7%)
- Vietnam (5%)
- Venezuela (5%)
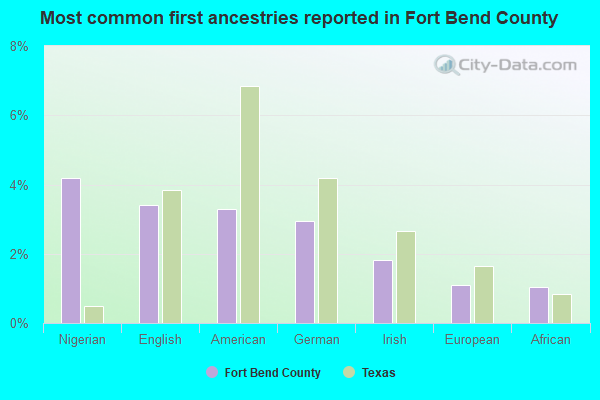
- English (4%)
- Nigerian (4%)
- American (3%)
- German (3%)
- Irish (2%)
- European (1%)
- Italian (1%)
People in group quarters in Fort Bend County, Texas in 2010:
- 2,078 people in state prisons
- 1,412 people in federal prisons
- 997 people in local jails and other municipal confinement facilities
- 974 people in nursing facilities/skilled-nursing facilities
- 98 people in workers' group living quarters and job corps centers
- 92 people in emergency and transitional shelters (with sleeping facilities) for people experiencing homelessness
- 89 people in residential treatment centers for juveniles (non-correctional)
- 54 people in correctional facilities intended for juveniles
- 52 people in group homes intended for adults
- 45 people in residential treatment centers for adults
- 43 people in other noninstitutional facilities
- 2 people in college/university student housing
People in group quarters in Fort Bend County, Texas in 2000:
- 3,125 people in state prisons
- 956 people in local jails and other confinement facilities (including police lockups)
- 707 people in other noninstitutional group quarters
- 683 people in nursing homes
- 630 people in other nonhousehold living situations
- 85 people in other group homes
- 64 people in short-term care, detention or diagnostic centers for delinquent children
- 33 people in religious group quarters
- 15 people in homes for abused, dependent, and neglected children
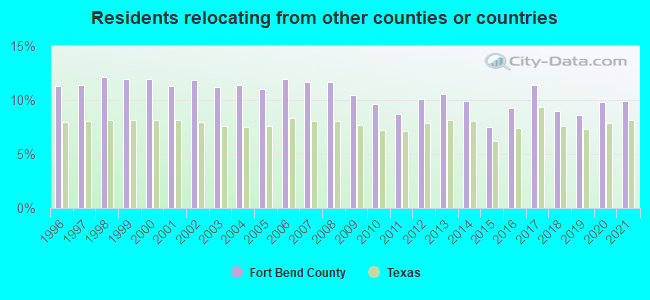
9.87% of this county's 2021 resident taxpayers lived in other counties in 2020 ($76,996 average adjusted gross income)
| Here: | 9.87% |
| Texas average: | 8.12% |
0.01% of residents moved from foreign countries ($59 average AGI)
Fort Bend County: 0.01% Texas average: 0.04%
7.37% relocated from other counties in Texas ($51,773 average AGI)
2.48% relocated from other states ($25,164 average AGI)
Fort Bend County: 2.48% Texas average: 2.83%
Top counties from which taxpayers relocated into this county between 2020 and 2021:
| from Harris County, TX | |
| from Brazoria County, TX | |
| from Travis County, TX | |
| from Los Angeles County, CA | |
| from Bexar County, TX | |
| from Montgomery County, TX | |
| from Galveston County, TX |
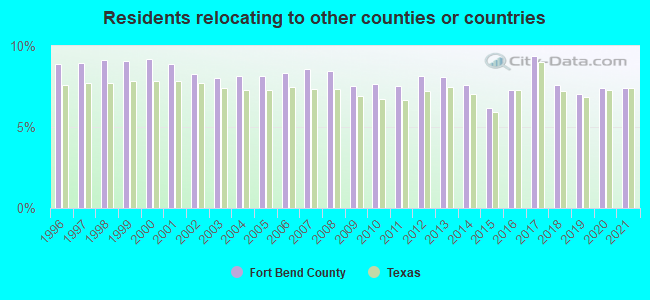
7.39% of this county's 2020 resident taxpayers moved to other counties in 2021 ($84,563 average adjusted gross income)
| Here: | 7.39% |
| Texas average: | 7.40% |
0.01% of residents moved to foreign countries ($83 average AGI)
Fort Bend County: 0.01% Texas average: 0.03%
5.78% relocated to other counties in Texas ($61,528 average AGI)
1.60% relocated to other states ($22,952 average AGI)
Fort Bend County: 1.60% Texas average: 2.08%
Top counties to which taxpayers relocated from this county between 2020 and 2021:
| to Harris County, TX | |
| to Brazoria County, TX | |
| to Montgomery County, TX | |
| to Travis County, TX | |
| to Bexar County, TX | |
| to Waller County, TX | |
| to Galveston County, TX |
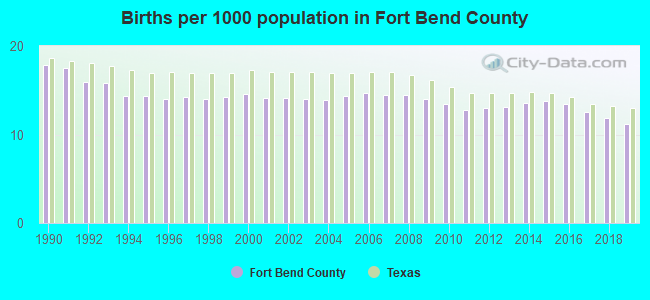
Births per 1000 population from 1990 to 1999: 15.2
Births per 1000 population from 2000 to 2009: 14.3
Births per 1000 population from 2010 to 2022: 10.7
Deaths per 1000 population from 1990 to 1999: 3.9
Deaths per 1000 population from 2000 to 2009: 3.9
Deaths per 1000 population from 2010 to 2020: 4.3

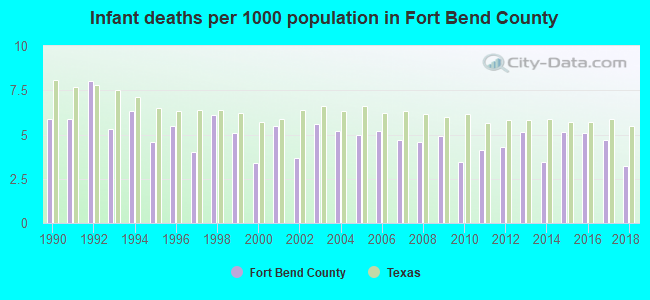
Infant deaths per 1000 live births from 1990 to 1999: 5.7
Infant deaths per 1000 live births from 2000 to 2009: 4.8
Infant deaths per 1000 live births from 2010 to 2021: 4.3
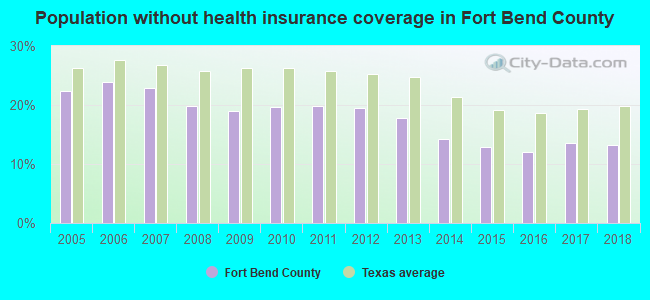
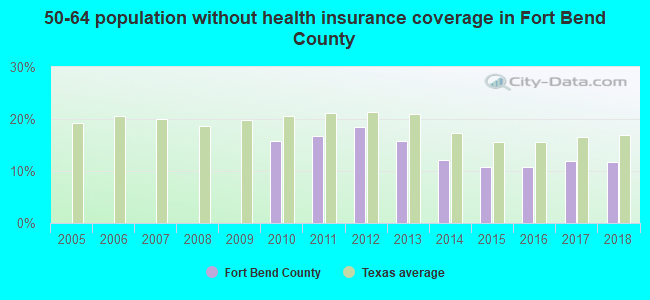
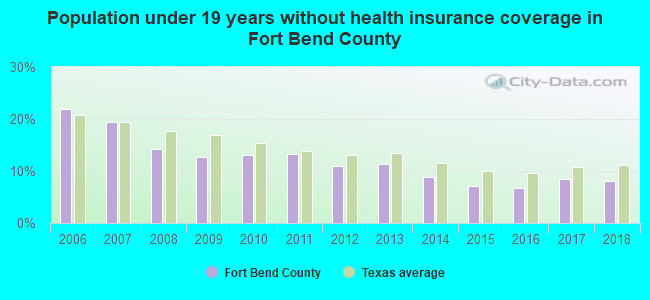
Persons under 19 years old without health insurance coverage in 2018: 8.1%
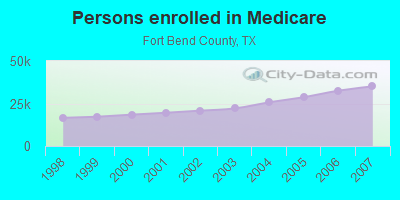
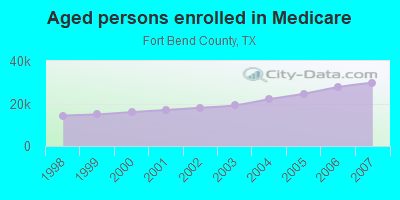
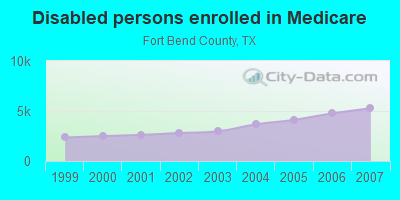
Persons enrolled in hospital insurance and/or supplemental medical insurance (Medicare) in July 1, 2007: 35,088 (29,820 aged, 5,268 disabled)
Children under 18 without health insurance coverage in 2007: 28,893 (19%)
Most common underlying causes of death in Fort Bend County, Texas in 1999 - 2019:
- Atherosclerotic heart disease (2,656)
- Bronchus or lung, unspecified - Malignant neoplasms (2,533)
- Acute myocardial infarction, unspecified (2,326)
- Unspecified dementia (1,600)
- Alzheimer disease, unspecified (1,502)
- Septicaemia, unspecified (1,261)
- Atherosclerotic cardiovascular disease, so described (1,149)
- Chronic obstructive pulmonary disease, unspecified (1,122)
- Stroke, not specified as haemorrhage or infarction (1,105)
- Breast, unspecified - Malignant neoplasms (1,026)
Population without health insurance coverage in 2000: 16%
Children under 18 without health insurance coverage in 2000: 17%
Short term general hospital admissions per 100,000 population in 2004: 4,304
Short term general hospital beds per 100,000 population in 2004: 75
Emergency room visits per 100,000 population in 2004: 21,938
General practice office based MDs per 100,000 population in 2005: 1,365
Medical specialist MDs per 100,000 population in 2005: 371
Dentists per 100,000 population in 1998: 5
Total births per 100,000 population, July 2005 - July 2006 : 34
Total deaths per 100,000 population, July 2005 - July 2006: 68
Limited-service eating places per 100,000 population in 2005 : 6
Beer, wine & liquor stores per 100,000 population in 2005: 1
Homicides per 1,000,000 population from 2000 to 2006: 44.8. This is less than state average.
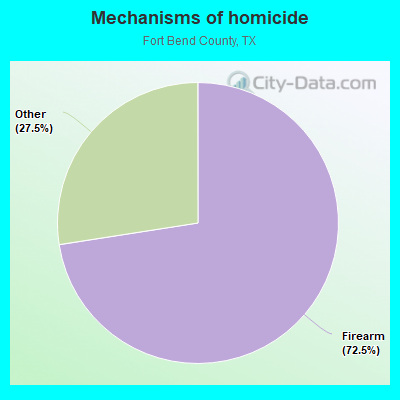
- Firearm - 32.5
- Other - 12.3
Suicides per 1,000,000 population from 2000 to 2006: 81.8. This is less than state average.
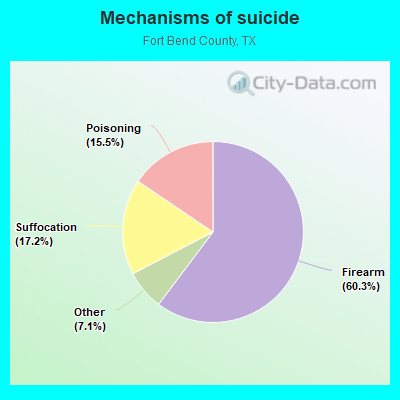
- Firearm - 49.3
- Suffocation - 14.0
- Poisoning - 12.7
- Other - 5.8
Household type by relationship:
Households: 889,146- Male householders: 166,223 (21,914 living alone), Female householders: 128,868 (25,425 living alone)
190,217 spouses (188,879 opposite-sex spouses), 14,353 unmarried partners, (14,039 opposite-sex unmarried partners), 307,726 children (289,692 natural, 6,553 adopted, 11,481 stepchildren), 21,775 grandchildren, 9,017 brothers or sisters, 18,025 parents, 83 foster children, 13,473 other relatives, 13,530 non-relatives
- In group quarters: 5,856
Size of family households: 76,639 2-persons, 59,374 3-persons, 55,651 4-persons, 31,498 5-persons, 9,701 6-persons, 5,008 7-or-more-persons.
Size of nonfamily households: 47,339 1-person, 7,745 2-persons, 1,284 3-persons, 453 4-persons, 54 5-persons, 345 7-or-more-persons.
168,514 married couples with children.
43,127 single-parent households (7,986 men, 35,141 women).
59.4% of residents of Fort Bend speak English at home.
17.6% of residents speak Spanish at home (67% speak English very well, 19% speak English well, 11% speak English not well, 4% don't speak English at all).
9.0% of residents speak other Indo-European language at home (77% speak English very well, 17% speak English well, 5% speak English not well, 2% don't speak English at all).
10.9% of residents speak Asian or Pacific Island language at home (59% speak English very well, 26% speak English well, 11% speak English not well, 3% don't speak English at all).
3.1% of residents speak other language at home (86% speak English very well, 10% speak English well, 3% speak English not well, 2% don't speak English at all).
In fiscal year 2004:
Federal Government expenditure: $882,588,000 ($1,994 per capita)
Department of Defense expenditure: $50,302,000
Federal direct payments to individuals for retirement and disability: $411,698,000
Federal other direct payments to individuals: $123,478,000
Federal direct payments not to individuals: $39,032,000
Federal grants: $148,807,000
Federal procurement contracts: $97,833,000 ($11,374,000 Department of Defense)
Federal salaries and wages: $61,739,000 ($429,000 Department of Defense)
Federal Government direct loans: $846,000
Federal guaranteed/insured loans: $325,351,000
Federal Government insurance: $3,705,416,000
Population change from April 1, 2000 to July 1, 2005:
Births: 29,455| Here: | 64 per 1000 residents |
| State: | 85 per 1000 residents |
Deaths: 8,213
| Here: | 18 per 1000 residents |
| State: | 35 per 1000 residents |
Net international migration: +10,308
| Here: | +22 per 1000 residents |
| State: | +29 per 1000 residents |
Net internal migration: +78,350
| Here: | +169 per 1000 residents |
| State: | +10 per 1000 residents |
Total withdrawal of fresh water for public supply: 69.41 millions of gallons per day (75% from ground, 25% from surface)
| Here: | 7.1 |
| State: | 6.3 |
| Here: | 4.6 |
| State: | 4.0 |
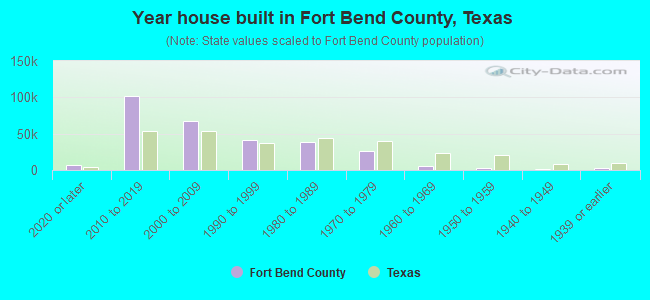
- Year house built in Fort Bend County, Texas
- 19,1602020 or later
- 96,2802010 to 2019
- 73,5142000 to 2009
- 40,9691990 to 1999
- 35,5911980 to 1989
- 26,5921970 to 1979
- 7,1191960 to 1969
- 3,0651950 to 1959
- 1,0381940 to 1949
- 2,4201939 or earlier
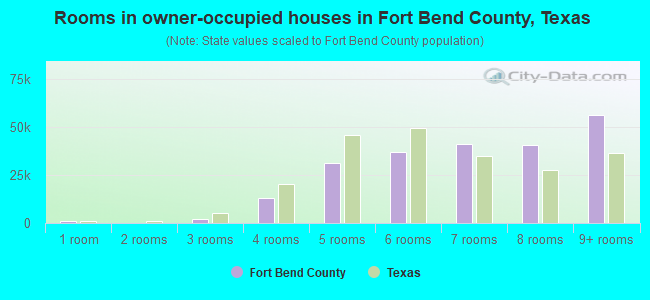
- Rooms in owner-occupied houses in Fort Bend County, Texas
- 1,1601 room
- 1,0202 rooms
- 1,7463 rooms
- 10,4494 rooms
- 30,7195 rooms
- 50,5946 rooms
- 31,4987 rooms
- 35,2788 rooms
- 64,8319+ rooms
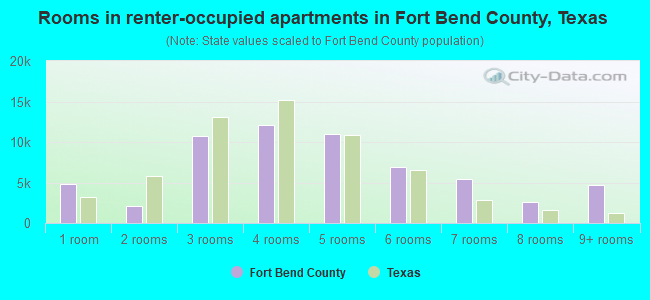
- Rooms in renter-occupied apartments in Fort Bend County, Texas
- 3,5491 room
- 7,1542 rooms
- 8,5993 rooms
- 13,7354 rooms
- 11,9915 rooms
- 10,7626 rooms
- 4,9337 rooms
- 2,3828 rooms
- 4,6919+ rooms
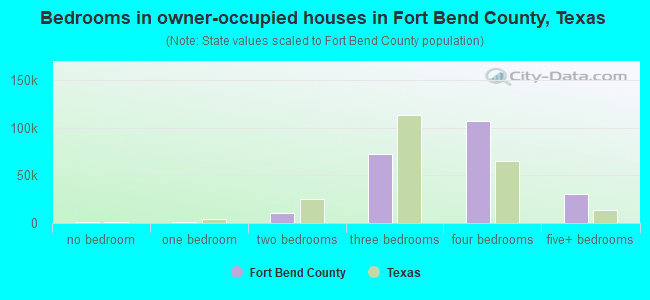
- Bedrooms in owner-occupied houses in Fort Bend County, Texas
- 1,360no bedroom
- 1,1051 bedroom
- 9,0772 bedrooms
- 81,7223 bedrooms
- 99,7254 bedrooms
- 34,3065+ bedrooms
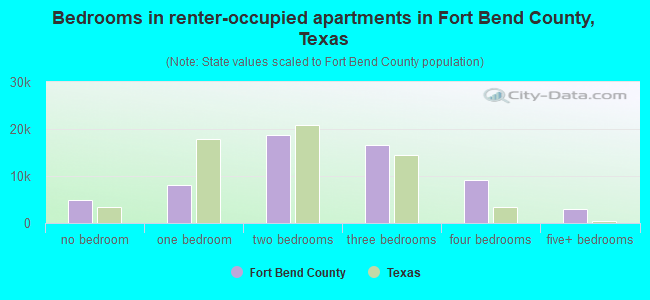
- Bedrooms in renter-occupied apartments in Fort Bend County, Texas
- 3,673no bedroom
- 15,1071 bedroom
- 16,6482 bedrooms
- 18,5913 bedrooms
- 12,5274 bedrooms
- 1,2505+ bedrooms
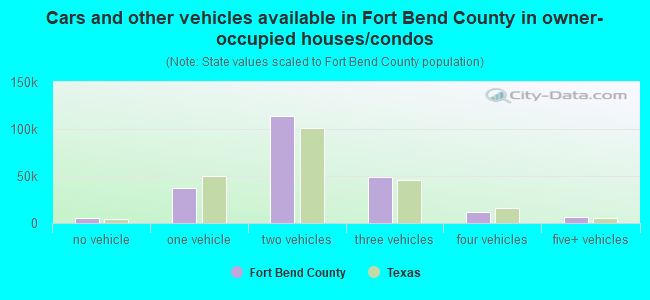
- Cars and other vehicles available in Fort Bend County in owner-occupied houses/condos
- 3,320no vehicle
- 39,3311 vehicle
- 118,5342 vehicles
- 45,8183 vehicles
- 14,5154 vehicles
- 5,7775+ vehicles
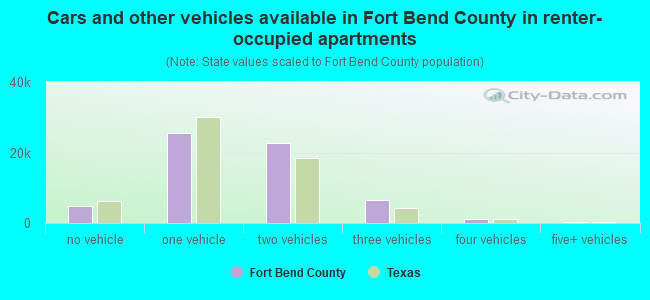
- Cars and other vehicles available in Fort Bend County in renter-occupied apartments
- 5,100no vehicle
- 27,0261 vehicle
- 25,6862 vehicles
- 7,7243 vehicles
- 1,8444 vehicles
- 4165+ vehicles
90.1% of Fort Bend County residents lived in the same house 1 years ago.
Out of people who lived in different houses, 29% lived in this county.
Out of people who lived in different counties, 74% lived in Texas.
| Fort Bend County: | 90.1% |
| State average: | 85.7% |
Place of birth for U.S.-born residents:
- This state: 414,151
- Other state: 189,444
- Northeast: 29,492
- Midwest: 45,787
- South: 71,375
- West: 42,790
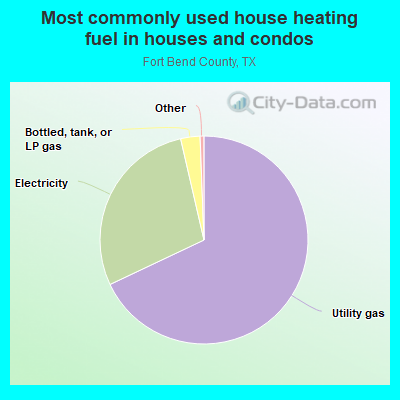
- 65.5%Utility gas
- 29.8%Electricity
- 3.5%Bottled, tank, or LP gas
- 0.5%No fuel used
- 0.3%Other fuel
- 0.3%Solar energy
- 0.1%Fuel oil, kerosene, etc.
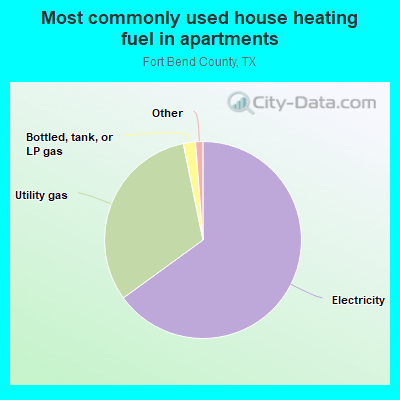
- 67.9%Electricity
- 26.7%Utility gas
- 3.5%Bottled, tank, or LP gas
- 1.9%No fuel used
Private vs. public school enrollment:
| Here: | 7.8% |
| Texas: | 8.8% |
| Here: | 9.7% |
| Texas: | 8.0% |
| Here: | 12.5% |
| Texas: | 16.2% |
Fort Bend County government finances - Expenditure in 2018:
- Bond Funds - Cash and Securities: $139,224,000
Cash and Securities: $80,700,000
- Charges - Toll Highways: $59,497,000
Toll Highways: $51,559,000
Other: $38,131,000
Other: $35,104,000
Regular Highways: $7,733,000
Regular Highways: $6,920,000
Natural Resources - Other: $293,000
Parks and Recreation: $213,000
Parks and Recreation: $145,000
Natural Resources - Other: $94,000
Housing and Community Development: $35,000
Housing and Community Development: $32,000
- Construction - Regular Highways: $58,760,000
Regular Highways: $46,700,000
Toll Highways: $31,042,000
Parks and Recreation: $30,665,000
Parks and Recreation: $21,700,000
Toll Highways: $20,654,000
General - Other: $19,086,000
General - Other: $19,047,000
Libraries: $11,423,000
Judicial and Legal Services: $10,204,000
Police Protection: $8,815,000
Natural Resources - Other: $2,641,000
Natural Resources - Other: $1,259,000
Central Staff Services: $125,000
Central Staff Services: $116,000
- Current Operations - Police Protection: $50,301,000
Police Protection: $45,793,000
Judicial and Legal Services: $42,793,000
Judicial and Legal Services: $38,531,000
Correctional Institutions: $35,989,000
Correctional Institutions: $33,019,000
General - Other: $30,727,000
General - Other: $27,379,000
Corrections - Other: $23,859,000
Corrections - Other: $23,275,000
Regular Highways: $21,963,000
Health - Other: $21,566,000
Financial Administration: $21,167,000
Regular Highways: $21,078,000
Financial Administration: $19,913,000
Health - Other: $18,758,000
Toll Highways: $18,184,000
Libraries: $17,299,000
Libraries: $16,250,000
Toll Highways: $15,751,000
Natural Resources - Other: $12,160,000
Natural Resources - Other: $10,076,000
Central Staff Services: $9,730,000
Central Staff Services: $8,744,000
General Public Buildings: $7,663,000
General Public Buildings: $6,943,000
Local Fire Protection: $2,980,000
Local Fire Protection: $2,835,000
Public Welfare - Other: $2,737,000
Housing and Community Development: $2,694,000
Public Welfare - Other: $2,496,000
Housing and Community Development: $2,465,000
Public Welfare, Vendor Payments for Medical Care: $2,430,000
Parks and Recreation: $2,103,000
Public Welfare, Vendor Payments for Medical Care: $2,099,000
Parks and Recreation: $1,888,000
Solid Waste Management: $393,000
Solid Waste Management: $392,000
Protective Inspection and Regulation - Other: $6,000
Protective Inspection and Regulation - Other: $4,000
- Federal Intergovernmental - Housing and Community Development: $2,712,000
Housing and Community Development: $2,640,000
Highways: $33,000
- General - Interest on Debt: $44,703,000
Interest on Debt: $41,861,000
- Long Term Debt - Beginning Outstanding - Unspecified Public Purpose: $884,766,000
Outstanding Unspecified Public Purpose: $858,649,000
Outstanding Unspecified Public Purpose: $847,145,000
Beginning Outstanding - Unspecified Public Purpose: $817,100,000
Beginning Outstanding - Public Debt for Private Purpose: $138,469,000
Outstanding Nonguaranteed - Industrial Revenue: $136,205,000
Beginning Outstanding - Public Debt for Private Purpose: $135,829,000
Outstanding Nonguaranteed - Industrial Revenue: $135,453,000
Issue, Unspecified Public Purpose: $68,359,000
Retired Unspecified Public Purpose: $37,621,000
Retired Unspecified Public Purpose: $26,810,000
Retired Nonguaranteed - Public Debt for Private Purpose: $2,264,000
Retired Nonguaranteed - Public Debt for Private Purpose: $376,000
- Miscellaneous - Interest Earnings: $15,467,000
Fines and Forfeits: $15,249,000
Fines and Forfeits: $10,502,000
Interest Earnings: $10,180,000
General Revenue - Other: $8,819,000
General Revenue - Other: $7,867,000
Donations From Private Sources: $80,000
Donations From Private Sources: $56,000
- Other Capital Outlay - Toll Highways: $7,260,000
Police Protection: $2,414,000
Regular Highways: $2,234,000
Police Protection: $2,181,000
General - Other: $1,607,000
Toll Highways: $1,515,000
Health - Other: $1,362,000
Health - Other: $1,173,000
Regular Highways: $1,121,000
General - Other: $629,000
Corrections - Other: $593,000
Libraries: $254,000
Natural Resources - Other: $225,000
Local Fire Protection: $182,000
Correctional Institutions: $145,000
Parks and Recreation: $131,000
Corrections - Other: $109,000
Correctional Institutions: $88,000
General Public Building: $87,000
Solid Waste Management: $79,000
Local Fire Protection: $78,000
General Public Building: $66,000
Financial Administration: $62,000
Natural Resources - Other: $58,000
Parks and Recreation: $52,000
Judicial and Legal Services: $33,000
Libraries: $30,000
- Other Funds - Cash and Securities: $254,175,000
Cash and Securities: $196,129,000
- Sinking Funds - Cash and Securities: $191,934,000
Cash and Securities: $161,527,000
- State Intergovernmental - Other: $42,363,000
Other: $39,234,000
Highways: $6,161,000
Highways: $4,925,000
General Local Government Support: $1,665,000
General Local Government Support: $1,534,000
Public Welfare: $145,000
Public Welfare: $45,000
- Tax - Property: $316,458,000
Property: $287,983,000
General Sales and Gross Receipts: $9,210,000
General Sales and Gross Receipts: $6,858,000
Fort Bend County government finances - Revenue in 2018:
- Bond Funds - Cash and Securities: $139,224,000
Cash and Securities: $80,700,000
- Charges - Toll Highways: $59,497,000
Toll Highways: $51,559,000
Other: $38,131,000
Other: $35,104,000
Regular Highways: $7,733,000
Regular Highways: $6,920,000
Natural Resources - Other: $293,000
Parks and Recreation: $213,000
Parks and Recreation: $145,000
Natural Resources - Other: $94,000
Housing and Community Development: $35,000
Housing and Community Development: $32,000
- Construction - Regular Highways: $58,760,000
Regular Highways: $46,700,000
Toll Highways: $31,042,000
Parks and Recreation: $30,665,000
Parks and Recreation: $21,700,000
Toll Highways: $20,654,000
General - Other: $19,086,000
General - Other: $19,047,000
Libraries: $11,423,000
Judicial and Legal Services: $10,204,000
Police Protection: $8,815,000
Natural Resources - Other: $2,641,000
Natural Resources - Other: $1,259,000
Central Staff Services: $125,000
Central Staff Services: $116,000
- Current Operations - Police Protection: $50,301,000
Police Protection: $45,793,000
Judicial and Legal Services: $42,793,000
Judicial and Legal Services: $38,531,000
Correctional Institutions: $35,989,000
Correctional Institutions: $33,019,000
General - Other: $30,727,000
General - Other: $27,379,000
Corrections - Other: $23,859,000
Corrections - Other: $23,275,000
Regular Highways: $21,963,000
Health - Other: $21,566,000
Financial Administration: $21,167,000
Regular Highways: $21,078,000
Financial Administration: $19,913,000
Health - Other: $18,758,000
Toll Highways: $18,184,000
Libraries: $17,299,000
Libraries: $16,250,000
Toll Highways: $15,751,000
Natural Resources - Other: $12,160,000
Natural Resources - Other: $10,076,000
Central Staff Services: $9,730,000
Central Staff Services: $8,744,000
General Public Buildings: $7,663,000
General Public Buildings: $6,943,000
Local Fire Protection: $2,980,000
Local Fire Protection: $2,835,000
Public Welfare - Other: $2,737,000
Housing and Community Development: $2,694,000
Public Welfare - Other: $2,496,000
Housing and Community Development: $2,465,000
Public Welfare, Vendor Payments for Medical Care: $2,430,000
Parks and Recreation: $2,103,000
Public Welfare, Vendor Payments for Medical Care: $2,099,000
Parks and Recreation: $1,888,000
Solid Waste Management: $393,000
Solid Waste Management: $392,000
Protective Inspection and Regulation - Other: $6,000
Protective Inspection and Regulation - Other: $4,000
- Federal Intergovernmental - Housing and Community Development: $2,712,000
Housing and Community Development: $2,640,000
Highways: $33,000
- General - Interest on Debt: $44,703,000
Interest on Debt: $41,861,000
- Long Term Debt - Beginning Outstanding - Unspecified Public Purpose: $884,766,000
Outstanding Unspecified Public Purpose: $858,649,000
Outstanding Unspecified Public Purpose: $847,145,000
Beginning Outstanding - Unspecified Public Purpose: $817,100,000
Beginning Outstanding - Public Debt for Private Purpose: $138,469,000
Outstanding Nonguaranteed - Industrial Revenue: $136,205,000
Beginning Outstanding - Public Debt for Private Purpose: $135,829,000
Outstanding Nonguaranteed - Industrial Revenue: $135,453,000
Issue, Unspecified Public Purpose: $68,359,000
Retired Unspecified Public Purpose: $37,621,000
Retired Unspecified Public Purpose: $26,810,000
Retired Nonguaranteed - Public Debt for Private Purpose: $2,264,000
Retired Nonguaranteed - Public Debt for Private Purpose: $376,000
- Miscellaneous - Interest Earnings: $15,467,000
Fines and Forfeits: $15,249,000
Fines and Forfeits: $10,502,000
Interest Earnings: $10,180,000
General Revenue - Other: $8,819,000
General Revenue - Other: $7,867,000
Donations From Private Sources: $80,000
Donations From Private Sources: $56,000
- Other Capital Outlay - Toll Highways: $7,260,000
Police Protection: $2,414,000
Regular Highways: $2,234,000
Police Protection: $2,181,000
General - Other: $1,607,000
Toll Highways: $1,515,000
Health - Other: $1,362,000
Health - Other: $1,173,000
Regular Highways: $1,121,000
General - Other: $629,000
Corrections - Other: $593,000
Libraries: $254,000
Natural Resources - Other: $225,000
Local Fire Protection: $182,000
Correctional Institutions: $145,000
Parks and Recreation: $131,000
Corrections - Other: $109,000
Correctional Institutions: $88,000
General Public Building: $87,000
Solid Waste Management: $79,000
Local Fire Protection: $78,000
General Public Building: $66,000
Financial Administration: $62,000
Natural Resources - Other: $58,000
Parks and Recreation: $52,000
Judicial and Legal Services: $33,000
Libraries: $30,000
- Other Funds - Cash and Securities: $254,175,000
Cash and Securities: $196,129,000
- Sinking Funds - Cash and Securities: $191,934,000
Cash and Securities: $161,527,000
- State Intergovernmental - Other: $42,363,000
Other: $39,234,000
Highways: $6,161,000
Highways: $4,925,000
General Local Government Support: $1,665,000
General Local Government Support: $1,534,000
Public Welfare: $145,000
Public Welfare: $45,000
- Tax - Property: $316,458,000
Property: $287,983,000
General Sales and Gross Receipts: $9,210,000
General Sales and Gross Receipts: $6,858,000
Fort Bend County government finances - Debt in 2018:
- Bond Funds - Cash and Securities: $139,224,000
Cash and Securities: $80,700,000
- Charges - Toll Highways: $59,497,000
Toll Highways: $51,559,000
Other: $38,131,000
Other: $35,104,000
Regular Highways: $7,733,000
Regular Highways: $6,920,000
Natural Resources - Other: $293,000
Parks and Recreation: $213,000
Parks and Recreation: $145,000
Natural Resources - Other: $94,000
Housing and Community Development: $35,000
Housing and Community Development: $32,000
- Construction - Regular Highways: $58,760,000
Regular Highways: $46,700,000
Toll Highways: $31,042,000
Parks and Recreation: $30,665,000
Parks and Recreation: $21,700,000
Toll Highways: $20,654,000
General - Other: $19,086,000
General - Other: $19,047,000
Libraries: $11,423,000
Judicial and Legal Services: $10,204,000
Police Protection: $8,815,000
Natural Resources - Other: $2,641,000
Natural Resources - Other: $1,259,000
Central Staff Services: $125,000
Central Staff Services: $116,000
- Current Operations - Police Protection: $50,301,000
Police Protection: $45,793,000
Judicial and Legal Services: $42,793,000
Judicial and Legal Services: $38,531,000
Correctional Institutions: $35,989,000
Correctional Institutions: $33,019,000
General - Other: $30,727,000
General - Other: $27,379,000
Corrections - Other: $23,859,000
Corrections - Other: $23,275,000
Regular Highways: $21,963,000
Health - Other: $21,566,000
Financial Administration: $21,167,000
Regular Highways: $21,078,000
Financial Administration: $19,913,000
Health - Other: $18,758,000
Toll Highways: $18,184,000
Libraries: $17,299,000
Libraries: $16,250,000
Toll Highways: $15,751,000
Natural Resources - Other: $12,160,000
Natural Resources - Other: $10,076,000
Central Staff Services: $9,730,000
Central Staff Services: $8,744,000
General Public Buildings: $7,663,000
General Public Buildings: $6,943,000
Local Fire Protection: $2,980,000
Local Fire Protection: $2,835,000
Public Welfare - Other: $2,737,000
Housing and Community Development: $2,694,000
Public Welfare - Other: $2,496,000
Housing and Community Development: $2,465,000
Public Welfare, Vendor Payments for Medical Care: $2,430,000
Parks and Recreation: $2,103,000
Public Welfare, Vendor Payments for Medical Care: $2,099,000
Parks and Recreation: $1,888,000
Solid Waste Management: $393,000
Solid Waste Management: $392,000
Protective Inspection and Regulation - Other: $6,000
Protective Inspection and Regulation - Other: $4,000
- Federal Intergovernmental - Housing and Community Development: $2,712,000
Housing and Community Development: $2,640,000
Highways: $33,000
- General - Interest on Debt: $44,703,000
Interest on Debt: $41,861,000
- Long Term Debt - Beginning Outstanding - Unspecified Public Purpose: $884,766,000
Outstanding Unspecified Public Purpose: $858,649,000
Outstanding Unspecified Public Purpose: $847,145,000
Beginning Outstanding - Unspecified Public Purpose: $817,100,000
Beginning Outstanding - Public Debt for Private Purpose: $138,469,000
Outstanding Nonguaranteed - Industrial Revenue: $136,205,000
Beginning Outstanding - Public Debt for Private Purpose: $135,829,000
Outstanding Nonguaranteed - Industrial Revenue: $135,453,000
Issue, Unspecified Public Purpose: $68,359,000
Retired Unspecified Public Purpose: $37,621,000
Retired Unspecified Public Purpose: $26,810,000
Retired Nonguaranteed - Public Debt for Private Purpose: $2,264,000
Retired Nonguaranteed - Public Debt for Private Purpose: $376,000
- Miscellaneous - Interest Earnings: $15,467,000
Fines and Forfeits: $15,249,000
Fines and Forfeits: $10,502,000
Interest Earnings: $10,180,000
General Revenue - Other: $8,819,000
General Revenue - Other: $7,867,000
Donations From Private Sources: $80,000
Donations From Private Sources: $56,000
- Other Capital Outlay - Toll Highways: $7,260,000
Police Protection: $2,414,000
Regular Highways: $2,234,000
Police Protection: $2,181,000
General - Other: $1,607,000
Toll Highways: $1,515,000
Health - Other: $1,362,000
Health - Other: $1,173,000
Regular Highways: $1,121,000
General - Other: $629,000
Corrections - Other: $593,000
Libraries: $254,000
Natural Resources - Other: $225,000
Local Fire Protection: $182,000
Correctional Institutions: $145,000
Parks and Recreation: $131,000
Corrections - Other: $109,000
Correctional Institutions: $88,000
General Public Building: $87,000
Solid Waste Management: $79,000
Local Fire Protection: $78,000
General Public Building: $66,000
Financial Administration: $62,000
Natural Resources - Other: $58,000
Parks and Recreation: $52,000
Judicial and Legal Services: $33,000
Libraries: $30,000
- Other Funds - Cash and Securities: $254,175,000
Cash and Securities: $196,129,000
- Sinking Funds - Cash and Securities: $191,934,000
Cash and Securities: $161,527,000
- State Intergovernmental - Other: $42,363,000
Other: $39,234,000
Highways: $6,161,000
Highways: $4,925,000
General Local Government Support: $1,665,000
General Local Government Support: $1,534,000
Public Welfare: $145,000
Public Welfare: $45,000
- Tax - Property: $316,458,000
Property: $287,983,000
General Sales and Gross Receipts: $9,210,000
General Sales and Gross Receipts: $6,858,000
Fort Bend County government finances - Cash and Securities in 2018:
- Bond Funds - Cash and Securities: $139,224,000
Cash and Securities: $80,700,000
- Charges - Toll Highways: $59,497,000
Toll Highways: $51,559,000
Other: $38,131,000
Other: $35,104,000
Regular Highways: $7,733,000
Regular Highways: $6,920,000
Natural Resources - Other: $293,000
Parks and Recreation: $213,000
Parks and Recreation: $145,000
Natural Resources - Other: $94,000
Housing and Community Development: $35,000
Housing and Community Development: $32,000
- Construction - Regular Highways: $58,760,000
Regular Highways: $46,700,000
Toll Highways: $31,042,000
Parks and Recreation: $30,665,000
Parks and Recreation: $21,700,000
Toll Highways: $20,654,000
General - Other: $19,086,000
General - Other: $19,047,000
Libraries: $11,423,000
Judicial and Legal Services: $10,204,000
Police Protection: $8,815,000
Natural Resources - Other: $2,641,000
Natural Resources - Other: $1,259,000
Central Staff Services: $125,000
Central Staff Services: $116,000
- Current Operations - Police Protection: $50,301,000
Police Protection: $45,793,000
Judicial and Legal Services: $42,793,000
Judicial and Legal Services: $38,531,000
Correctional Institutions: $35,989,000
Correctional Institutions: $33,019,000
General - Other: $30,727,000
General - Other: $27,379,000
Corrections - Other: $23,859,000
Corrections - Other: $23,275,000
Regular Highways: $21,963,000
Health - Other: $21,566,000
Financial Administration: $21,167,000
Regular Highways: $21,078,000
Financial Administration: $19,913,000
Health - Other: $18,758,000
Toll Highways: $18,184,000
Libraries: $17,299,000
Libraries: $16,250,000
Toll Highways: $15,751,000
Natural Resources - Other: $12,160,000
Natural Resources - Other: $10,076,000
Central Staff Services: $9,730,000
Central Staff Services: $8,744,000
General Public Buildings: $7,663,000
General Public Buildings: $6,943,000
Local Fire Protection: $2,980,000
Local Fire Protection: $2,835,000
Public Welfare - Other: $2,737,000
Housing and Community Development: $2,694,000
Public Welfare - Other: $2,496,000
Housing and Community Development: $2,465,000
Public Welfare, Vendor Payments for Medical Care: $2,430,000
Parks and Recreation: $2,103,000
Public Welfare, Vendor Payments for Medical Care: $2,099,000
Parks and Recreation: $1,888,000
Solid Waste Management: $393,000
Solid Waste Management: $392,000
Protective Inspection and Regulation - Other: $6,000
Protective Inspection and Regulation - Other: $4,000
- Federal Intergovernmental - Housing and Community Development: $2,712,000
Housing and Community Development: $2,640,000
Highways: $33,000
- General - Interest on Debt: $44,703,000
Interest on Debt: $41,861,000
- Long Term Debt - Beginning Outstanding - Unspecified Public Purpose: $884,766,000
Outstanding Unspecified Public Purpose: $858,649,000
Outstanding Unspecified Public Purpose: $847,145,000
Beginning Outstanding - Unspecified Public Purpose: $817,100,000
Beginning Outstanding - Public Debt for Private Purpose: $138,469,000
Outstanding Nonguaranteed - Industrial Revenue: $136,205,000
Beginning Outstanding - Public Debt for Private Purpose: $135,829,000
Outstanding Nonguaranteed - Industrial Revenue: $135,453,000
Issue, Unspecified Public Purpose: $68,359,000
Retired Unspecified Public Purpose: $37,621,000
Retired Unspecified Public Purpose: $26,810,000
Retired Nonguaranteed - Public Debt for Private Purpose: $2,264,000
Retired Nonguaranteed - Public Debt for Private Purpose: $376,000
- Miscellaneous - Interest Earnings: $15,467,000
Fines and Forfeits: $15,249,000
Fines and Forfeits: $10,502,000
Interest Earnings: $10,180,000
General Revenue - Other: $8,819,000
General Revenue - Other: $7,867,000
Donations From Private Sources: $80,000
Donations From Private Sources: $56,000
- Other Capital Outlay - Toll Highways: $7,260,000
Police Protection: $2,414,000
Regular Highways: $2,234,000
Police Protection: $2,181,000
General - Other: $1,607,000
Toll Highways: $1,515,000
Health - Other: $1,362,000
Health - Other: $1,173,000
Regular Highways: $1,121,000
General - Other: $629,000
Corrections - Other: $593,000
Libraries: $254,000
Natural Resources - Other: $225,000
Local Fire Protection: $182,000
Correctional Institutions: $145,000
Parks and Recreation: $131,000
Corrections - Other: $109,000
Correctional Institutions: $88,000
General Public Building: $87,000
Solid Waste Management: $79,000
Local Fire Protection: $78,000
General Public Building: $66,000
Financial Administration: $62,000
Natural Resources - Other: $58,000
Parks and Recreation: $52,000
Judicial and Legal Services: $33,000
Libraries: $30,000
- Other Funds - Cash and Securities: $254,175,000
Cash and Securities: $196,129,000
- Sinking Funds - Cash and Securities: $191,934,000
Cash and Securities: $161,527,000
- State Intergovernmental - Other: $42,363,000
Other: $39,234,000
Highways: $6,161,000
Highways: $4,925,000
General Local Government Support: $1,665,000
General Local Government Support: $1,534,000
Public Welfare: $145,000
Public Welfare: $45,000
- Tax - Property: $316,458,000
Property: $287,983,000
General Sales and Gross Receipts: $9,210,000
General Sales and Gross Receipts: $6,858,000
Supplemental Security Income (SSI) in 2006:
- Total number of recipients: 6,926
- Number of aged recipients: 2,296
- Number of blind and disabled recipients: 4,630
- Number of recipients under 18: 1,249
- Number of recipients between 18 and 64: 2,824
- Number of recipients older than 64: 2,853
- Number of recipients also receiving OASDI: 1,681
- Amount of payments (thousands of dollars): 2,979
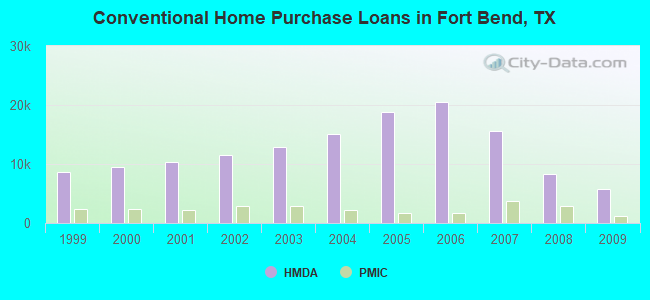
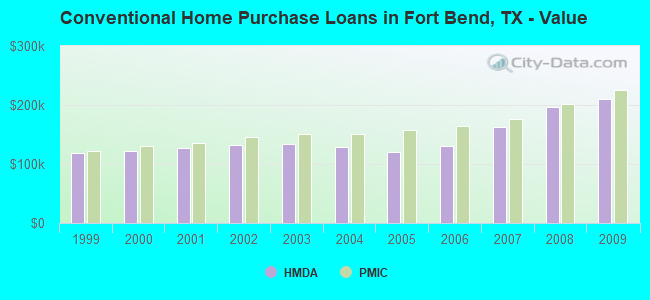
| Home Mortgage Disclosure Act Aggregated Statistics For Year 2009 (Based on 58 full tracts) | ||||||||||||||
| A) FHA, FSA/RHS & VA Home Purchase Loans | B) Conventional Home Purchase Loans | C) Refinancings | D) Home Improvement Loans | E) Loans on Dwellings For 5+ Families | F) Non-occupant Loans on < 5 Family Dwellings (A B C & D) | G) Loans On Manufactured Home Dwelling (A B C & D) | ||||||||
|---|---|---|---|---|---|---|---|---|---|---|---|---|---|---|
| Number | Average Value | Number | Average Value | Number | Average Value | Number | Average Value | Number | Average Value | Number | Average Value | Number | Average Value | |
| LOANS ORIGINATED | 3,723 | $169,304 | 5,817 | $209,538 | 9,370 | $195,694 | 494 | $63,415 | 5 | $7,727,600 | 591 | $133,398 | 36 | $93,611 |
| APPLICATIONS APPROVED, NOT ACCEPTED | 187 | $161,914 | 527 | $194,694 | 989 | $180,354 | 111 | $62,613 | 0 | $0 | 66 | $132,439 | 6 | $33,667 |
| APPLICATIONS DENIED | 653 | $158,320 | 934 | $196,425 | 3,684 | $177,722 | 775 | $39,535 | 1 | $150,000 | 282 | $112,113 | 72 | $57,194 |
| APPLICATIONS WITHDRAWN | 510 | $170,871 | 847 | $228,246 | 2,521 | $180,031 | 210 | $79,548 | 0 | $0 | 142 | $133,662 | 9 | $71,111 |
| FILES CLOSED FOR INCOMPLETENESS | 116 | $161,345 | 159 | $229,264 | 665 | $181,884 | 67 | $56,970 | 0 | $0 | 29 | $102,586 | 9 | $78,222 |
| Private Mortgage Insurance Companies Aggregated Statistics For Year 2009 (Based on 55 full tracts) | ||||||
| A) Conventional Home Purchase Loans | B) Refinancings | C) Non-occupant Loans on < 5 Family Dwellings (A & B) | ||||
|---|---|---|---|---|---|---|
| Number | Average Value | Number | Average Value | Number | Average Value | |
| LOANS ORIGINATED | 1,163 | $225,252 | 420 | $209,776 | 8 | $204,500 |
| APPLICATIONS APPROVED, NOT ACCEPTED | 307 | $225,707 | 136 | $206,846 | 12 | $109,833 |
| APPLICATIONS DENIED | 136 | $248,375 | 90 | $196,144 | 3 | $194,667 |
| APPLICATIONS WITHDRAWN | 57 | $210,719 | 48 | $230,583 | 1 | $174,000 |
| FILES CLOSED FOR INCOMPLETENESS | 29 | $205,586 | 4 | $189,750 | 7 | $131,143 |
| Most common first names in Fort Bend County, TX among deceased individuals | ||
| Name | Count | Lived (average) |
|---|---|---|
| Mary | 699 | 78.9 years |
| John | 634 | 72.5 years |
| James | 525 | 69.3 years |
| Robert | 508 | 70.7 years |
| William | 463 | 73.7 years |
| Charles | 341 | 71.6 years |
| George | 268 | 75.1 years |
| Dorothy | 260 | 76.6 years |
| Frank | 256 | 75.6 years |
| Willie | 253 | 75.2 years |
| Most common last names in Fort Bend County, TX among deceased individuals | ||
| Last name | Count | Lived (average) |
|---|---|---|
| Smith | 252 | 74.6 years |
| Williams | 250 | 72.9 years |
| Johnson | 246 | 73.6 years |
| Jones | 210 | 71.5 years |
| Davis | 193 | 73.7 years |
| Brown | 188 | 72.2 years |
| Garcia | 160 | 71.6 years |
| Jackson | 123 | 71.7 years |
| Miller | 122 | 74.8 years |
| Martinez | 121 | 66.4 years |
| Businesses in Fort Bend County, TX | ||||
| Name | Count | Name | Count | |
|---|---|---|---|---|
| 24 Hour Fitness | 2 | KFC | 7 | |
| 99 Cents Only Stores | 2 | Kincaid | 1 | |
| ALDO | 2 | Knights Inn | 1 | |
| AMF Bowling | 1 | Kohl's | 3 | |
| AT&T | 11 | Kroger | 9 | |
| Abercrombie & Fitch | 1 | LA Fitness | 3 | |
| Abercrombie Kids | 1 | La Quinta | 3 | |
| Academy Sports + Outdoors | 4 | La-Z-Boy | 1 | |
| Ace Hardware | 4 | Lane Bryant | 3 | |
| Advance Auto Parts | 5 | Lane Furniture | 7 | |
| Aeropostale | 2 | LensCrafters | 1 | |
| American Eagle Outfitters | 2 | Levi Strauss & Co. | 2 | |
| Ann Taylor | 4 | Little Caesars Pizza | 5 | |
| Apple Store | 1 | Long John Silver's | 1 | |
| Applebee's | 1 | Lowe's | 3 | |
| Arby's | 3 | Marriott | 5 | |
| Ashley Furniture | 1 | Marshalls | 2 | |
| AutoZone | 10 | Maurices | 1 | |
| Avenue | 2 | McDonald's | 24 | |
| Banana Republic | 2 | Men's Wearhouse | 1 | |
| Barnes & Noble | 1 | Motel 6 | 2 | |
| Baskin-Robbins | 4 | Motherhood Maternity | 2 | |
| Bath & Body Works | 3 | New Balance | 1 | |
| Bed Bath & Beyond | 3 | New York & Co | 2 | |
| Ben & Jerry's | 1 | Nike | 24 | |
| Best Western | 2 | Nissan | 3 | |
| Blockbuster | 5 | Office Depot | 3 | |
| Burger King | 12 | OfficeMax | 3 | |
| CVS | 14 | Old Navy | 3 | |
| Cache | 1 | Olive Garden | 1 | |
| Carl\s Jr. | 1 | Outback | 1 | |
| Catherines | 1 | Outback Steakhouse | 1 | |
| Charlotte Russe | 2 | Pac Sun | 2 | |
| Chevrolet | 3 | Panda Express | 4 | |
| Chick-Fil-A | 7 | Panera Bread | 2 | |
| Chico's | 2 | Papa John's Pizza | 5 | |
| Chipotle | 1 | Payless | 7 | |
| Chuck E. Cheese's | 2 | Penske | 3 | |
| Church's Chicken | 5 | PetSmart | 3 | |
| Cinnabon | 1 | Pier 1 Imports | 1 | |
| Clarks | 1 | Pizza Hut | 11 | |
| Coldwater Creek | 2 | Plato's Closet | 1 | |
| ColorTyme | 1 | Popeyes | 8 | |
| Comfort Inn | 2 | Pottery Barn | 1 | |
| Comfort Suites | 1 | Quiznos | 7 | |
| Cracker Barrel | 1 | RadioShack | 7 | |
| Cricket Wireless | 16 | Red Lobster | 1 | |
| Curves | 7 | Rooms To Go | 2 | |
| DHL | 11 | Rue21 | 1 | |
| Dairy Queen | 2 | Ryan's Grill | 1 | |
| Days Inn | 1 | SAS Shoes | 2 | |
| Dennys | 6 | SONIC Drive-In | 14 | |
| Discount Tire | 8 | Safeway | 5 | |
| Domino's Pizza | 5 | Sam's Club | 1 | |
| DressBarn | 3 | Sears | 2 | |
| Dressbarn | 2 | Sephora | 2 | |
| Eddie Bauer | 1 | Skechers USA | 1 | |
| Ethan Allen | 1 | Sleep Inn | 1 | |
| Express | 2 | Soma Intimates | 1 | |
| Extended Stay America | 1 | Spencer Gifts | 2 | |
| Famous Footwear | 4 | Sprint Nextel | 7 | |
| FedEx | 45 | Starbucks | 22 | |
| Finish Line | 2 | Studio 6 | 1 | |
| Firestone Complete Auto Care | 6 | Subway | 5 | |
| Foot Locker | 2 | Super 8 | 3 | |
| Forever 21 | 2 | T-Mobile | 20 | |
| Fredericks Of Hollywood | 1 | T.G.I. Driday's | 2 | |
| GNC | 13 | Taco Bell | 11 | |
| GameStop | 8 | Talbots | 1 | |
| Gap | 2 | Target | 4 | |
| Goodwill | 7 | The Cheesecake Factory | 1 | |
| Gymboree | 3 | The Room Place | 2 | |
| H&R Block | 9 | Toyota | 2 | |
| Hilton | 3 | Toys"R"Us | 2 | |
| Hobby Lobby | 4 | True Value | 2 | |
| Holiday Inn | 2 | U-Haul | 24 | |
| Hollister Co. | 1 | UPS | 41 | |
| Home Depot | 5 | Vans | 8 | |
| Honda | 2 | Verizon Wireless | 1 | |
| Hot Topic | 2 | Victoria's Secret | 2 | |
| IHOP | 3 | Vons | 5 | |
| J. Jill | 2 | Waffle House | 3 | |
| J.Crew | 1 | Walgreens | 14 | |
| JCPenney | 2 | Walmart | 5 | |
| Jack In The Box | 10 | Wendy's | 7 | |
| Jamba Juice | 1 | Wet Seal | 1 | |
| JoS. A. Bank | 3 | Whole Foods Market | 1 | |
| Jones New York | 1 | YMCA | 4 | |
| Journeys | 2 | Z Gallerie | 1 | |
| Justice | 4 | |||
Fort Bend County on our top lists:
- #4 on the list of "Top 101 counties with the lowest number of deaths per 1000 residents 2007-2013 (pop. 50,000+)"
- #13 on the list of "Top 101 counties with the largest number of children under 18 without health insurance coverage in 2000 (pop. 50,000+)"
- #17 on the list of "Top 101 counties with the lowest percentage of residents that smoked 100+ cigarettes in their lives"
- #32 on the list of "Top 101 counties with the highest percentage of residents that drank alcohol in the past 30 days"
- #41 on the list of "Top 101 counties with the lowest number of deaths per 1000 residents 2007-2013"
- #42 on the list of "Top 101 counties with the largest number of people moving in compared to moving out (pop. 50,000+)"
- #42 on the list of "Top 101 counties with the highest ground withdrawal of fresh water for public supply"
- #42 on the list of "Top 101 counties with the highest ground withdrawal of fresh water for public supply (pop. 50,000+)"
- #43 on the list of "Top 101 counties with the lowest number of infant deaths per 1000 residents 2007-2013 (pop. 50,000+)"
- #72 on the list of "Top 101 counties with the largest number of children under 18 without health insurance coverage in 2000"
- #73 on the list of "Top 101 counties with the most Other adherents (pop. 50,000+)"
- #76 on the list of "Top 101 counties with the most Other adherents"
- #83 on the list of "Top 101 counties with the lowest average weight of females"
- #85 on the list of "Top 101 counties with the highest percentage of residents that exercised in the past month"
- #99 on the list of "Top 101 counties with the best general health status score of residents (1-5), 3 years of data"