DeKalb County, Tennessee (TN)
County owner-occupied free and clear houses and condos in 2010: 2,369
County owner-occupied houses and condos in 2000: 5,235
Renter-occupied apartments: 2,109 (it was 1,749 in 2000)
| % of renters here: | 25% |
| State: | 32% |
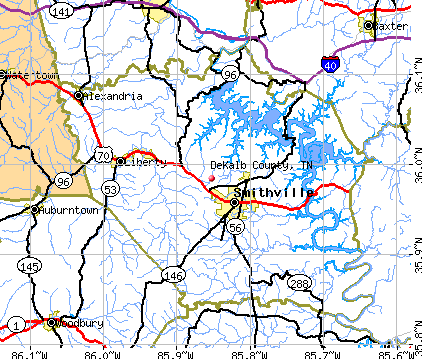
Land area: 305 sq. mi.
Water area: 24.4 sq. mi.
Population density: 68 people per square mile (average).
Industries providing employment: Manufacturing (22.6%), Educational, health and social services (17.4%), Retail trade (10.9%).
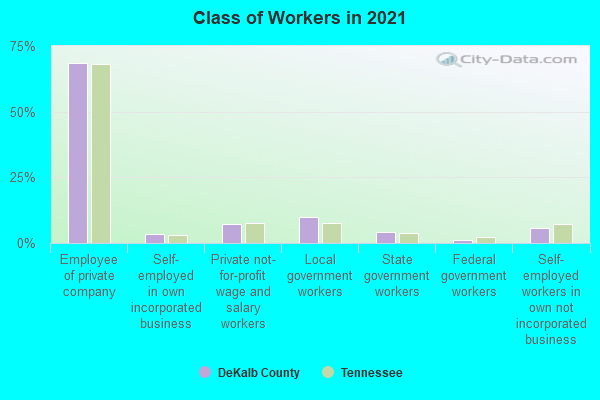
Type of workers:
- Private wage or salary: 82%
- Government: 13%
- Self-employed, not incorporated: 5%
- Unpaid family work: 0%
- OSM Map
- General Map
- Google Map
- MSN Map

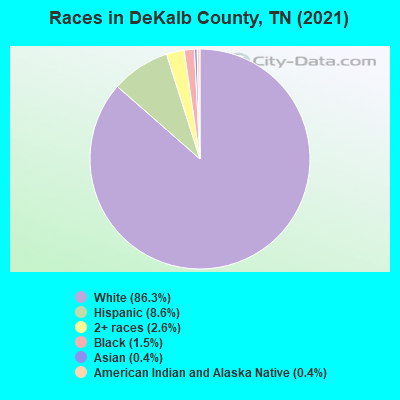
- 17,74186.0%White Non-Hispanic Alone
- 1,8208.8%Hispanic or Latino
- 5842.8%Two or more races
- 3121.5%Black Non-Hispanic Alone
- 930.5%Asian alone
- 470.2%American Indian and Alaska Native alone
- 260.1%Some other race alone
| Median resident age: | 42.4 years |
| Tennessee median age: | 39.2 years |
| Males: 10,507 | |
| Females: 10,074 |

 | Tennessee's 2020 Census results (73 replies) |
| Tennessee Urban Areas and Clusters (14 replies) |
| The case for incorporating southwestern Putnam County: What do you think? (8 replies) |
| What would happen if Center Hill Lake became a karst sink? (1 reply) |
| Large tributaries of the Caney Fork River (0 replies) |
| Visitors' Guide to Geography of Putnam County (0 replies) |
| DeKalb County: | 2.0 people |
| Tennessee: | 2 people |
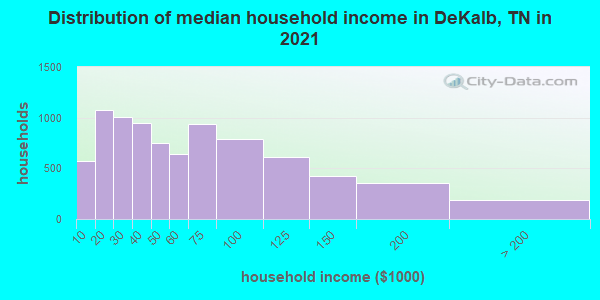
Estimated median household income in 2022: $47,799 ($30,359 in 1999)
| This county: | $47,799 |
| Tennessee: | $65,254 |
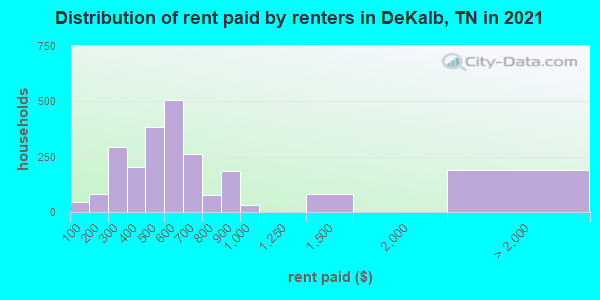
Median contract rent in 2022 for apartments: $588 (lower quartile is $455, upper quartile is $714)
| This county: | $588 |
| State: | $884 |
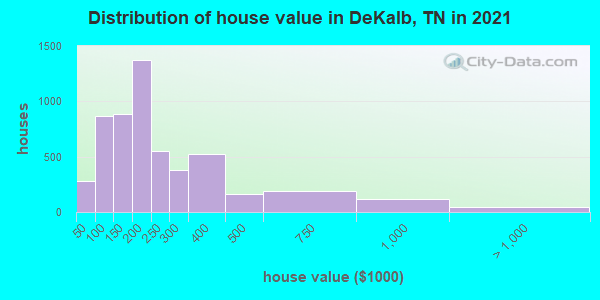
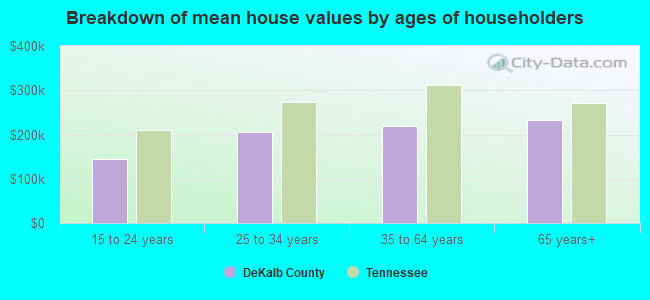
Estimated median house or condo value in 2022: $224,674 (it was $83,200 in 2000)
| DeKalb: | $224,674 |
| Tennessee: | $284,800 |
Median monthly housing costs for homes and condos with a mortgage: $1,150
Median monthly housing costs for units without a mortgage: $352
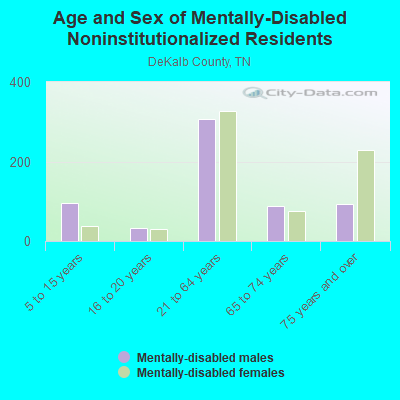
Institutionalized population: 219
Crime in 2021 (reported by the sheriff's office or county police, not the county total):
- Murders: 0
- Rapes: 2
- Robberies: 0
- Assaults: 11
- Burglaries: 29
- Thefts: 57
- Auto thefts: 17
Crime in 2020 (reported by the sheriff's office or county police, not the county total):
- Murders: 0
- Rapes: 2
- Robberies: 0
- Assaults: 11
- Burglaries: 24
- Thefts: 53
- Auto thefts: 23
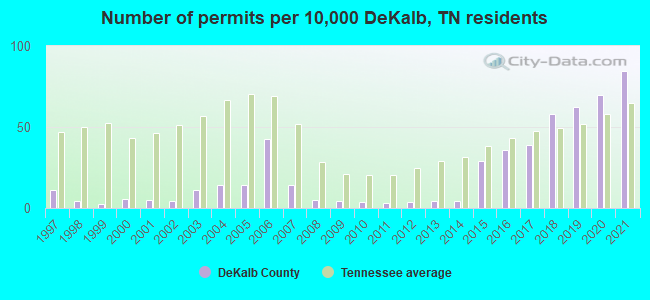
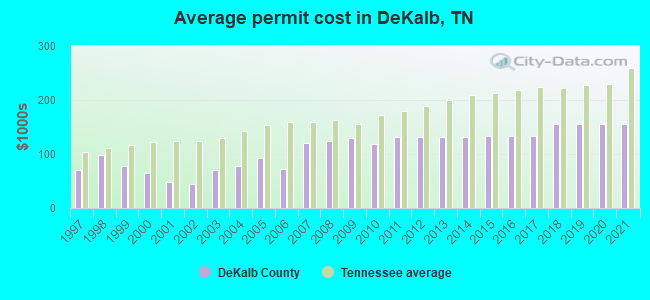
Single-family new house construction building permits:
- 2022: 146 buildings, average cost: $155,000
- 2021: 147 buildings, average cost: $155,700
- 2020: 121 buildings, average cost: $155,400
- 2019: 109 buildings, average cost: $155,100
- 2018: 101 buildings, average cost: $155,000
- 2017: 68 buildings, average cost: $132,600
- 2016: 62 buildings, average cost: $132,600
- 2015: 51 buildings, average cost: $132,600
- 2014: 7 buildings, average cost: $131,300
- 2013: 7 buildings, average cost: $131,300
- 2012: 6 buildings, average cost: $131,300
- 2011: 5 buildings, average cost: $131,300
- 2010: 6 buildings, average cost: $117,700
- 2009: 7 buildings, average cost: $130,400
- 2008: 9 buildings, average cost: $125,000
- 2007: 25 buildings, average cost: $120,600
- 2006: 74 buildings, average cost: $72,100
- 2005: 25 buildings, average cost: $93,200
- 2004: 25 buildings, average cost: $77,300
- 2003: 19 buildings, average cost: $70,400
- 2002: 8 buildings, average cost: $45,100
- 2001: 9 buildings, average cost: $47,800
- 2000: 10 buildings, average cost: $64,500
- 1999: 4 buildings, average cost: $77,500
- 1998: 7 buildings, average cost: $97,900
- 1997: 19 buildings, average cost: $70,400
Median real estate property taxes paid for housing units with mortgages in 2022: $663 (0.3%)
Median real estate property taxes paid for housing units with no mortgage in 2022: $794 (0.4%)
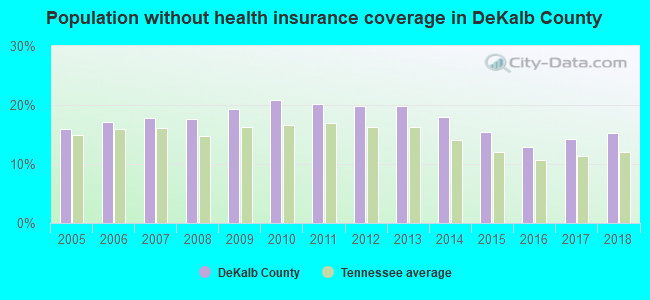
| DeKalb County: | 19.2% |
| Tennessee: | 13.3% |
Median age of residents in 2022: 42.4 years old
(Males: 39.6 years old, Females: 44.8 years old)
(Median age for: White residents: 44.6 years old, Black residents: 46.3 years old, American Indian residents: 19.9 years old, Asian residents: 24.2 years old, Hispanic or Latino residents: 33.5 years old, Other race residents: 31.6 years old)
Fair market rent in 2006 for a 1-bedroom apartment in DeKalb County is $383 a month.
Fair market rent for a 2-bedroom apartment is $460 a month.
Fair market rent for a 3-bedroom apartment is $664 a month.
Cities in this county include: Underhill, Smithville, Alexandria, Liberty, Dowelltown.
2023 air pollution in DeKalb County:
Ozone (1-hour): 0.034 ppm (standard limit: 0.12 ppm). Near U.S. average.
Neighboring counties: Bledsoe County  , Beaufort County, North Carolina
  , Caldwell County, North Carolina , Dickson County
  , Fulton County, Arkansas , Randolph County, Arkansas .
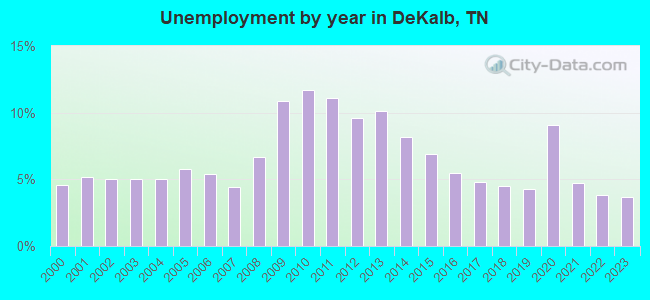
| Here: | 3.7% |
| Tennessee: | 3.0% |
Current college students: 389
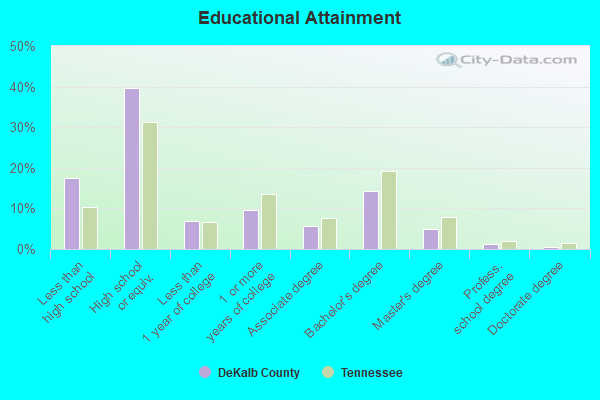
People 25 years of age or older with a high school degree or higher: 81.1%
People 25 years of age or older with a bachelor's degree or higher: 20.4%
Number of foreign born residents: 1,215 (18.5% naturalized citizens)
| DeKalb County: | 5.9% |
| Whole state: | 5.6% |
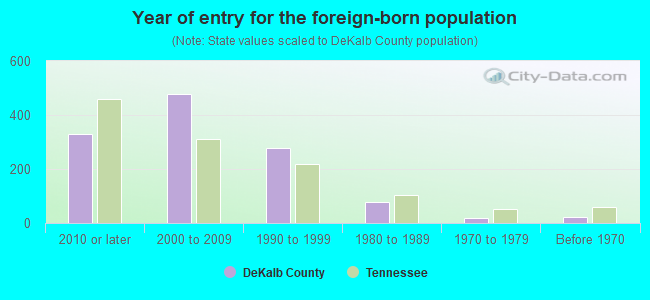
- Year of entry for the foreign-born population
- 3212010 or later
- 6012000 to 2009
- 2211990 to 1999
- 771980 to 1989
- 171970 to 1979
- 24Before 1970
Mean travel time to work (commute): minutes
Percentage of county residents living and working in this county: 99.7%
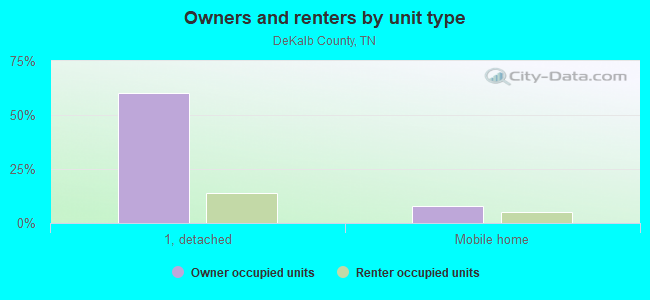
Housing units in structures:
- One, detached: 7,479
- One, attached: 169
- Two: 294
- 3 or 4: 268
- 5 to 9: 68
- 10 to 19: 165
- 50 or more: 38
- Mobile homes: 1,621
- Boats, RVs, vans, etc.: 17
Housing units in DeKalb County with a mortgage: 3,268 (267 second mortgage, 17 home equity loan, 250 both second mortgage and home equity loan)
Houses without a mortgage: 99
| Here: | 2.9% with mortgage |
| State: | 97.8% with mortgage |
Religion statistics for DeKalb County
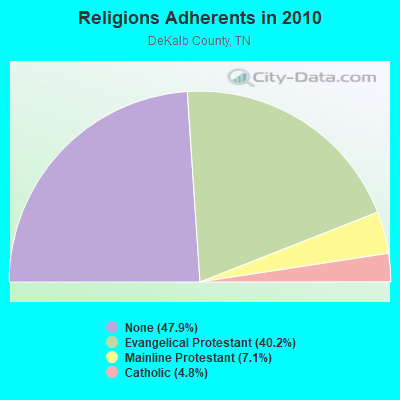
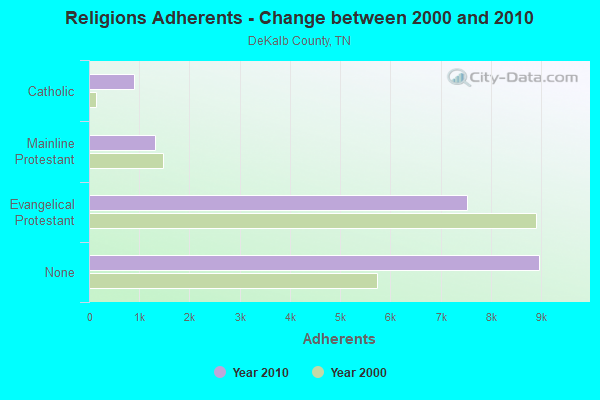
| Religion | Adherents | Congregations |
|---|---|---|
| Evangelical Protestant | 7,534 | 43 |
| Mainline Protestant | 1,320 | 21 |
| Catholic | 900 | 1 |
| Other | 1 | 1 |
| Orthodox | - | - |
| None | 8,968 | - |
Source: Clifford Grammich, Kirk Hadaway, Richard Houseal, Dale E.Jones, Alexei Krindatch, Richie Stanley and Richard H.Taylor. 2012. 2010 U.S.Religion Census: Religious Congregations & Membership Study. Association of Statisticians of American Religious Bodies. Jones, Dale E., et al. 2002. Congregations and Membership in the United States 2000. Nashville, TN: Glenmary Research Center.
Food Environment Statistics:
| DeKalb County: | 3.80 / 10,000 pop. |
| State: | 1.99 / 10,000 pop. |
| DeKalb County: | 5.43 / 10,000 pop. |
| Tennessee: | 5.16 / 10,000 pop. |
| This county: | 5.97 / 10,000 pop. |
| State: | 6.56 / 10,000 pop. |
| DeKalb County: | 11.7% |
| Tennessee: | 11.4% |
| DeKalb County: | 29.4% |
| State: | 30.2% |
| Here: | 13.9% |
| State: | 13.5% |
Agriculture in DeKalb County:
Average size of farms: 113 acresAverage value of agricultural products sold per farm: $41,879
Average value of crops sold per acre for harvested cropland: $1375.14
The value of nursery, greenhouse, floriculture, and sod as a percentage of the total market value of agricultural products sold: 79.91%
The value of livestock, poultry, and their products as a percentage of the total market value of agricultural products sold: 14.78%
Average total farm production expenses per farm: $28,448
Harvested cropland as a percentage of land in farms: 22.92%
Average market value of all machinery and equipment per farm: $29,459
The percentage of farms operated by a family or individual: 94.36%
Average age of principal farm operators: 55 years
Average number of cattle and calves per 100 acres of all land in farms: 25.22
Milk cows as a percentage of all cattle and calves: 1.64%
Corn for grain: 907 harvested acres
Soybeans for beans: 2786 harvested acres
Vegetables: 7 harvested acres
Land in orchards: 6 acres
Earthquake activity:
DeKalb County-area historical earthquake activity is significantly above Tennessee state average. It is 150% greater than the overall U.S. average.On 4/18/2008 at 09:36:59, a magnitude 5.4 (5.1 MB, 4.8 MS, 5.4 MW, 5.2 MW, Class: Moderate, Intensity: VI - VII) earthquake occurred 204.2 miles away from DeKalb County center
On 4/29/2003 at 08:59:39, a magnitude 4.9 (4.4 MB, 4.6 MW, 4.9 LG, Class: Light, Intensity: IV - V) earthquake occurred 103.8 miles away from the county center
On 7/27/1980 at 18:52:21, a magnitude 5.2 (5.1 MB, 4.7 MS, 5.0 UK, 5.2 UK) earthquake occurred 186.3 miles away from the county center
On 4/18/2008 at 09:36:59, a magnitude 5.2 (5.2 MW, Depth: 8.9 mi) earthquake occurred 204.2 miles away from the county center
On 11/30/1973 at 07:48:41, a magnitude 4.7 (4.7 MB, 4.6 ML) earthquake occurred 106.7 miles away from DeKalb County center
On 6/18/2002 at 17:37:15, a magnitude 5.0 (4.3 MB, 4.6 MW, 5.0 LG) earthquake occurred 174.8 miles away from the county center
Magnitude types: regional Lg-wave magnitude (LG), body-wave magnitude (MB), local magnitude (ML), surface-wave magnitude (MS), moment magnitude (MW)
Most recent natural disasters:
- Tennessee Covid-19 Pandemic, Incident Period: January 20, 2020, FEMA Id: 4514, Natural disaster type: Other
- Tennessee Severe Storms, Flooding, Landslides, And Mudslides, Incident Period: February 19, 2019 - March 30, 2019, FEMA Id: 4427, Natural disaster type: Storm, Mudslide, Landslide, Flood
- Tennessee Severe Winter Storm and Flooding, Incident Period: February 15, 2015 to February 23, 2015, Major Disaster (Presidential) Declared DR-4211: April 02, 2015, FEMA Id: 4211, Natural disaster type: Winter Storm, Flood
- Tennessee Severe Storms, Tornadoes, Straight-line Winds, and Flooding, Incident Period: February 29, 2012 to March 02, 2012, Major Disaster (Presidential) Declared DR-4060: March 16, 2012, FEMA Id: 4060, Natural disaster type: Storm, Tornado, Flood, Wind
- Tennessee Severe Storms, Flooding, Straight-Line Winds, and Tornadoes, Incident Period: April 30, 2010 to May 18, 2010, Major Disaster (Presidential) Declared DR-1909: May 04, 2010, FEMA Id: 1909, Natural disaster type: Storm, Tornado, Flood, Wind
- Tennessee Hurricane Katrina Evacuation, Incident Period: August 29, 2005 to October 01, 2005, Emergency Declared EM-3217: September 05, 2005, FEMA Id: 3217, Natural disaster type: Hurricane
- Tennessee Severe Storms, Tornadoes and Flooding, Incident Period: May 04, 2003 to May 30, 2003, Major Disaster (Presidential) Declared DR-1464: May 08, 2003, FEMA Id: 1464, Natural disaster type: Storm, Tornado, Flood
- Tennessee Storms and Flooding, Incident Period: January 23, 2002 to March 20, 2002, Major Disaster (Presidential) Declared DR-1408: April 05, 2002, FEMA Id: 1408, Natural disaster type: Storm, Flood
- Tennessee Winter Storm, Incident Period: December 23, 1998 to December 29, 1998, Major Disaster (Presidential) Declared DR-1260: January 15, 1999, FEMA Id: 1260, Natural disaster type: Winter Storm
- Tennessee Severe Storms and Flooding, Incident Period: January 06, 1998 to February 12, 1998, Major Disaster (Presidential) Declared DR-1197: January 13, 1998, FEMA Id: 1197, Natural disaster type: Storm, Flood
- 5 other natural disasters have been reported since 1953.
The number of natural disasters in DeKalb County (15) is near the US average (15).
Major Disasters (Presidential) Declared: 11
Emergencies Declared: 2
Causes of natural disasters: Floods: 9, Storms: 8, Tornadoes: 4, Winter Storms: 4, Winds: 2, Flash Flood: 1, Hurricane: 1, Ice Storm: 1, Landslide: 1, Mudslide: 1, Snowfall: 1, Other: 1 (Note: some incidents may be assigned to more than one category).
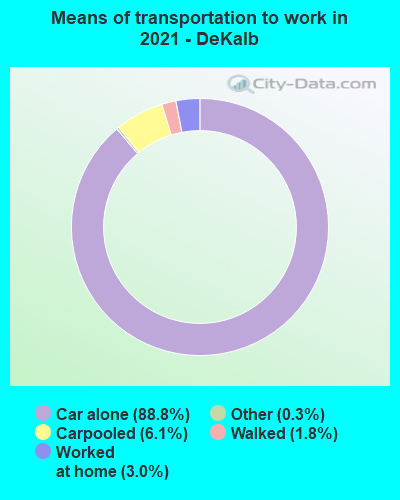
Means of transportation to work:
- Drove a car alone: 5,967 (80.3%)
- Carpooled: 614 (8.3%)
- Taxicab, motorcycle, or other means: 54 (0.7%)
- Walked: 158 (2.1%)
- Worked at home: 479 (6.4%)
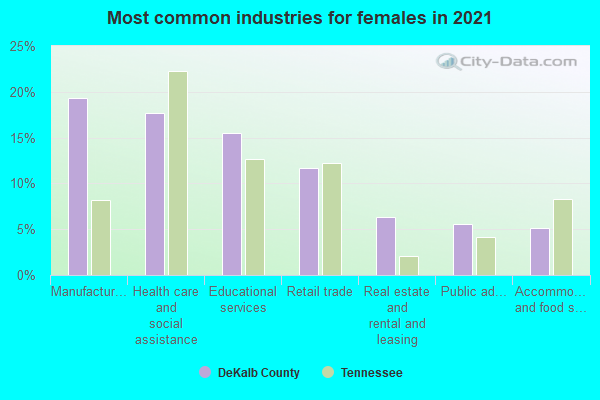
- Health care and social assistance (15%)
- Manufacturing (12%)
- Retail trade (10%)
- Educational services (8%)
- Accommodation and food services (5%)
- Public administration (4%)
- Real estate and rental and leasing (4%)
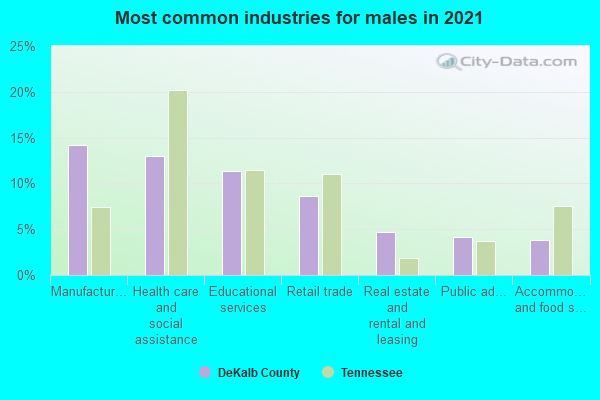
- Health care and social assistance (19%)
- Manufacturing (16%)
- Retail trade (14%)
- Educational services (10%)
- Accommodation and food services (7%)
- Public administration (5%)
- Real estate and rental and leasing (5%)
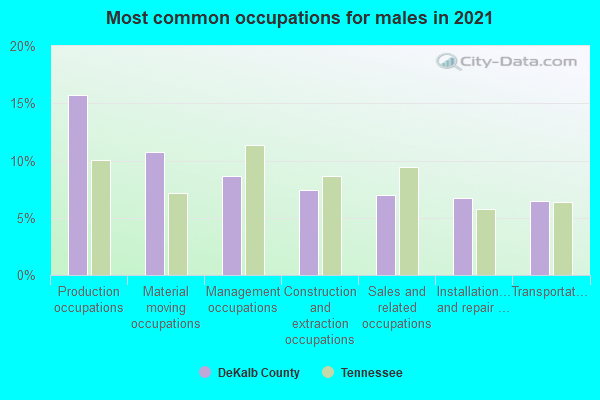
- Production occupations (16%)
- Management occupations (11%)
- Material moving occupations (8%)
- Construction and extraction occupations (8%)
- Sales and related occupations (7%)
- Installation, maintenance, and repair occupations (7%)
- Office and administrative support occupations (6%)
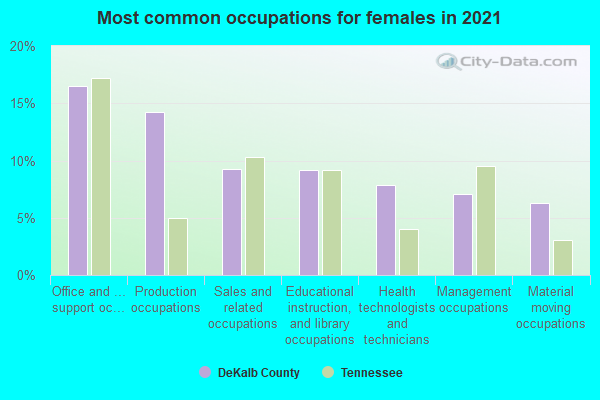
- Office and administrative support occupations (17%)
- Production occupations (13%)
- Health technologists and technicians (9%)
- Sales and related occupations (9%)
- Management occupations (8%)
- Educational instruction, and library occupations (7%)
- Material moving occupations (6%)
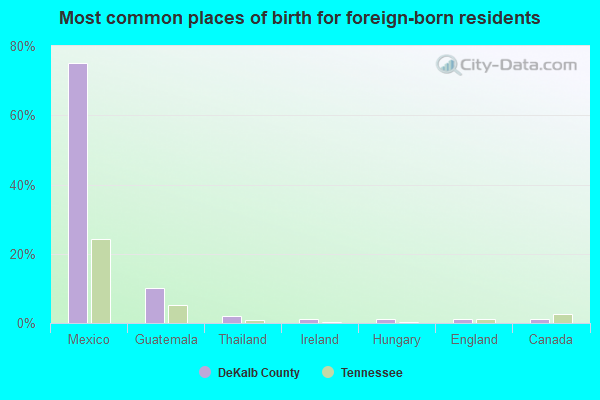
- Mexico (66%)
- Guatemala (10%)
- Thailand (4%)
- Cuba (2%)
- Peru (2%)
- England (1%)
- Ireland (1%)
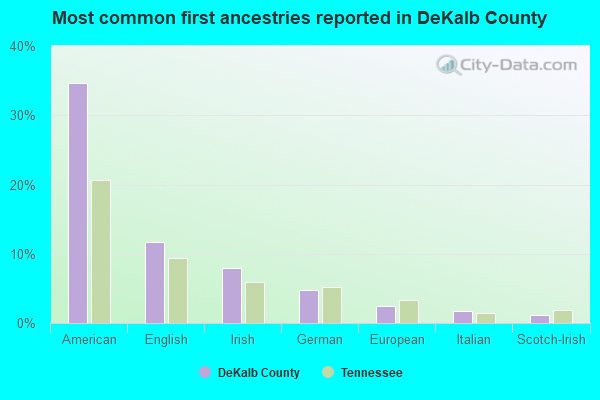
- American (39%)
- English (12%)
- Irish (7%)
- German (6%)
- European (2%)
- Scotch-Irish (2%)
- Italian (1%)
People in group quarters in DeKalb County, Tennessee in 2010:
- 111 people in nursing facilities/skilled-nursing facilities
- 84 people in local jails and other municipal confinement facilities
- 35 people in group homes intended for adults
- 23 people in college/university student housing
- 21 people in workers' group living quarters and job corps centers
- 16 people in correctional facilities intended for juveniles
- 8 people in group homes for juveniles (non-correctional)
People in group quarters in DeKalb County, Tennessee in 2000:
- 126 people in nursing homes
- 82 people in agriculture workers' dormitories on farms
- 40 people in local jails and other confinement facilities (including police lockups)
- 35 people in college dormitories (includes college quarters off campus)
- 23 people in other noninstitutional group quarters
- 9 people in other group homes
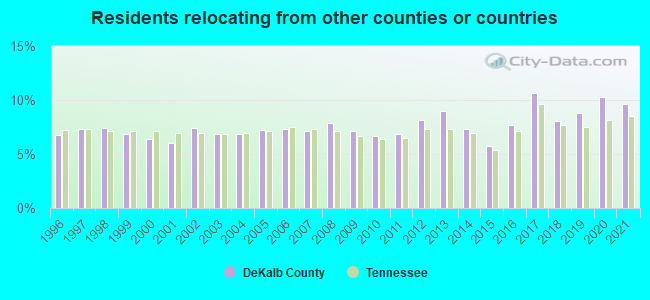
9.66% of this county's 2021 resident taxpayers lived in other counties in 2020 ($52,413 average adjusted gross income)
| Here: | 9.66% |
| Tennessee average: | 8.49% |
10 or fewer of this county's residents moved from foreign countries.
7.49% relocated from other counties in Tennessee ($39,214 average AGI)
2.16% relocated from other states ($13,199 average AGI)
DeKalb County: 2.16% Tennessee average: 4.34%
Top counties from which taxpayers relocated into this county between 2020 and 2021:
| from Wilson County, TN | |
| from Rutherford County, TN | |
| from Warren County, TN | |
| from Davidson County, TN | |
| from Putnam County, TN | |
| from Smith County, TN | |
| from Cannon County, TN |
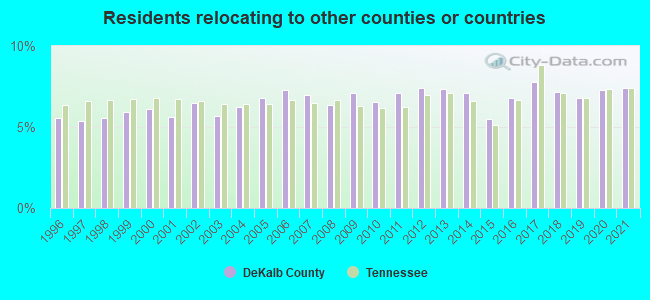
7.42% of this county's 2020 resident taxpayers moved to other counties in 2021 ($41,694 average adjusted gross income)
| Here: | 7.42% |
| Tennessee average: | 7.40% |
10 or fewer of this county's residents moved to foreign countries.
5.78% relocated to other counties in Tennessee ($33,224 average AGI)
1.63% relocated to other states ($8,470 average AGI)
DeKalb County: 1.63% Tennessee average: 3.20%
Top counties to which taxpayers relocated from this county between 2020 and 2021:
| to Warren County, TN | |
| to Wilson County, TN | |
| to Putnam County, TN | |
| to Rutherford County, TN | |
| to Smith County, TN | |
| to White County, TN | |
| to Davidson County, TN |
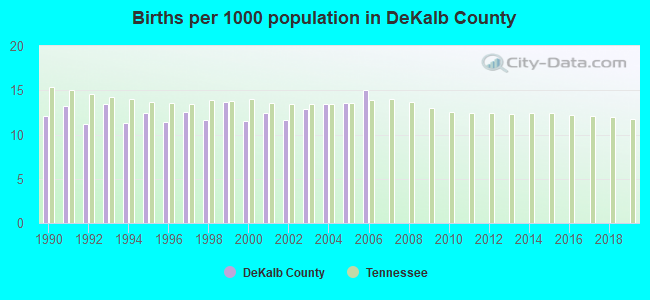
Births per 1000 population from 1990 to 1999: 12.3
Births per 1000 population from 2000 to 2006: 12.9
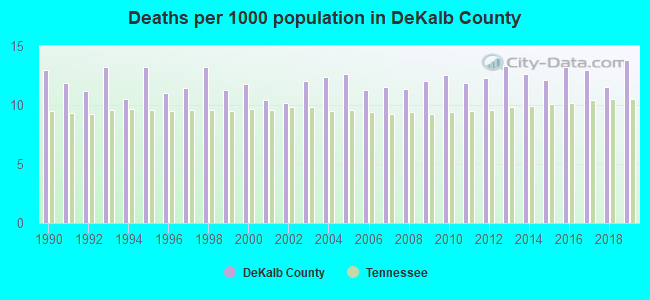
Deaths per 1000 population from 1990 to 1999: 12.0
Deaths per 1000 population from 2000 to 2009: 11.6
Deaths per 1000 population from 2010 to 2020: 12.8
Infant deaths per 1000 live births from 1990 to 1999: 9.2
Infant deaths per 1000 live births from 2000 to 2006: 6.3

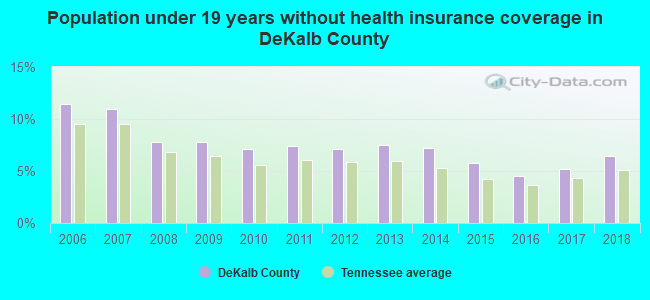
Persons under 19 years old without health insurance coverage in 2018: 6.4%
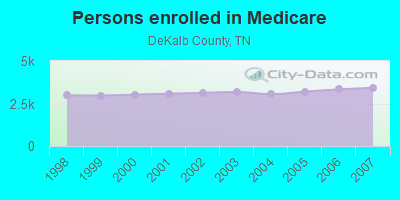
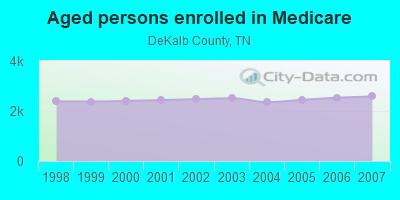
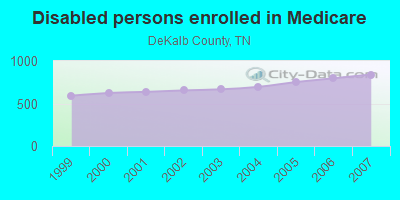
Persons enrolled in hospital insurance and/or supplemental medical insurance (Medicare) in July 1, 2007: 3,425 (2,584 aged, 841 disabled)
Children under 18 without health insurance coverage in 2007: 470 (11%)
Most common underlying causes of death in DeKalb County, Tennessee in 1999 - 2019:
- Acute myocardial infarction, unspecified (413)
- Bronchus or lung, unspecified - Malignant neoplasms (345)
- Atherosclerotic cardiovascular disease, so described (229)
- Atherosclerotic heart disease (143)
- Chronic obstructive pulmonary disease, unspecified (123)
- Alzheimer disease, unspecified (86)
- Stroke, not specified as haemorrhage or infarction (58)
- Unspecified dementia (34)
- Sudden cardiac death, so described (31)
- Chronic obstructive pulmonary disease with acute lower respiratory infection (10)
Population without health insurance coverage in 2000: 15%
Children under 18 without health insurance coverage in 2000: 11%
Short term general hospital admissions per 100,000 population in 2004: 9,515
Short term general hospital beds per 100,000 population in 2004: 280
Emergency room visits per 100,000 population in 2004: 53,550
General practice office based MDs per 100,000 population in 2005: 1,211
Medical specialist MDs per 100,000 population in 2005: 1,216
Total births per 100,000 population, July 2005 - July 2006 : 19
Total deaths per 100,000 population, July 2005 - July 2006: 49
Limited-service eating places per 100,000 population in 2005 : 16
Crimes per 100,000 population in 1996: 1
Suicides per 1,000,000 population from 2000 to 2006: 382.6. This is more than state average.
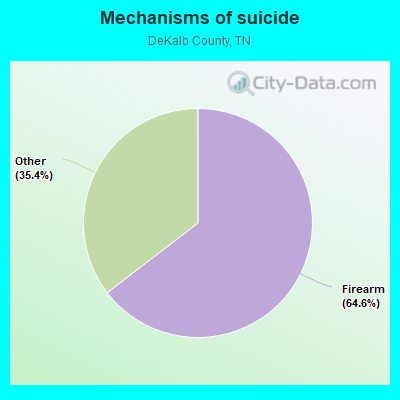
- Firearm - 247.1
- Other - 135.5
Household type by relationship:
Households: 20,581- Male householders: 3,985 (1,018 living alone), Female householders: 4,787 (1,195 living alone)
4,511 spouses (4,335 opposite-sex spouses), 729 unmarried partners, (676 opposite-sex unmarried partners), 4,356 children (3,958 natural, 264 adopted, 140 stepchildren), 801 grandchildren, 342 brothers or sisters, 78 parents, 0 foster children, 452 other relatives, 362 non-relatives
- In group quarters: 328
Size of family households: 3,048 2-persons, 1,160 3-persons, 860 4-persons, 588 5-persons, 89 6-persons, 212 7-or-more-persons.
Size of nonfamily households: 2,213 1-person, 560 2-persons, 12 3-persons, 33 4-persons, 9 5-persons.
2,441 married couples with children.
753 single-parent households (413 men, 340 women).
92.8% of residents of DeKalb speak English at home.
6.3% of residents speak Spanish at home (70% speak English very well, 15% speak English well, 12% speak English not well, 3% don't speak English at all).
0.3% of residents speak other Indo-European language at home (16% speak English very well, 84% speak English well).
0.4% of residents speak Asian or Pacific Island language at home (100% speak English very well).
0.1% of residents speak other language at home (88% speak English very well, 12% speak English not well).
In fiscal year 2004:
Federal Government expenditure: $118,464,000 ($6,504 per capita)
Department of Defense expenditure: $5,246,000
Federal direct payments to individuals for retirement and disability: $45,646,000
Federal other direct payments to individuals: $29,535,000
Federal direct payments not to individuals: $5,629,000
Federal grants: $31,185,000
Federal procurement contracts: $4,016,000 ($3,296,000 Department of Defense)
Federal salaries and wages: $2,452,000 ($65,000 Department of Defense)
Federal Government direct loans: $329,000
Federal guaranteed/insured loans: $3,031,000
Federal Government insurance: $42,510,000
Population change from April 1, 2000 to July 1, 2005:
Births: 1,155| Here: | 63 per 1000 residents |
| State: | 69 per 1000 residents |
Deaths: 1,047
| Here: | 57 per 1000 residents |
| State: | 50 per 1000 residents |
Net international migration: +226
| Here: | +12 per 1000 residents |
| State: | +8 per 1000 residents |
Net internal migration: +526
| Here: | +29 per 1000 residents |
| State: | +18 per 1000 residents |
Total withdrawal of fresh water for public supply: 1.27 millions of gallons per day (6% from ground, 94% from surface)
| Here: | 6.2 |
| State: | 6.5 |
| Here: | 4.4 |
| State: | 4.4 |
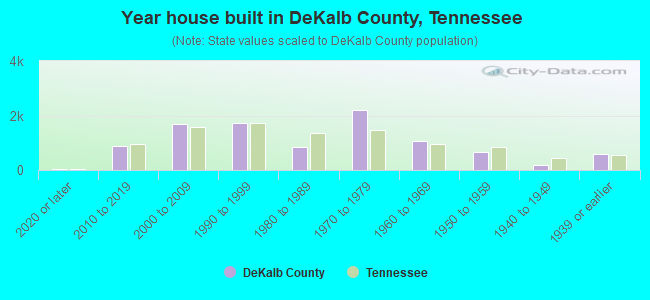
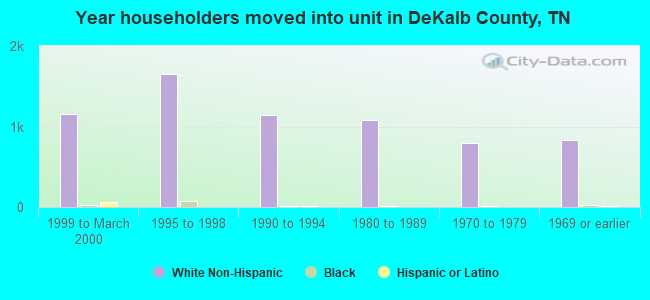
- Year house built in DeKalb County, Tennessee
- 612020 or later
- 8052010 to 2019
- 1,8772000 to 2009
- 1,5981990 to 1999
- 1,1501980 to 1989
- 2,0261970 to 1979
- 1,0431960 to 1969
- 6091950 to 1959
- 1911940 to 1949
- 5701939 or earlier
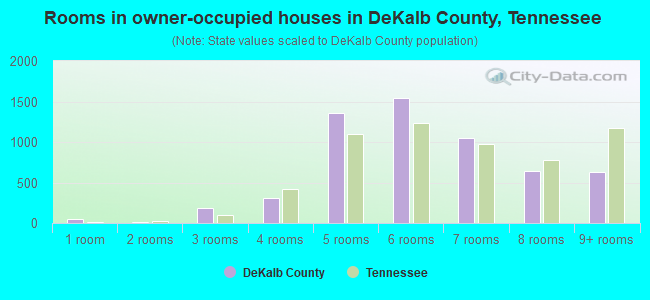
- Rooms in owner-occupied houses in DeKalb County, Tennessee
- 221 room
- 132 rooms
- 2523 rooms
- 4124 rooms
- 1,3755 rooms
- 1,3866 rooms
- 1,1217 rooms
- 7138 rooms
- 7429+ rooms
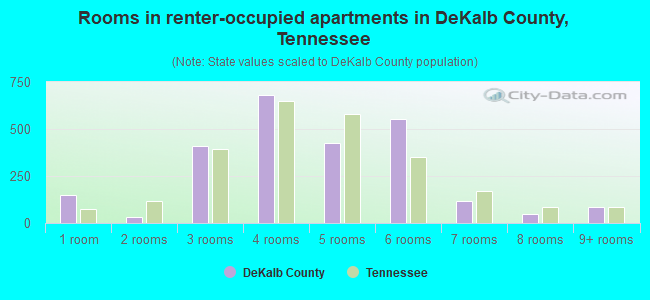
- Rooms in renter-occupied apartments in DeKalb County, Tennessee
- 2111 room
- 432 rooms
- 3553 rooms
- 8044 rooms
- 4855 rooms
- 6416 rooms
- 287 rooms
- 678 rooms
- 749+ rooms
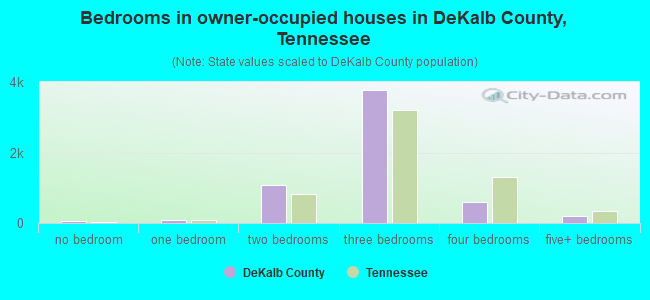
- Bedrooms in owner-occupied houses in DeKalb County, Tennessee
- 26no bedroom
- 641 bedroom
- 1,1082 bedrooms
- 3,8823 bedrooms
- 7294 bedrooms
- 2025+ bedrooms
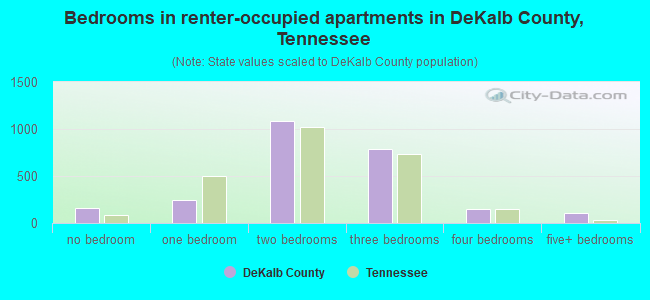
- Bedrooms in renter-occupied apartments in DeKalb County, Tennessee
- 217no bedroom
- 2141 bedroom
- 1,1652 bedrooms
- 9303 bedrooms
- 1574 bedrooms
- 435+ bedrooms
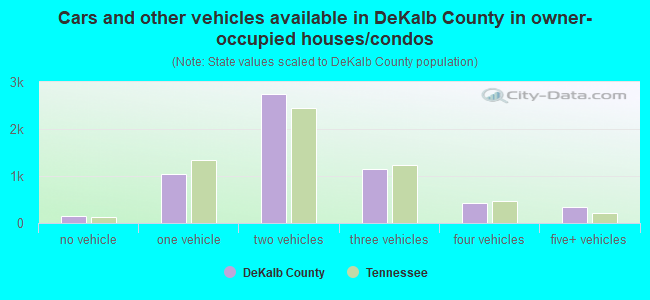
- Cars and other vehicles available in DeKalb County in owner-occupied houses/condos
- 264no vehicle
- 9701 vehicle
- 2,7312 vehicles
- 1,2993 vehicles
- 4374 vehicles
- 3485+ vehicles
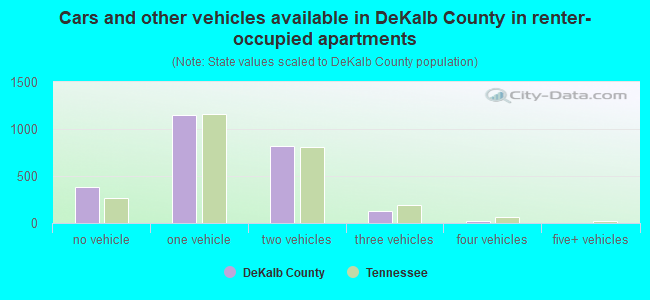
- Cars and other vehicles available in DeKalb County in renter-occupied apartments
- 464no vehicle
- 1,2731 vehicle
- 7562 vehicles
- 1813 vehicles
- 414 vehicles
- 05+ vehicles
90.9% of DeKalb County residents lived in the same house 1 years ago.
Out of people who lived in different houses, 21% lived in this county.
Out of people who lived in different counties, 83% lived in Tennessee.
| DeKalb County: | 90.9% |
| State average: | 87.0% |
Place of birth for U.S.-born residents:
- This state: 13,193
- Other state: 6,004
- Northeast: 612
- Midwest: 2,298
- South: 2,572
- West: 482
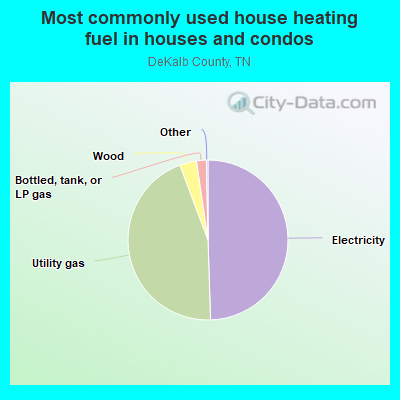
- 52.0%Electricity
- 43.2%Utility gas
- 2.5%Wood
- 2.0%Bottled, tank, or LP gas
- 0.1%Other fuel
- 0.1%No fuel used
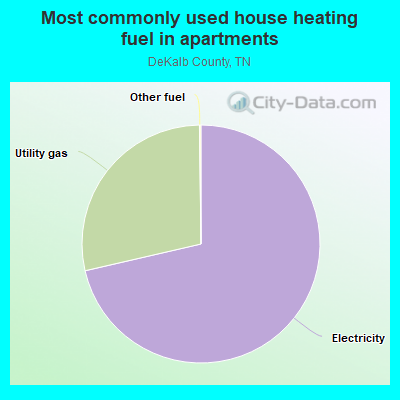
- 74.2%Electricity
- 24.9%Utility gas
- 0.8%Bottled, tank, or LP gas
- 0.2%Other fuel
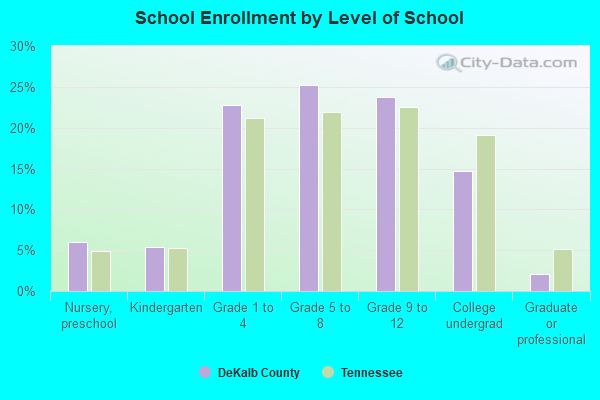
Private vs. public school enrollment:
| Here: | 4.5% |
| Tennessee: | 15.0% |
| Here: | 7.5% |
| Tennessee: | 16.2% |
| Here: | 25.3% |
| Tennessee: | 23.5% |
DeKalb County government finances - Expenditure in 2017:
- Bond Funds - Cash and Securities: $691,000
- Charges - Elementary and Secondary Education - Other: $1,832,000
Other: $1,641,000
Solid Waste Management: $144,000
Elementary and Secondary Education School Lunch: $83,000
- Construction - Elementary and Secondary Education: $49,000
Police Protection: $25,000
Health - Other: $18,000
Solid Waste Management: $12,000
- Current Operations - Elementary and Secondary Education: $23,260,000
Solid Waste Management: $1,885,000
Regular Highways: $1,760,000
Police Protection: $1,486,000
Health - Other: $1,268,000
Correctional Institutions: $1,228,000
General - Other: $900,000
Judicial and Legal Services: $742,000
Central Staff Services: $732,000
Financial Administration: $516,000
General Public Buildings: $306,000
Local Fire Protection: $167,000
Libraries: $158,000
Natural Resources - Other: $76,000
Public Welfare - Other: $24,000
- Federal Intergovernmental - Education: $181,000
Other: $47,000
- General - Interest on Debt: $228,000
- Intergovernmental to Local - Other - General - Other: $1,082,000
Other - Elementary and Secondary Education: $90,000
Other - Police Protection: $12,000
Other - Health - Other: $7,000
- Local Intergovernmental - Education: $33,000
- Long Term Debt - Beginning Outstanding - Unspecified Public Purpose: $8,292,000
Outstanding Unspecified Public Purpose: $7,383,000
Retired Unspecified Public Purpose: $909,000
- Miscellaneous - Interest Earnings: $566,000
General Revenue - Other: $522,000
Fines and Forfeits: $170,000
Rents: $106,000
Donations From Private Sources: $26,000
Sale of Property: $21,000
- Other Capital Outlay - General - Other: $1,541,000
Elementary and Secondary Education: $732,000
Police Protection: $513,000
Regular Highways: $289,000
Local Fire Protection: $19,000
Public Welfare - Other: $17,000
Libraries: $2,000
Judicial and Legal Services: $2,000
Central Staff Services: $2,000
Health - Other: $1,000
Financial Administration: $1,000
- Other Funds - Cash and Securities: $13,452,000
- Sinking Funds - Cash and Securities: $1,554,000
- State Intergovernmental - Education: $20,077,000
Highways: $1,577,000
General Local Government Support: $788,000
Other: $543,000
Public Welfare: $4,000
- Tax - Property: $6,245,000
General Sales and Gross Receipts: $2,919,000
Occupation and Business License - Other: $116,000
Other Selective Sales: $114,000
Alcoholic Beverage Sales: $82,000
Public Utility License: $26,000
Other License: $6,000
Motor Vehicle License: $4,000
- Total Salaries and Wages: $14,914,000
DeKalb County government finances - Revenue in 2017:
- Bond Funds - Cash and Securities: $691,000
- Charges - Elementary and Secondary Education - Other: $1,832,000
Other: $1,641,000
Solid Waste Management: $144,000
Elementary and Secondary Education School Lunch: $83,000
- Construction - Elementary and Secondary Education: $49,000
Police Protection: $25,000
Health - Other: $18,000
Solid Waste Management: $12,000
- Current Operations - Elementary and Secondary Education: $23,260,000
Solid Waste Management: $1,885,000
Regular Highways: $1,760,000
Police Protection: $1,486,000
Health - Other: $1,268,000
Correctional Institutions: $1,228,000
General - Other: $900,000
Judicial and Legal Services: $742,000
Central Staff Services: $732,000
Financial Administration: $516,000
General Public Buildings: $306,000
Local Fire Protection: $167,000
Libraries: $158,000
Natural Resources - Other: $76,000
Public Welfare - Other: $24,000
- Federal Intergovernmental - Education: $181,000
Other: $47,000
- General - Interest on Debt: $228,000
- Intergovernmental to Local - Other - General - Other: $1,082,000
Other - Elementary and Secondary Education: $90,000
Other - Police Protection: $12,000
Other - Health - Other: $7,000
- Local Intergovernmental - Education: $33,000
- Long Term Debt - Beginning Outstanding - Unspecified Public Purpose: $8,292,000
Outstanding Unspecified Public Purpose: $7,383,000
Retired Unspecified Public Purpose: $909,000
- Miscellaneous - Interest Earnings: $566,000
General Revenue - Other: $522,000
Fines and Forfeits: $170,000
Rents: $106,000
Donations From Private Sources: $26,000
Sale of Property: $21,000
- Other Capital Outlay - General - Other: $1,541,000
Elementary and Secondary Education: $732,000
Police Protection: $513,000
Regular Highways: $289,000
Local Fire Protection: $19,000
Public Welfare - Other: $17,000
Libraries: $2,000
Judicial and Legal Services: $2,000
Central Staff Services: $2,000
Health - Other: $1,000
Financial Administration: $1,000
- Other Funds - Cash and Securities: $13,452,000
- Sinking Funds - Cash and Securities: $1,554,000
- State Intergovernmental - Education: $20,077,000
Highways: $1,577,000
General Local Government Support: $788,000
Other: $543,000
Public Welfare: $4,000
- Tax - Property: $6,245,000
General Sales and Gross Receipts: $2,919,000
Occupation and Business License - Other: $116,000
Other Selective Sales: $114,000
Alcoholic Beverage Sales: $82,000
Public Utility License: $26,000
Other License: $6,000
Motor Vehicle License: $4,000
- Total Salaries and Wages: $14,914,000
DeKalb County government finances - Debt in 2017:
- Bond Funds - Cash and Securities: $691,000
- Charges - Elementary and Secondary Education - Other: $1,832,000
Other: $1,641,000
Solid Waste Management: $144,000
Elementary and Secondary Education School Lunch: $83,000
- Construction - Elementary and Secondary Education: $49,000
Police Protection: $25,000
Health - Other: $18,000
Solid Waste Management: $12,000
- Current Operations - Elementary and Secondary Education: $23,260,000
Solid Waste Management: $1,885,000
Regular Highways: $1,760,000
Police Protection: $1,486,000
Health - Other: $1,268,000
Correctional Institutions: $1,228,000
General - Other: $900,000
Judicial and Legal Services: $742,000
Central Staff Services: $732,000
Financial Administration: $516,000
General Public Buildings: $306,000
Local Fire Protection: $167,000
Libraries: $158,000
Natural Resources - Other: $76,000
Public Welfare - Other: $24,000
- Federal Intergovernmental - Education: $181,000
Other: $47,000
- General - Interest on Debt: $228,000
- Intergovernmental to Local - Other - General - Other: $1,082,000
Other - Elementary and Secondary Education: $90,000
Other - Police Protection: $12,000
Other - Health - Other: $7,000
- Local Intergovernmental - Education: $33,000
- Long Term Debt - Beginning Outstanding - Unspecified Public Purpose: $8,292,000
Outstanding Unspecified Public Purpose: $7,383,000
Retired Unspecified Public Purpose: $909,000
- Miscellaneous - Interest Earnings: $566,000
General Revenue - Other: $522,000
Fines and Forfeits: $170,000
Rents: $106,000
Donations From Private Sources: $26,000
Sale of Property: $21,000
- Other Capital Outlay - General - Other: $1,541,000
Elementary and Secondary Education: $732,000
Police Protection: $513,000
Regular Highways: $289,000
Local Fire Protection: $19,000
Public Welfare - Other: $17,000
Libraries: $2,000
Judicial and Legal Services: $2,000
Central Staff Services: $2,000
Health - Other: $1,000
Financial Administration: $1,000
- Other Funds - Cash and Securities: $13,452,000
- Sinking Funds - Cash and Securities: $1,554,000
- State Intergovernmental - Education: $20,077,000
Highways: $1,577,000
General Local Government Support: $788,000
Other: $543,000
Public Welfare: $4,000
- Tax - Property: $6,245,000
General Sales and Gross Receipts: $2,919,000
Occupation and Business License - Other: $116,000
Other Selective Sales: $114,000
Alcoholic Beverage Sales: $82,000
Public Utility License: $26,000
Other License: $6,000
Motor Vehicle License: $4,000
- Total Salaries and Wages: $14,914,000
DeKalb County government finances - Cash and Securities in 2017:
- Bond Funds - Cash and Securities: $691,000
- Charges - Elementary and Secondary Education - Other: $1,832,000
Other: $1,641,000
Solid Waste Management: $144,000
Elementary and Secondary Education School Lunch: $83,000
- Construction - Elementary and Secondary Education: $49,000
Police Protection: $25,000
Health - Other: $18,000
Solid Waste Management: $12,000
- Current Operations - Elementary and Secondary Education: $23,260,000
Solid Waste Management: $1,885,000
Regular Highways: $1,760,000
Police Protection: $1,486,000
Health - Other: $1,268,000
Correctional Institutions: $1,228,000
General - Other: $900,000
Judicial and Legal Services: $742,000
Central Staff Services: $732,000
Financial Administration: $516,000
General Public Buildings: $306,000
Local Fire Protection: $167,000
Libraries: $158,000
Natural Resources - Other: $76,000
Public Welfare - Other: $24,000
- Federal Intergovernmental - Education: $181,000
Other: $47,000
- General - Interest on Debt: $228,000
- Intergovernmental to Local - Other - General - Other: $1,082,000
Other - Elementary and Secondary Education: $90,000
Other - Police Protection: $12,000
Other - Health - Other: $7,000
- Local Intergovernmental - Education: $33,000
- Long Term Debt - Beginning Outstanding - Unspecified Public Purpose: $8,292,000
Outstanding Unspecified Public Purpose: $7,383,000
Retired Unspecified Public Purpose: $909,000
- Miscellaneous - Interest Earnings: $566,000
General Revenue - Other: $522,000
Fines and Forfeits: $170,000
Rents: $106,000
Donations From Private Sources: $26,000
Sale of Property: $21,000
- Other Capital Outlay - General - Other: $1,541,000
Elementary and Secondary Education: $732,000
Police Protection: $513,000
Regular Highways: $289,000
Local Fire Protection: $19,000
Public Welfare - Other: $17,000
Libraries: $2,000
Judicial and Legal Services: $2,000
Central Staff Services: $2,000
Health - Other: $1,000
Financial Administration: $1,000
- Other Funds - Cash and Securities: $13,452,000
- Sinking Funds - Cash and Securities: $1,554,000
- State Intergovernmental - Education: $20,077,000
Highways: $1,577,000
General Local Government Support: $788,000
Other: $543,000
Public Welfare: $4,000
- Tax - Property: $6,245,000
General Sales and Gross Receipts: $2,919,000
Occupation and Business License - Other: $116,000
Other Selective Sales: $114,000
Alcoholic Beverage Sales: $82,000
Public Utility License: $26,000
Other License: $6,000
Motor Vehicle License: $4,000
- Total Salaries and Wages: $14,914,000
Supplemental Security Income (SSI) in 2006:
- Total number of recipients: 610
- Number of aged recipients: 78
- Number of blind and disabled recipients: 532
- Number of recipients under 18: 53
- Number of recipients between 18 and 64: 394
- Number of recipients older than 64: 163
- Number of recipients also receiving OASDI: 279
- Amount of payments (thousands of dollars): 241
| Most common first names in DeKalb County, TN among deceased individuals | ||
| Name | Count | Lived (average) |
|---|---|---|
| James | 199 | 70.9 years |
| William | 141 | 73.9 years |
| Robert | 129 | 74.4 years |
| John | 118 | 76.4 years |
| Mary | 113 | 79.3 years |
| Willie | 98 | 78.0 years |
| George | 52 | 74.7 years |
| Charlie | 48 | 78.6 years |
| Charles | 48 | 71.8 years |
| Joe | 38 | 70.6 years |
| Most common last names in DeKalb County, TN among deceased individuals | ||
| Last name | Count | Lived (average) |
|---|---|---|
| Cantrell | 138 | 74.8 years |
| Taylor | 91 | 75.2 years |
| Hale | 85 | 73.6 years |
| Johnson | 77 | 71.5 years |
| Young | 64 | 74.4 years |
| Turner | 61 | 76.1 years |
| Malone | 59 | 77.3 years |
| Smith | 57 | 74.6 years |
| Driver | 56 | 78.1 years |
| Jones | 53 | 77.3 years |
| Businesses in DeKalb County, TN | ||||
| Name | Count | Name | Count | |
|---|---|---|---|---|
| Ace Hardware | 1 | Lane Furniture | 1 | |
| Advance Auto Parts | 1 | McDonald's | 1 | |
| Curves | 1 | Pizza Hut | 1 | |
| Dairy Queen | 1 | Rite Aid | 1 | |
| FedEx | 1 | SONIC Drive-In | 1 | |
| Ford | 1 | Subway | 1 | |
| GNC | 1 | U-Haul | 3 | |
| H&R Block | 1 | UPS | 1 | |
| Hardee's | 1 | Walmart | 1 | |
| Jimmy John's | 1 | |||