Bledsoe County, Tennessee (TN)
County owner-occupied free and clear houses and condos in 2010: 1,961
County owner-occupied houses and condos in 2000: 3,618
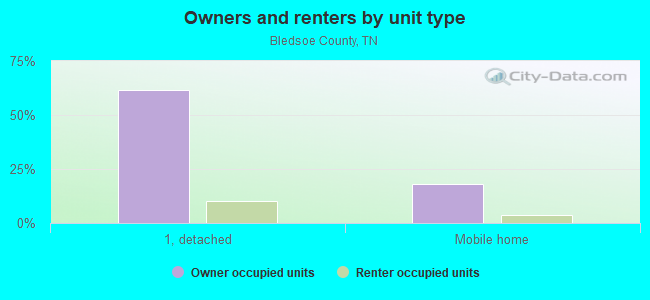
Renter-occupied apartments: 972 (it was 812 in 2000)
| % of renters here: | 18% |
| State: | 32% |
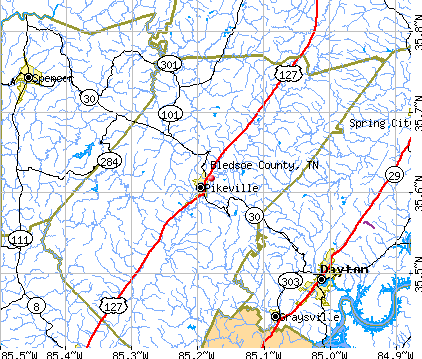
Land area: 406 sq. mi.
Water area: 0.4 sq. mi.
Population density: 37 people per square mile (low).
Industries providing employment: Manufacturing (15.5%), Professional, scientific, management, administrative, and waste management services (15.2%), Educational, health and social services (13.4%), Construction (10.4%).
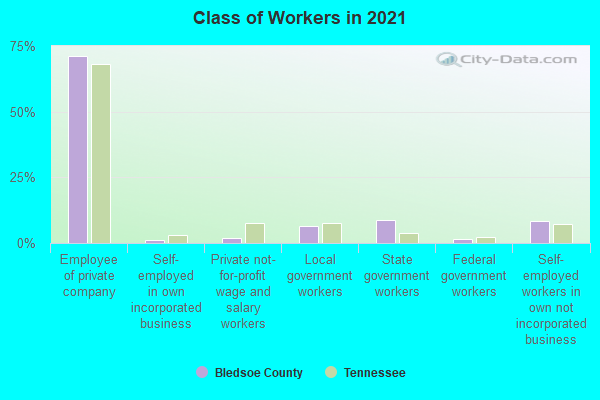
Type of workers:
- Private wage or salary: 74%
- Government: 14%
- Self-employed, not incorporated: 12%
- Unpaid family work: 0%
- OSM Map
- General Map
- Google Map
- MSN Map

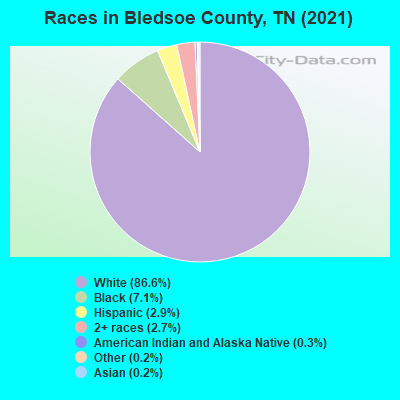
- 13,05786.4%White Non-Hispanic Alone
- 8245.5%Black Non-Hispanic Alone
- 6594.4%Two or more races
- 4803.2%Hispanic or Latino
- 350.2%American Indian and Alaska Native alone
- 310.2%Some other race alone
- 200.1%Asian alone
| Median resident age: | 44.9 years |
| Tennessee median age: | 39.2 years |
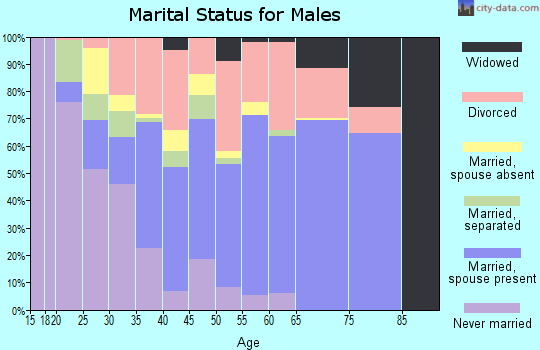
| Males: 8,901 | |
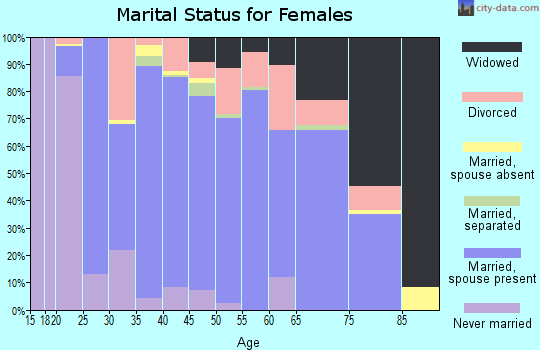
| Females: 6,187 |

 | COVID-19 in Tennessee (237 replies) |
| Lake Holiday questions (8 replies) |
| Tennessee Population Estimates 2016 (28 replies) |
| Looking for infromation on two places in Tennessee. (2 replies) |
| Top Tennessee High Schools (10 replies) |
| HWY 127 Yard Sale 2011 (31 replies) |
| Bledsoe County: | 2.0 people |
| Tennessee: | 2 people |
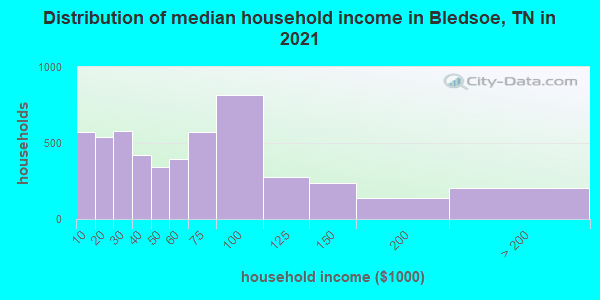
Estimated median household income in 2022: $52,768 ($28,982 in 1999)
| This county: | $52,768 |
| Tennessee: | $65,254 |
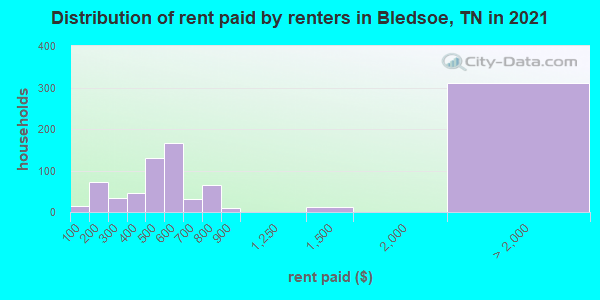
Median contract rent in 2022 for apartments: $585 (lower quartile is $437, upper quartile is $688)
| This county: | $585 |
| State: | $884 |
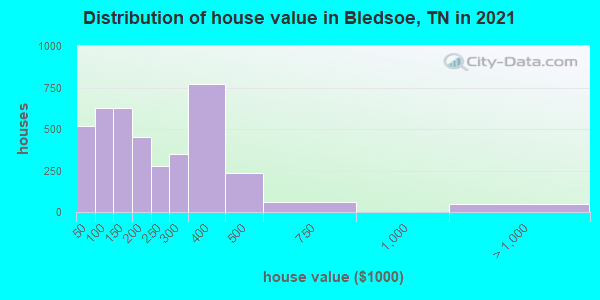
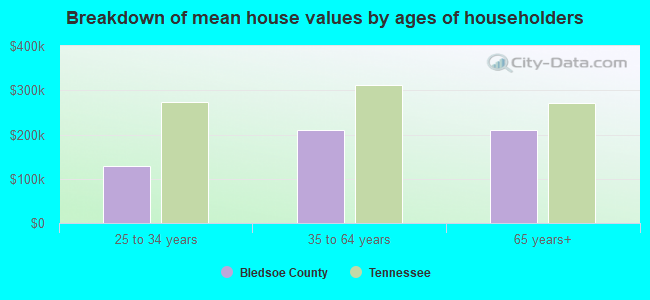
Estimated median house or condo value in 2022: $188,599 (it was $63,700 in 2000)
| Bledsoe: | $188,599 |
| Tennessee: | $284,800 |
Mean price in 2022:
Median monthly housing costs for homes and condos with a mortgage: $1,054Detached houses: $272,255
Here: $272,255 State: $374,382 Mobile homes: $75,559
Here: $75,559 State: $101,421 Occupied boats, RVs, vans, etc.: $87,580
Here: $87,580 State: $142,822
Median monthly housing costs for units without a mortgage: $330
Institutionalized population: 1,091
Crime in 2021 (reported by the sheriff's office or county police, not the county total):
- Murders: 1
- Rapes: 2
- Robberies: 0
- Assaults: 17
- Burglaries: 9
- Thefts: 48
- Auto thefts: 19
Crime in 2020 (reported by the sheriff's office or county police, not the county total):
- Murders: 0
- Rapes: 0
- Robberies: 0
- Assaults: 15
- Burglaries: 8
- Thefts: 25
- Auto thefts: 17
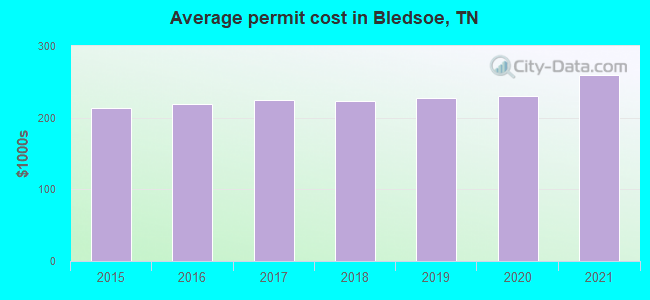
Single-family new house construction building permits:
- 2022: 0 buildings
- 2021: 0 buildings
- 2020: 0 buildings
- 2019: 0 buildings
- 2018: 0 buildings
- 2017: 0 buildings
- 2016: 0 buildings
- 2015: 0 buildings
Median real estate property taxes paid for housing units with mortgages in 2022: $834 (0.4%)
Median real estate property taxes paid for housing units with no mortgage in 2022: $583 (0.4%)
| Bledsoe County: | 24.7% |
| Tennessee: | 13.3% |
Median age of residents in 2022: 44.9 years old
(Males: 42.2 years old, Females: 48.6 years old)
(Median age for: White residents: 47.6 years old, Black residents: 29.0 years old, American Indian residents: 70.9 years old, Asian residents: 65.0 years old, Hispanic or Latino residents: 33.6 years old, Other race residents: 48.3 years old)
Fair market rent in 2006 for a 1-bedroom apartment in Bledsoe County is $377 a month.
Fair market rent for a 2-bedroom apartment is $460 a month.
Fair market rent for a 3-bedroom apartment is $604 a month.
Cities in this county include: Sequatchie Valley, Cumberland Plateau, Pikeville.
Neighboring counties: Beaufort County, North Carolina  , DeKalb County
  , Dickson County , Dare County, North Carolina , Hardeman County
  .
.
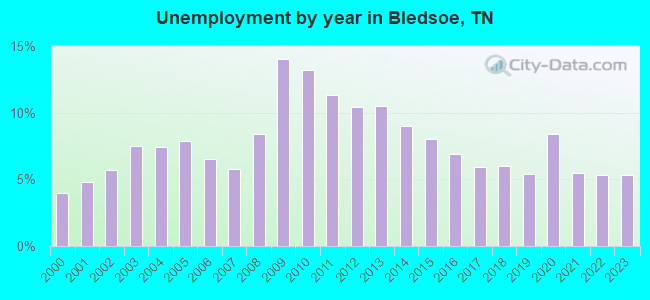
| Here: | 4.8% |
| Tennessee: | 3.0% |
Current college students: 228
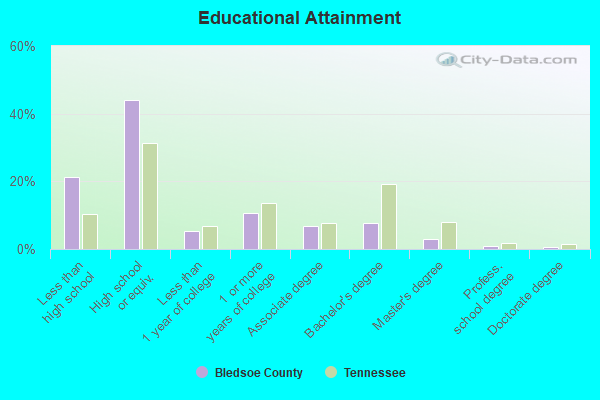
People 25 years of age or older with a high school degree or higher: 78.1%
People 25 years of age or older with a bachelor's degree or higher: 10.3%
Number of foreign born residents: 329 (34.3% naturalized citizens)
| Bledsoe County: | 2.2% |
| Whole state: | 5.6% |
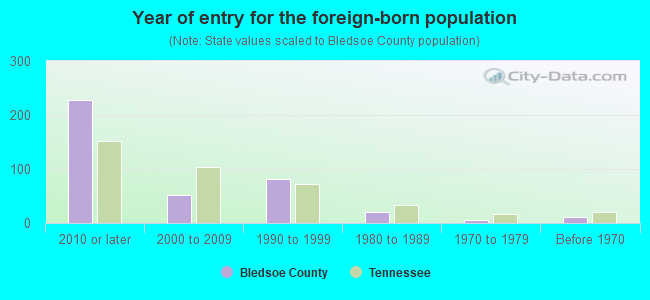
- Year of entry for the foreign-born population
- 1452010 or later
- 842000 to 2009
- 491990 to 1999
- 201980 to 1989
- 61970 to 1979
- 12Before 1970
Mean travel time to work (commute): " minutes
Percentage of county residents living and working in this county: 99.0%
Housing units in structures:
- One, detached: 4,139
- One, attached: 31
- Two: 19
- 3 or 4: 92
- 5 to 9: 95
- 10 to 19: 9
- 20 to 49: 4
- 50 or more: 4
- Mobile homes: 1,560
- Boats, RVs, vans, etc.: 18
Housing units in Bledsoe County with a mortgage: 1,580 (43 second mortgage, 0 home equity loan, 43 both second mortgage and home equity loan)
Houses without a mortgage: 27
| Here: | 3.6% with mortgage |
| State: | 97.8% with mortgage |
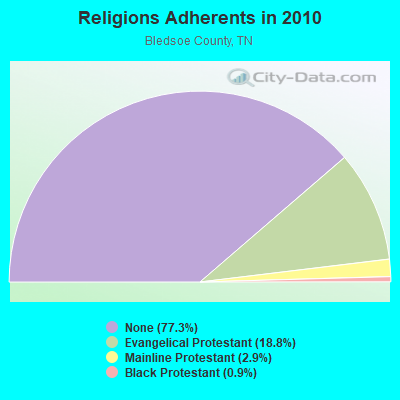
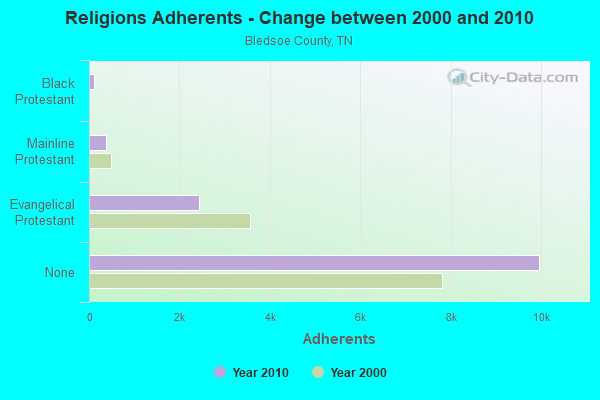
Religion statistics for Bledsoe County
| Religion | Adherents | Congregations |
|---|---|---|
| Evangelical Protestant | 2,424 | 26 |
| Mainline Protestant | 376 | 3 |
| Black Protestant | 119 | 1 |
| Other | 2 | 1 |
| None | 9,955 | - |
Source: Clifford Grammich, Kirk Hadaway, Richard Houseal, Dale E.Jones, Alexei Krindatch, Richie Stanley and Richard H.Taylor. 2012. 2010 U.S.Religion Census: Religious Congregations & Membership Study. Association of Statisticians of American Religious Bodies. Jones, Dale E., et al. 2002. Congregations and Membership in the United States 2000. Nashville, TN: Glenmary Research Center.
Food Environment Statistics:
| Bledsoe County: | 2.30 / 10,000 pop. |
| State: | 1.99 / 10,000 pop. |
| Bledsoe County: | 1.53 / 10,000 pop. |
| Tennessee: | 5.16 / 10,000 pop. |
| This county: | 2.30 / 10,000 pop. |
| State: | 6.56 / 10,000 pop. |
| Bledsoe County: | 11.4% |
| Tennessee: | 11.4% |
| Bledsoe County: | 32.3% |
| State: | 30.2% |
| Here: | 14.3% |
| State: | 13.5% |
Agriculture in Bledsoe County:
Average size of farms: 166 acresAverage value of agricultural products sold per farm: $45,797
Average value of crops sold per acre for harvested cropland: $275.94
The value of nursery, greenhouse, floriculture, and sod as a percentage of the total market value of agricultural products sold: 2.20%
The value of livestock, poultry, and their products as a percentage of the total market value of agricultural products sold: 74.30%
Average total farm production expenses per farm: $35,391
Harvested cropland as a percentage of land in farms: 25.74%
Irrigated harvested cropland as a percentage of land in farms: 2.53%
Average market value of all machinery and equipment per farm: $59,905
The percentage of farms operated by a family or individual: 92.86%
Average age of principal farm operators: 54 years
Average number of cattle and calves per 100 acres of all land in farms: 33.11
Milk cows as a percentage of all cattle and calves: 2.55%
Corn for grain: 1152 harvested acres
All wheat for grain: 140 harvested acres
Soybeans for beans: 217 harvested acres
Vegetables: 1,245 harvested acres
Land in orchards: 128 acres
Earthquake activity:
Bledsoe County-area historical earthquake activity is significantly above Tennessee state average. It is 121% greater than the overall U.S. average.On 4/29/2003 at 08:59:39, a magnitude 4.9 (4.4 MB, 4.6 MW, 4.9 LG, Class: Light, Intensity: IV - V) earthquake occurred 81.7 miles away from Bledsoe County center
On 11/30/1973 at 07:48:41, a magnitude 4.7 (4.7 MB, 4.6 ML) earthquake occurred 69.6 miles away from the county center
On 7/27/1980 at 18:52:21, a magnitude 5.2 (5.1 MB, 4.7 MS, 5.0 UK, 5.2 UK, Class: Moderate, Intensity: VI - VII) earthquake occurred 191.6 miles away from the county center
On 12/12/2018 at 09:14:43, a magnitude 4.4 (4.4 MW, Depth: 4.9 mi) earthquake occurred 25.2 miles away from the county center
On 4/29/2003 at 08:59:39, a magnitude 4.6 (4.6 MW, Depth: 12.3 mi) earthquake occurred 81.7 miles away from Bledsoe County center
On 4/18/2008 at 09:36:59, a magnitude 5.4 (5.1 MB, 4.8 MS, 5.4 MW, 5.2 MW) earthquake occurred 246.5 miles away from the county center
Magnitude types: regional Lg-wave magnitude (LG), body-wave magnitude (MB), local magnitude (ML), surface-wave magnitude (MS), moment magnitude (MW)
Most recent natural disasters:
- Tennessee Covid-19 Pandemic, Incident Period: January 20, 2020, FEMA Id: 4514, Natural disaster type: Other
- Tennessee Severe Storms, Flooding, Landslides, And Mudslides, Incident Period: February 19, 2019 - March 30, 2019, FEMA Id: 4427, Natural disaster type: Storm, Mudslide, Landslide, Flood
- Tennessee Severe Winter Storm and Flooding, Incident Period: February 15, 2015 to February 23, 2015, Major Disaster (Presidential) Declared DR-4211: April 02, 2015, FEMA Id: 4211, Natural disaster type: Winter Storm, Flood
- Tennessee Severe Storms, Tornadoes, Straight-line Winds, and Flooding, Incident Period: June 05, 2014 to June 10, 2014, Major Disaster (Presidential) Declared DR-4189: August 13, 2014, FEMA Id: 4189, Natural disaster type: Storm, Tornado, Flood, Wind
- Tennessee Severe Storms, Tornadoes, Straight-line Winds, and Associated Flooding, Incident Period: April 25, 2011 to April 28, 2011, Major Disaster (Presidential) Declared DR-1974: May 01, 2011, FEMA Id: 1974, Natural disaster type: Storm, Tornado, Flood, Wind
- Tennessee Hurricane Katrina Evacuation, Incident Period: August 29, 2005 to October 01, 2005, Emergency Declared EM-3217: September 05, 2005, FEMA Id: 3217, Natural disaster type: Hurricane
- Tennessee Severe Storms, Tornadoes and Flooding, Incident Period: May 04, 2003 to May 30, 2003, Major Disaster (Presidential) Declared DR-1464: May 08, 2003, FEMA Id: 1464, Natural disaster type: Storm, Tornado, Flood
- Tennessee Severe Storms and Flooding, Incident Period: February 14, 2003 to February 26, 2003, Major Disaster (Presidential) Declared DR-1456: March 20, 2003, FEMA Id: 1456, Natural disaster type: Storm, Flood
- Tennessee Severe Storms, Tornadoes and Flooding, Incident Period: November 09, 2002 to November 12, 2002, Major Disaster (Presidential) Declared DR-1441: November 13, 2002, FEMA Id: 1441, Natural disaster type: Storm, Tornado, Flood
- Tennessee Storms and Flooding, Incident Period: January 23, 2002 to March 20, 2002, Major Disaster (Presidential) Declared DR-1408: April 05, 2002, FEMA Id: 1408, Natural disaster type: Storm, Flood
- 8 other natural disasters have been reported since 1953.
The number of natural disasters in Bledsoe County (18) is near the US average (15).
Major Disasters (Presidential) Declared: 13
Emergencies Declared: 2
Causes of natural disasters: Floods: 12, Storms: 10, Tornadoes: 4, Winter Storms: 4, Winds: 2, Fire: 1, Flash Flood: 1, Heavy Rain: 1, Hurricane: 1, Ice Storm: 1, Landslide: 1, Mudslide: 1, Snowfall: 1, Other: 1 (Note: some incidents may be assigned to more than one category).
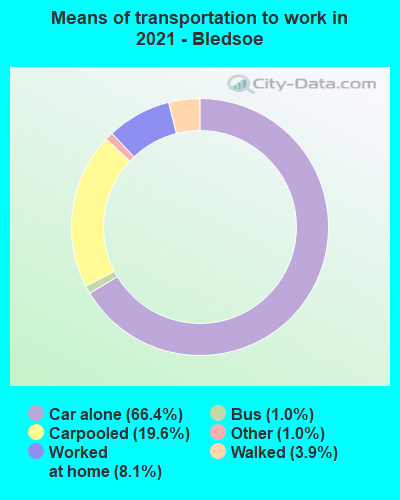
Means of transportation to work:
- Drove a car alone: 2,223 (65.0%)
- Carpooled: 638 (18.7%)
- Bus: 18 (0.5%)
- Walked: 127 (3.7%)
- Worked at home: 411 (12.0%)
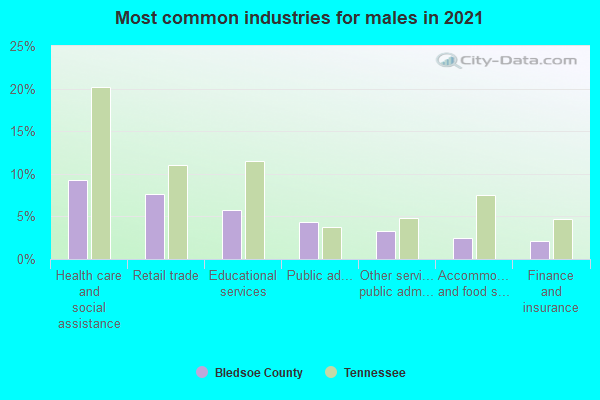
- Health care and social assistance (11%)
- Retail trade (6%)
- Educational services (5%)
- Other services, except public administration (4%)
- Public administration (3%)
- Finance and insurance (3%)
- Accommodation and food services (3%)
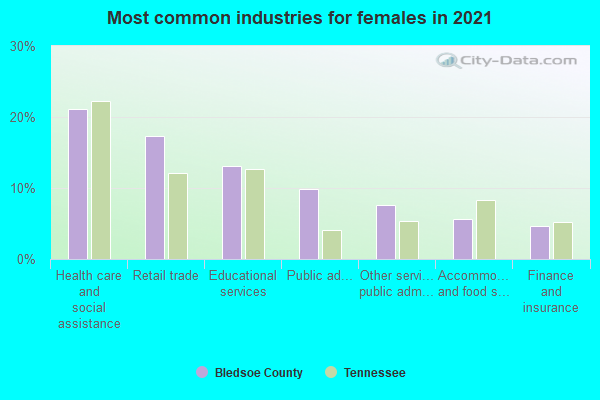
- Health care and social assistance (23%)
- Retail trade (12%)
- Educational services (11%)
- Other services, except public administration (9%)
- Public administration (7%)
- Finance and insurance (7%)
- Accommodation and food services (6%)
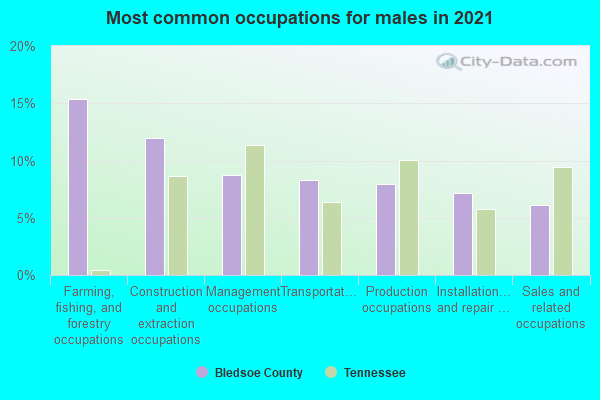
- Construction and extraction occupations (11%)
- Farming, fishing, and forestry occupations (11%)
- Management occupations (11%)
- Production occupations (11%)
- Installation, maintenance, and repair occupations (9%)
- Sales and related occupations (9%)
- Transportation occupations (7%)
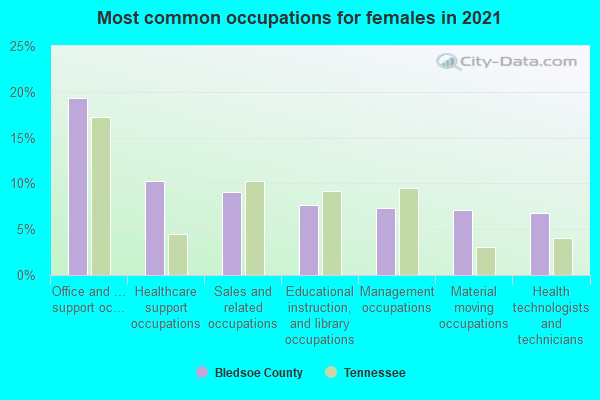
- Office and administrative support occupations (20%)
- Educational instruction, and library occupations (9%)
- Management occupations (8%)
- Sales and related occupations (7%)
- Healthcare support occupations (7%)
- Health technologists and technicians (6%)
- Food preparation and serving related occupations (6%)
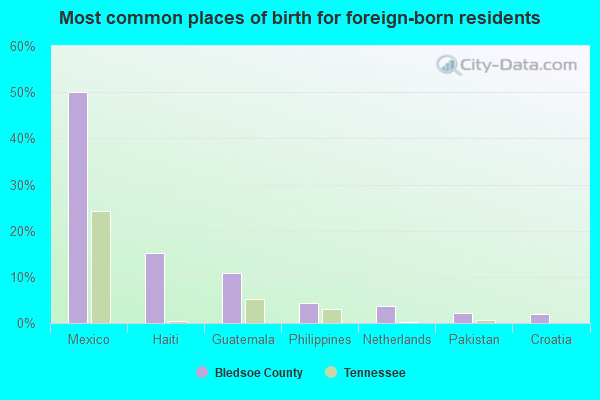
- Mexico (52%)
- Netherlands (12%)
- Guatemala (12%)
- Pakistan (5%)
- Philippines (4%)
- Greece (4%)
- Brazil (2%)
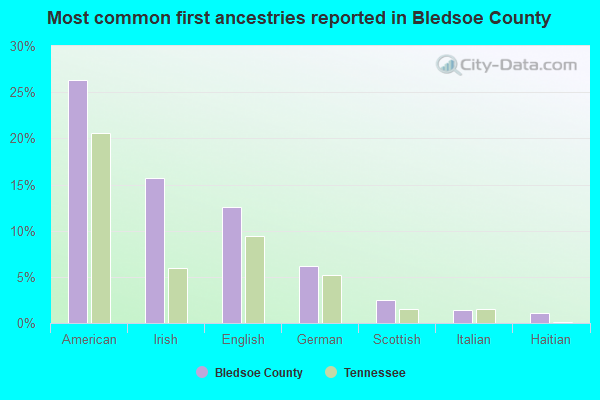
- American (32%)
- Irish (13%)
- English (11%)
- German (6%)
- Italian (3%)
- Scotch-Irish (2%)
- Scottish (2%)
People in group quarters in Bledsoe County, Tennessee in 2010:
- 931 people in state prisons
- 97 people in correctional facilities intended for juveniles
- 46 people in nursing facilities/skilled-nursing facilities
- 17 people in local jails and other municipal confinement facilities
- 10 people in residential treatment centers for adults
People in group quarters in Bledsoe County, Tennessee in 2000:
- 969 people in state prisons
- 141 people in training schools for juvenile delinquents
- 43 people in nursing homes
- 9 people in homes for the mentally ill
- 6 people in local jails and other confinement facilities (including police lockups)
- 5 people in other noninstitutional group quarters
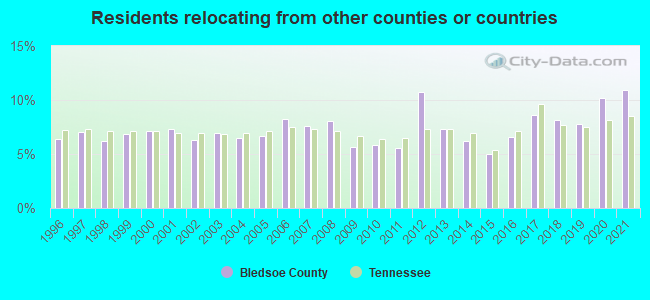
10.92% of this county's 2021 resident taxpayers lived in other counties in 2020 ($29,682 average adjusted gross income)
| Here: | 10.92% |
| Tennessee average: | 8.49% |
10 or fewer of this county's residents moved from foreign countries.
8.80% relocated from other counties in Tennessee ($21,199 average AGI)
2.12% relocated from other states ($8,481 average AGI)
Bledsoe County: 2.12% Tennessee average: 4.34%
Top counties from which taxpayers relocated into this county between 2020 and 2021:
| from Hamilton County, TN | |
| from Rhea County, TN | |
| from Cumberland County, TN | |
| from Sequatchie County, TN | |
| from Davidson County, TN |
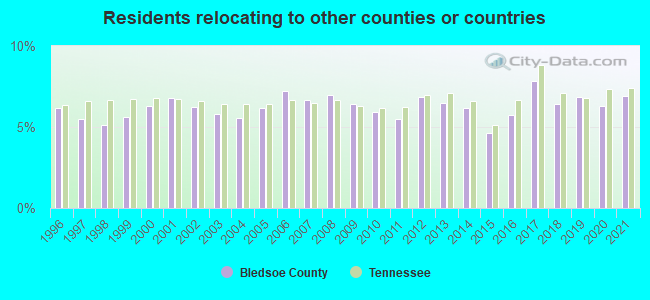
6.92% of this county's 2020 resident taxpayers moved to other counties in 2021 ($36,569 average adjusted gross income)
| Here: | 6.92% |
| Tennessee average: | 7.40% |
10 or fewer of this county's residents moved to foreign countries.
5.85% relocated to other counties in Tennessee ($29,634 average AGI)
1.07% relocated to other states ($6,934 average AGI)
Bledsoe County: 1.07% Tennessee average: 3.20%
Top counties to which taxpayers relocated from this county between 2020 and 2021:
| to Hamilton County, TN | |
| to Rhea County, TN | |
| to Sequatchie County, TN | |
| to Cumberland County, TN |
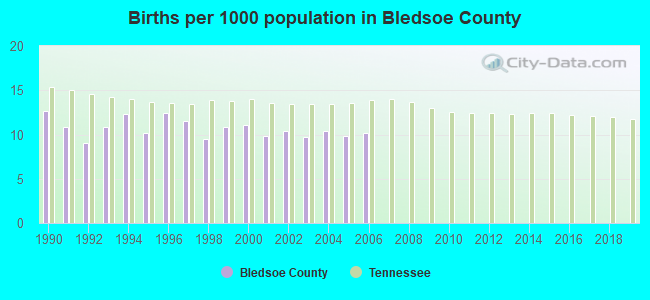
Births per 1000 population from 1990 to 1999: 11.0
Births per 1000 population from 2000 to 2006: 10.2
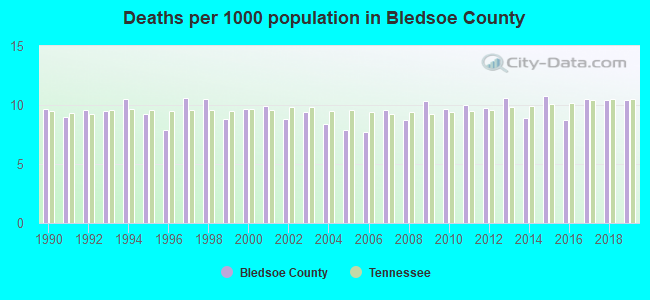
Deaths per 1000 population from 1990 to 1999: 9.5
Deaths per 1000 population from 2000 to 2009: 9.0
Deaths per 1000 population from 2010 to 2020: 10.1
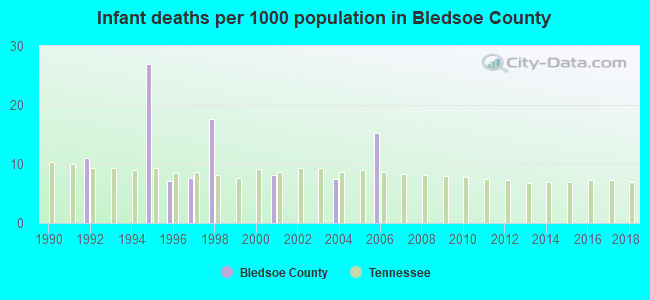
Infant deaths per 1000 live births from 1990 to 1999: 7.1
Infant deaths per 1000 live births from 2000 to 2006: 4.4
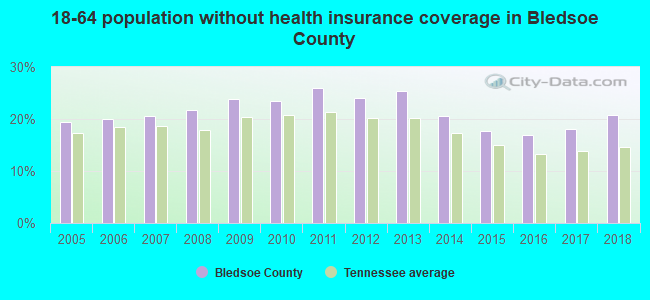
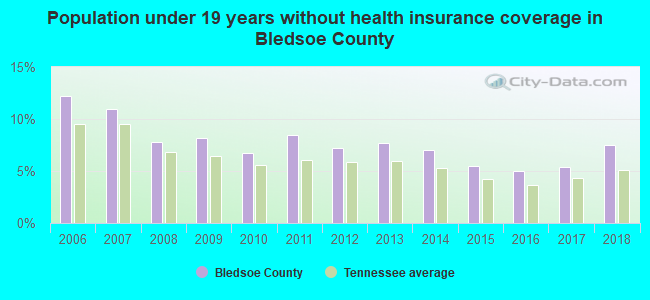
Persons under 19 years old without health insurance coverage in 2018: 7.5%
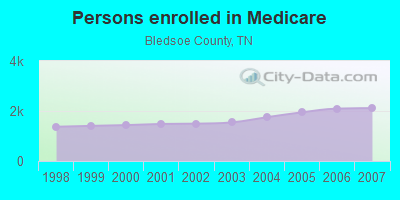
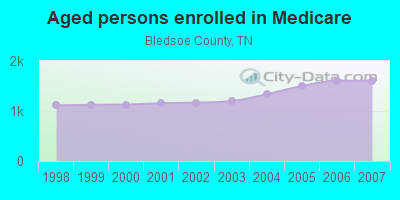
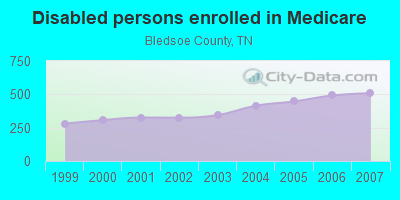
Persons enrolled in hospital insurance and/or supplemental medical insurance (Medicare) in July 1, 2007: 2,114 (1,605 aged, 509 disabled)
Children under 18 without health insurance coverage in 2007: 371 (14%)
Most common underlying causes of death in Bledsoe County, Tennessee in 1999 - 2019:
- Atherosclerotic heart disease (181)
- Acute myocardial infarction, unspecified (161)
- Bronchus or lung, unspecified - Malignant neoplasms (115)
- Chronic obstructive pulmonary disease, unspecified (54)
- Alzheimer disease, unspecified (10)
- Stroke, not specified as haemorrhage or infarction (10)
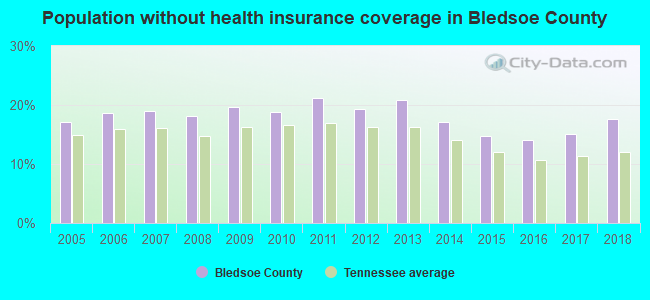
Population without health insurance coverage in 2000: 17%
Children under 18 without health insurance coverage in 2000: 12%
Short term general hospital admissions per 100,000 population in 2004: 3,027
Short term general hospital beds per 100,000 population in 2004: 219
Emergency room visits per 100,000 population in 2004: 45,905
General practice office based MDs per 100,000 population in 2005: 959
Medical specialist MDs per 100,000 population in 2005: 804
Total births per 100,000 population, July 2005 - July 2006 : 9
Total deaths per 100,000 population, July 2005 - July 2006: 15
Crimes per 100,000 population in 1996: 1
Household type by relationship:
Households: 15,088- Male householders: 2,938 (536 living alone), Female householders: 2,143 (523 living alone)
2,892 spouses (2,892 opposite-sex spouses), 333 unmarried partners, (326 opposite-sex unmarried partners), 3,155 children (2,721 natural, 178 adopted, 251 stepchildren), 761 grandchildren, 170 brothers or sisters, 259 parents, 0 foster children, 289 other relatives, 809 non-relatives
- In group quarters: 1,131
Size of family households: 1,895 2-persons, 721 3-persons, 364 4-persons, 279 5-persons, 294 6-persons, 149 7-or-more-persons.
Size of nonfamily households: 1,058 1-person, 207 2-persons, 113 3-persons.
1,327 married couples with children.
530 single-parent households (48 men, 482 women).
96.9% of residents of Bledsoe speak English at home.
1.8% of residents speak Spanish at home (44% speak English very well, 24% speak English well, 16% speak English not well, 16% don't speak English at all).
1.0% of residents speak other Indo-European language at home (70% speak English very well, 30% speak English well).
0.1% of residents speak Asian or Pacific Island language at home (100% speak English very well).
0.1% of residents speak other language at home (100% speak English very well).
In fiscal year 2004:
Federal Government expenditure: $63,371,000 ($4,957 per capita)
Department of Defense expenditure: $933,000
Federal direct payments to individuals for retirement and disability: $23,139,000
Federal other direct payments to individuals: $16,326,000
Federal direct payments not to individuals: $275,000
Federal grants: $22,278,000
Federal procurement contracts: $248,000 ($0,000 Department of Defense)
Federal salaries and wages: $1,104,000 ($0,000 Department of Defense)
Federal Government direct loans: $291,000
Federal guaranteed/insured loans: $637,000
Federal Government insurance: $1,584,000
Population change from April 1, 2000 to July 1, 2005:
Births: 662| Here: | 51 per 1000 residents |
| State: | 69 per 1000 residents |
Deaths: 612
| Here: | 47 per 1000 residents |
| State: | 50 per 1000 residents |
Net international migration: +10
| Here: | +1 per 1000 residents |
| State: | +8 per 1000 residents |
Net internal migration: +529
| Here: | +41 per 1000 residents |
| State: | +18 per 1000 residents |
Total withdrawal of fresh water for public supply: 1.03 millions of gallons per day (38% from ground, 62% from surface)
| Here: | 5.9 |
| State: | 6.5 |
| Here: | 4.9 |
| State: | 4.4 |
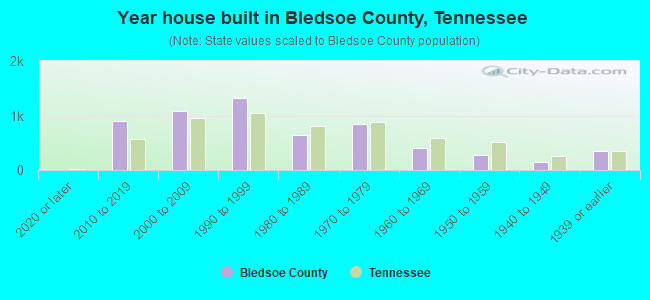
- Year house built in Bledsoe County, Tennessee
- 602020 or later
- 7792010 to 2019
- 1,3272000 to 2009
- 1,2991990 to 1999
- 6291980 to 1989
- 7821970 to 1979
- 4231960 to 1969
- 1861950 to 1959
- 1591940 to 1949
- 2771939 or earlier
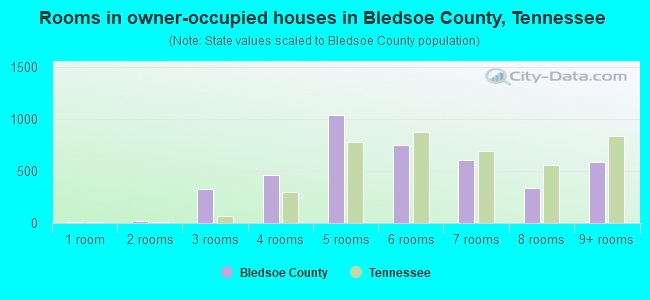
- Rooms in owner-occupied houses in Bledsoe County, Tennessee
- 81 room
- 322 rooms
- 3753 rooms
- 5304 rooms
- 8425 rooms
- 7586 rooms
- 6297 rooms
- 3278 rooms
- 6779+ rooms
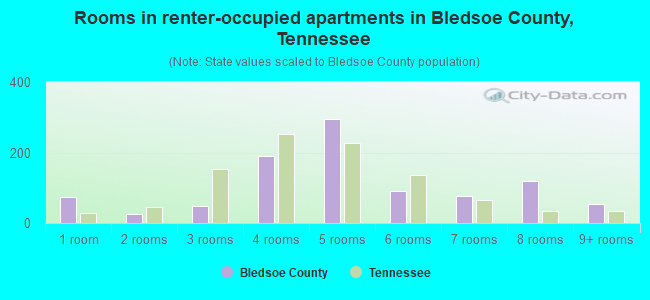
- Rooms in renter-occupied apartments in Bledsoe County, Tennessee
- 571 room
- 382 rooms
- 533 rooms
- 2074 rooms
- 2915 rooms
- 1096 rooms
- 617 rooms
- 878 rooms
- 719+ rooms
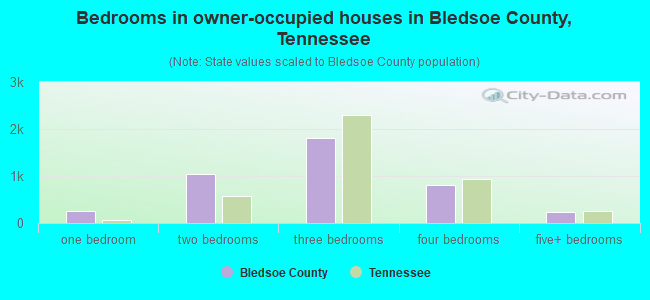
- Bedrooms in owner-occupied houses in Bledsoe County, Tennessee
- 9no bedroom
- 2041 bedroom
- 9602 bedrooms
- 1,9713 bedrooms
- 7454 bedrooms
- 2155+ bedrooms
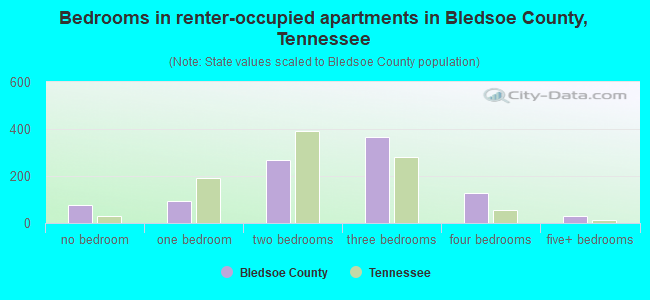
- Bedrooms in renter-occupied apartments in Bledsoe County, Tennessee
- 59no bedroom
- 1091 bedroom
- 2612 bedrooms
- 4303 bedrooms
- 624 bedrooms
- 515+ bedrooms
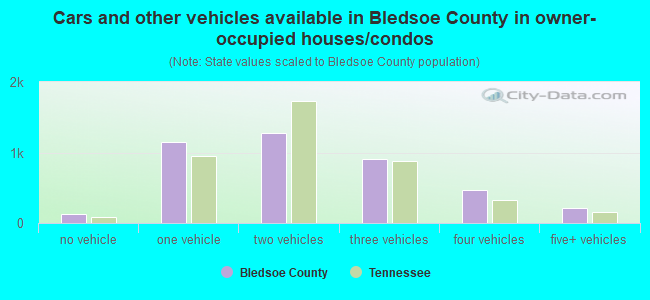
- Cars and other vehicles available in Bledsoe County in owner-occupied houses/condos
- 157no vehicle
- 9871 vehicle
- 1,2402 vehicles
- 9183 vehicles
- 5644 vehicles
- 2275+ vehicles
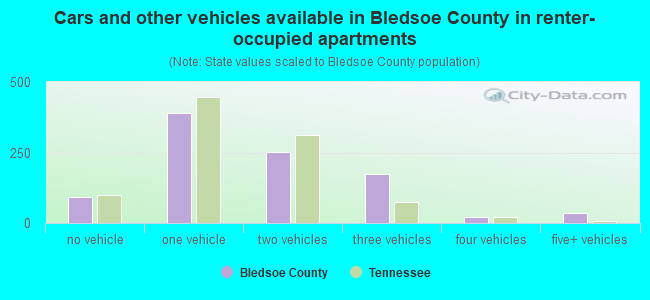
- Cars and other vehicles available in Bledsoe County in renter-occupied apartments
- 100no vehicle
- 3961 vehicle
- 2832 vehicles
- 1793 vehicles
- 234 vehicles
- 05+ vehicles
88.9% of Bledsoe County residents lived in the same house 1 years ago.
Out of people who lived in different houses, 27% lived in this county.
Out of people who lived in different counties, 56% lived in Tennessee.
| Bledsoe County: | 88.9% |
| State average: | 87.0% |
Place of birth for U.S.-born residents:
- This state: 10,021
- Other state: 4,590
- Northeast: 510
- Midwest: 1,581
- South: 2,144
- West: 327
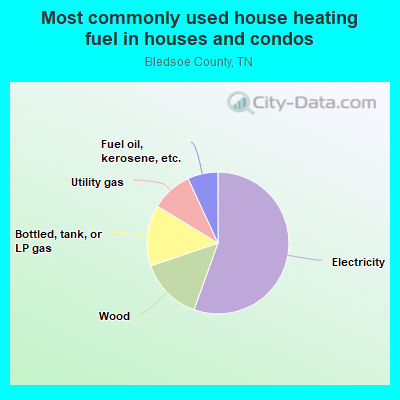
- 58.2%Electricity
- 15.0%Bottled, tank, or LP gas
- 11.3%Wood
- 10.4%Utility gas
- 5.1%Fuel oil, kerosene, etc.
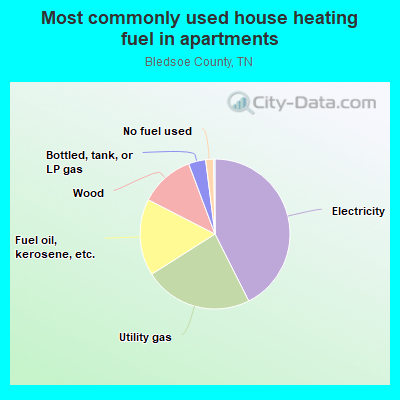
- 51.5%Electricity
- 19.3%Utility gas
- 15.0%Fuel oil, kerosene, etc.
- 6.0%No fuel used
- 5.5%Wood
- 2.7%Bottled, tank, or LP gas
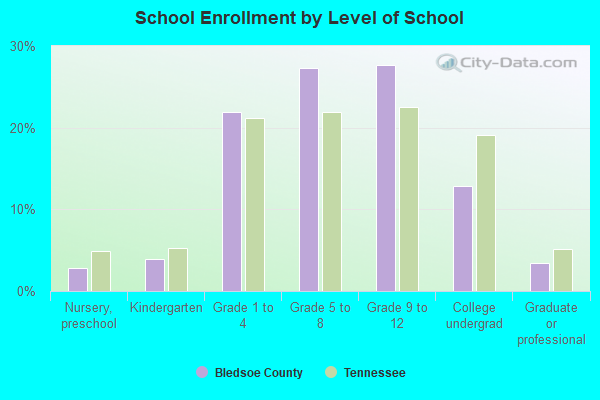
Private vs. public school enrollment:
| Here: | 8.5% |
| Tennessee: | 15.0% |
| Here: | 13.9% |
| Tennessee: | 16.2% |
| Here: | 7.1% |
| Tennessee: | 23.5% |
Bledsoe County government finances - Expenditure in 2017:
- Bond Funds - Cash and Securities: $384,000
- Charges - Other: $1,448,000
Other: $961,000
Elementary and Secondary Education - Other: $622,000
Elementary and Secondary Education - Other: $511,000
Elementary and Secondary Education School Lunch: $114,000
Elementary and Secondary Education School Lunch: $87,000
Solid Waste Management: $11,000
Solid Waste Management: $3,000
Elementary and Secondary Education School Tuition and Transportation: $1,000
- Construction - Regular Highways: $1,113,000
Regular Highways: $952,000
Health - Other: $807,000
Elementary and Secondary Education: $666,000
Housing and Community Development: $200,000
General - Other: $162,000
Judicial and Legal Services: $1,000
- Current Operations - Elementary and Secondary Education: $17,861,000
Elementary and Secondary Education: $17,571,000
Regular Highways: $1,900,000
Regular Highways: $1,513,000
Correctional Institutions: $1,415,000
Correctional Institutions: $1,303,000
Health - Other: $1,261,000
Police Protection: $1,191,000
Health - Other: $1,180,000
Police Protection: $916,000
Central Staff Services: $875,000
Judicial and Legal Services: $666,000
Central Staff Services: $596,000
Judicial and Legal Services: $528,000
Financial Administration: $430,000
Financial Administration: $395,000
Solid Waste Management: $372,000
General - Other: $244,000
Public Welfare - Other: $180,000
General Public Buildings: $146,000
General Public Buildings: $110,000
Libraries: $86,000
Libraries: $85,000
Natural Resources - Other: $78,000
Natural Resources - Other: $59,000
Solid Waste Management: $52,000
Local Fire Protection: $50,000
Local Fire Protection: $34,000
General - Other: $8,000
- Federal Intergovernmental - Other: $260,000
Housing and Community Development: $200,000
Highways: $52,000
General Local Government Support: $38,000
Health and Hospitals: $16,000
Highways: $10,000
- General - Interest on Debt: $571,000
Interest on Debt: $526,000
- Local Intergovernmental - Other: $1,526,000
- Long Term Debt - Beginning Outstanding - Unspecified Public Purpose: $21,572,000
Outstanding Unspecified Public Purpose: $20,216,000
Beginning Outstanding - Unspecified Public Purpose: $19,672,000
Outstanding Unspecified Public Purpose: $18,473,000
Retired Unspecified Public Purpose: $1,356,000
Retired Unspecified Public Purpose: $1,200,000
- Miscellaneous - Donations From Private Sources: $1,115,000
General Revenue - Other: $507,000
Fines and Forfeits: $442,000
General Revenue - Other: $302,000
Rents: $170,000
Interest Earnings: $167,000
Fines and Forfeits: $57,000
Interest Earnings: $43,000
Donations From Private Sources: $10,000
Sale of Property: $4,000
Sale of Property: $2,000
- Other Capital Outlay - Elementary and Secondary Education: $718,000
Elementary and Secondary Education: $672,000
General - Other: $40,000
- Other Funds - Cash and Securities: $6,725,000
Cash and Securities: $2,465,000
- Sinking Funds - Cash and Securities: $1,115,000
Cash and Securities: $941,000
- State Intergovernmental - Education: $16,967,000
Education: $16,065,000
Highways: $2,868,000
Highways: $2,123,000
Other: $1,402,000
General Local Government Support: $1,320,000
General Local Government Support: $552,000
Other: $116,000
Health and Hospitals: $83,000
- Tax - Property: $3,337,000
Property: $3,304,000
General Sales and Gross Receipts: $211,000
Occupation and Business License - Other: $42,000
Other Selective Sales: $31,000
Public Utilities Sales: $18,000
Other License: $18,000
- Total Salaries and Wages: $10,934,000
: $10,860,000
Bledsoe County government finances - Revenue in 2017:
- Bond Funds - Cash and Securities: $384,000
- Charges - Other: $1,448,000
Other: $961,000
Elementary and Secondary Education - Other: $622,000
Elementary and Secondary Education - Other: $511,000
Elementary and Secondary Education School Lunch: $114,000
Elementary and Secondary Education School Lunch: $87,000
Solid Waste Management: $11,000
Solid Waste Management: $3,000
Elementary and Secondary Education School Tuition and Transportation: $1,000
- Construction - Regular Highways: $1,113,000
Regular Highways: $952,000
Health - Other: $807,000
Elementary and Secondary Education: $666,000
Housing and Community Development: $200,000
General - Other: $162,000
Judicial and Legal Services: $1,000
- Current Operations - Elementary and Secondary Education: $17,861,000
Elementary and Secondary Education: $17,571,000
Regular Highways: $1,900,000
Regular Highways: $1,513,000
Correctional Institutions: $1,415,000
Correctional Institutions: $1,303,000
Health - Other: $1,261,000
Police Protection: $1,191,000
Health - Other: $1,180,000
Police Protection: $916,000
Central Staff Services: $875,000
Judicial and Legal Services: $666,000
Central Staff Services: $596,000
Judicial and Legal Services: $528,000
Financial Administration: $430,000
Financial Administration: $395,000
Solid Waste Management: $372,000
General - Other: $244,000
Public Welfare - Other: $180,000
General Public Buildings: $146,000
General Public Buildings: $110,000
Libraries: $86,000
Libraries: $85,000
Natural Resources - Other: $78,000
Natural Resources - Other: $59,000
Solid Waste Management: $52,000
Local Fire Protection: $50,000
Local Fire Protection: $34,000
General - Other: $8,000
- Federal Intergovernmental - Other: $260,000
Housing and Community Development: $200,000
Highways: $52,000
General Local Government Support: $38,000
Health and Hospitals: $16,000
Highways: $10,000
- General - Interest on Debt: $571,000
Interest on Debt: $526,000
- Local Intergovernmental - Other: $1,526,000
- Long Term Debt - Beginning Outstanding - Unspecified Public Purpose: $21,572,000
Outstanding Unspecified Public Purpose: $20,216,000
Beginning Outstanding - Unspecified Public Purpose: $19,672,000
Outstanding Unspecified Public Purpose: $18,473,000
Retired Unspecified Public Purpose: $1,356,000
Retired Unspecified Public Purpose: $1,200,000
- Miscellaneous - Donations From Private Sources: $1,115,000
General Revenue - Other: $507,000
Fines and Forfeits: $442,000
General Revenue - Other: $302,000
Rents: $170,000
Interest Earnings: $167,000
Fines and Forfeits: $57,000
Interest Earnings: $43,000
Donations From Private Sources: $10,000
Sale of Property: $4,000
Sale of Property: $2,000
- Other Capital Outlay - Elementary and Secondary Education: $718,000
Elementary and Secondary Education: $672,000
General - Other: $40,000
- Other Funds - Cash and Securities: $6,725,000
Cash and Securities: $2,465,000
- Sinking Funds - Cash and Securities: $1,115,000
Cash and Securities: $941,000
- State Intergovernmental - Education: $16,967,000
Education: $16,065,000
Highways: $2,868,000
Highways: $2,123,000
Other: $1,402,000
General Local Government Support: $1,320,000
General Local Government Support: $552,000
Other: $116,000
Health and Hospitals: $83,000
- Tax - Property: $3,337,000
Property: $3,304,000
General Sales and Gross Receipts: $211,000
Occupation and Business License - Other: $42,000
Other Selective Sales: $31,000
Public Utilities Sales: $18,000
Other License: $18,000
- Total Salaries and Wages: $10,934,000
: $10,860,000
Bledsoe County government finances - Debt in 2017:
- Bond Funds - Cash and Securities: $384,000
- Charges - Other: $1,448,000
Other: $961,000
Elementary and Secondary Education - Other: $622,000
Elementary and Secondary Education - Other: $511,000
Elementary and Secondary Education School Lunch: $114,000
Elementary and Secondary Education School Lunch: $87,000
Solid Waste Management: $11,000
Solid Waste Management: $3,000
Elementary and Secondary Education School Tuition and Transportation: $1,000
- Construction - Regular Highways: $1,113,000
Regular Highways: $952,000
Health - Other: $807,000
Elementary and Secondary Education: $666,000
Housing and Community Development: $200,000
General - Other: $162,000
Judicial and Legal Services: $1,000
- Current Operations - Elementary and Secondary Education: $17,861,000
Elementary and Secondary Education: $17,571,000
Regular Highways: $1,900,000
Regular Highways: $1,513,000
Correctional Institutions: $1,415,000
Correctional Institutions: $1,303,000
Health - Other: $1,261,000
Police Protection: $1,191,000
Health - Other: $1,180,000
Police Protection: $916,000
Central Staff Services: $875,000
Judicial and Legal Services: $666,000
Central Staff Services: $596,000
Judicial and Legal Services: $528,000
Financial Administration: $430,000
Financial Administration: $395,000
Solid Waste Management: $372,000
General - Other: $244,000
Public Welfare - Other: $180,000
General Public Buildings: $146,000
General Public Buildings: $110,000
Libraries: $86,000
Libraries: $85,000
Natural Resources - Other: $78,000
Natural Resources - Other: $59,000
Solid Waste Management: $52,000
Local Fire Protection: $50,000
Local Fire Protection: $34,000
General - Other: $8,000
- Federal Intergovernmental - Other: $260,000
Housing and Community Development: $200,000
Highways: $52,000
General Local Government Support: $38,000
Health and Hospitals: $16,000
Highways: $10,000
- General - Interest on Debt: $571,000
Interest on Debt: $526,000
- Local Intergovernmental - Other: $1,526,000
- Long Term Debt - Beginning Outstanding - Unspecified Public Purpose: $21,572,000
Outstanding Unspecified Public Purpose: $20,216,000
Beginning Outstanding - Unspecified Public Purpose: $19,672,000
Outstanding Unspecified Public Purpose: $18,473,000
Retired Unspecified Public Purpose: $1,356,000
Retired Unspecified Public Purpose: $1,200,000
- Miscellaneous - Donations From Private Sources: $1,115,000
General Revenue - Other: $507,000
Fines and Forfeits: $442,000
General Revenue - Other: $302,000
Rents: $170,000
Interest Earnings: $167,000
Fines and Forfeits: $57,000
Interest Earnings: $43,000
Donations From Private Sources: $10,000
Sale of Property: $4,000
Sale of Property: $2,000
- Other Capital Outlay - Elementary and Secondary Education: $718,000
Elementary and Secondary Education: $672,000
General - Other: $40,000
- Other Funds - Cash and Securities: $6,725,000
Cash and Securities: $2,465,000
- Sinking Funds - Cash and Securities: $1,115,000
Cash and Securities: $941,000
- State Intergovernmental - Education: $16,967,000
Education: $16,065,000
Highways: $2,868,000
Highways: $2,123,000
Other: $1,402,000
General Local Government Support: $1,320,000
General Local Government Support: $552,000
Other: $116,000
Health and Hospitals: $83,000
- Tax - Property: $3,337,000
Property: $3,304,000
General Sales and Gross Receipts: $211,000
Occupation and Business License - Other: $42,000
Other Selective Sales: $31,000
Public Utilities Sales: $18,000
Other License: $18,000
- Total Salaries and Wages: $10,934,000
: $10,860,000
Bledsoe County government finances - Cash and Securities in 2017:
- Bond Funds - Cash and Securities: $384,000
- Charges - Other: $1,448,000
Other: $961,000
Elementary and Secondary Education - Other: $622,000
Elementary and Secondary Education - Other: $511,000
Elementary and Secondary Education School Lunch: $114,000
Elementary and Secondary Education School Lunch: $87,000
Solid Waste Management: $11,000
Solid Waste Management: $3,000
Elementary and Secondary Education School Tuition and Transportation: $1,000
- Construction - Regular Highways: $1,113,000
Regular Highways: $952,000
Health - Other: $807,000
Elementary and Secondary Education: $666,000
Housing and Community Development: $200,000
General - Other: $162,000
Judicial and Legal Services: $1,000
- Current Operations - Elementary and Secondary Education: $17,861,000
Elementary and Secondary Education: $17,571,000
Regular Highways: $1,900,000
Regular Highways: $1,513,000
Correctional Institutions: $1,415,000
Correctional Institutions: $1,303,000
Health - Other: $1,261,000
Police Protection: $1,191,000
Health - Other: $1,180,000
Police Protection: $916,000
Central Staff Services: $875,000
Judicial and Legal Services: $666,000
Central Staff Services: $596,000
Judicial and Legal Services: $528,000
Financial Administration: $430,000
Financial Administration: $395,000
Solid Waste Management: $372,000
General - Other: $244,000
Public Welfare - Other: $180,000
General Public Buildings: $146,000
General Public Buildings: $110,000
Libraries: $86,000
Libraries: $85,000
Natural Resources - Other: $78,000
Natural Resources - Other: $59,000
Solid Waste Management: $52,000
Local Fire Protection: $50,000
Local Fire Protection: $34,000
General - Other: $8,000
- Federal Intergovernmental - Other: $260,000
Housing and Community Development: $200,000
Highways: $52,000
General Local Government Support: $38,000
Health and Hospitals: $16,000
Highways: $10,000
- General - Interest on Debt: $571,000
Interest on Debt: $526,000
- Local Intergovernmental - Other: $1,526,000
- Long Term Debt - Beginning Outstanding - Unspecified Public Purpose: $21,572,000
Outstanding Unspecified Public Purpose: $20,216,000
Beginning Outstanding - Unspecified Public Purpose: $19,672,000
Outstanding Unspecified Public Purpose: $18,473,000
Retired Unspecified Public Purpose: $1,356,000
Retired Unspecified Public Purpose: $1,200,000
- Miscellaneous - Donations From Private Sources: $1,115,000
General Revenue - Other: $507,000
Fines and Forfeits: $442,000
General Revenue - Other: $302,000
Rents: $170,000
Interest Earnings: $167,000
Fines and Forfeits: $57,000
Interest Earnings: $43,000
Donations From Private Sources: $10,000
Sale of Property: $4,000
Sale of Property: $2,000
- Other Capital Outlay - Elementary and Secondary Education: $718,000
Elementary and Secondary Education: $672,000
General - Other: $40,000
- Other Funds - Cash and Securities: $6,725,000
Cash and Securities: $2,465,000
- Sinking Funds - Cash and Securities: $1,115,000
Cash and Securities: $941,000
- State Intergovernmental - Education: $16,967,000
Education: $16,065,000
Highways: $2,868,000
Highways: $2,123,000
Other: $1,402,000
General Local Government Support: $1,320,000
General Local Government Support: $552,000
Other: $116,000
Health and Hospitals: $83,000
- Tax - Property: $3,337,000
Property: $3,304,000
General Sales and Gross Receipts: $211,000
Occupation and Business License - Other: $42,000
Other Selective Sales: $31,000
Public Utilities Sales: $18,000
Other License: $18,000
- Total Salaries and Wages: $10,934,000
: $10,860,000
Supplemental Security Income (SSI) in 2006:
- Total number of recipients: 442
- Number of aged recipients: 65
- Number of blind and disabled recipients: 377
- Number of recipients under 18: 29
- Number of recipients between 18 and 64: 282
- Number of recipients older than 64: 131
- Number of recipients also receiving OASDI: 195
- Amount of payments (thousands of dollars): 186
| Most common first names in Bledsoe County, TN among deceased individuals | ||
| Name | Count | Lived (average) |
|---|---|---|
| James | 91 | 71.1 years |
| William | 80 | 74.4 years |
| John | 69 | 73.5 years |
| Mary | 47 | 77.2 years |
| Robert | 40 | 72.0 years |
| Charles | 40 | 67.4 years |
| George | 30 | 75.9 years |
| Thomas | 27 | 73.8 years |
| Roy | 19 | 72.0 years |
| Willie | 19 | 78.5 years |
| Most common last names in Bledsoe County, TN among deceased individuals | ||
| Last name | Count | Lived (average) |
|---|---|---|
| Smith | 71 | 73.6 years |
| Swafford | 70 | 79.9 years |
| Brown | 47 | 81.2 years |
| Hale | 41 | 76.8 years |
| Walker | 36 | 72.9 years |
| Johnson | 35 | 74.6 years |
| Angel | 35 | 69.0 years |
| Simmons | 35 | 77.1 years |
| Roberson | 33 | 76.8 years |
| Brock | 28 | 69.1 years |
| Businesses in Bledsoe County, TN | ||||
| Name | Count | Name | Count | |
|---|---|---|---|---|
| AutoZone | 1 | Subway | 1 | |
| H&R Block | 1 | U-Haul | 2 | |
| McDonald's | 1 | |||