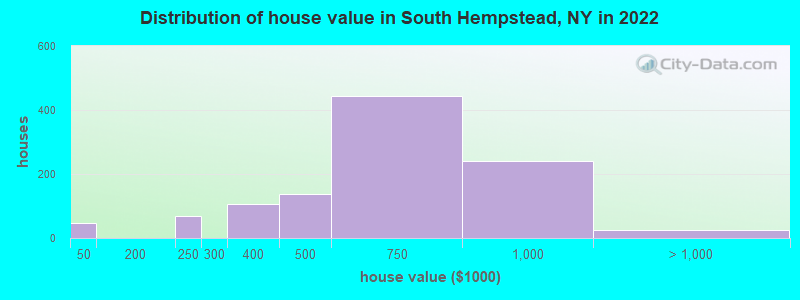
Estimated median house or condo value in 2022: $588,293 (it was $193,000 in 2000)
South Hempstead:
$588,293
NY:
$400,400
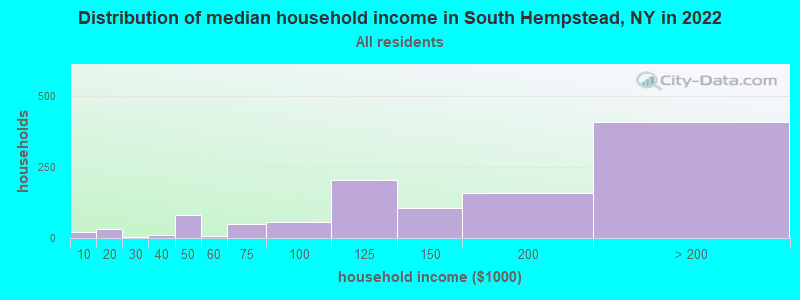
Mean prices in 2022:all housing units: $779,837; detached houses: $818,157; townhouses or other attached units: $921,906; in 2-unit structures: $649,689; in 3-to-4-unit structures: $388,210; in 5-or-more-unit structures: $438,581; mobile homes: over $1,000,000
Median gross rent in 2022: $2,800.
March 2022 cost of living index in South Hempstead: 152.5 (very high, U.S. average is 100)
Percentage of residents living in poverty in 2022: 2.5%
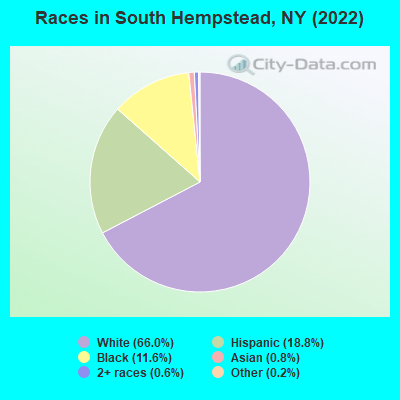
(2.6% for White Non-Hispanic residents, 4.0% for Black residents, 0.5% for Hispanic or Latino residents, 23.1% for American Indian residents)
Latest news from South Hempstead, NY collected exclusively by city-data.com from local newspapers, TV, and radio stations
Ancestries: Italian (19.2%), Irish (18.0%), Haitian (10.4%), Jamaican (3.8%), European (2.0%), American (1.9%).
Current Local Time: EST time zone
Land area: 0.59 square miles.
Population density: 5,535 people per square mile (average).
411 residents are foreign born (11.8% Latin America).
This place:
13.2%
New York:
22.6%
Median real estate property taxes paid for housing units with mortgages in 2022: $10,001 (1.6%) Median real estate property taxes paid for housing units with no mortgage in 2022: $10,001 (2.0%)
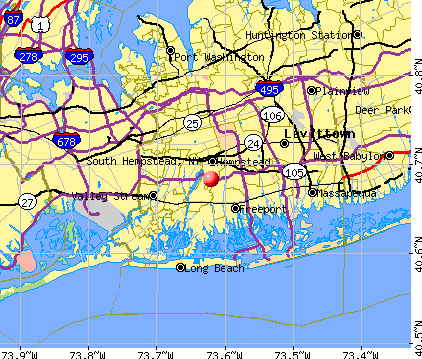
Nearest city with pop. 50,000+: Hempstead, NY (1.5 miles , pop. 56,554).
Nearest city with pop. 200,000+: North Hempstead, NY (6.9 miles , pop. 222,611).
Nearest city with pop. 1,000,000+: Queens, NY (10.7 miles , pop. 2,229,379).
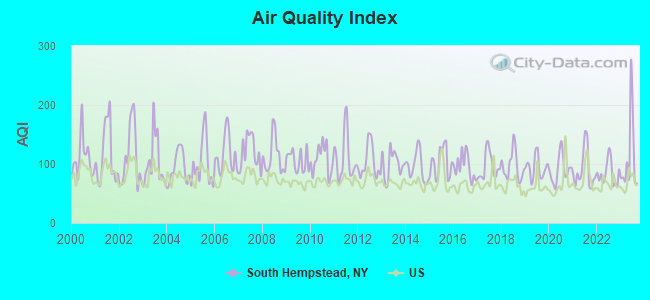
Air Quality Index (AQI) level in 2023 was 110. This is significantly worse than average.
City:
110
U.S.:
73
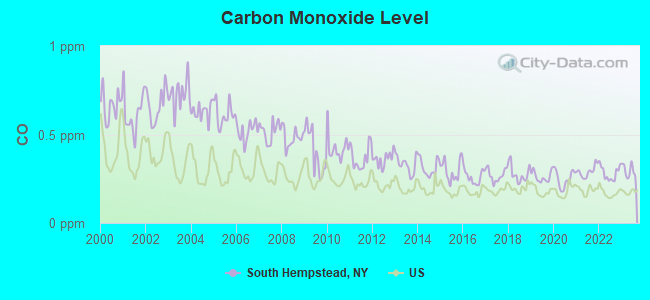
Carbon Monoxide (CO) [ppm] level in 2023 was 0.295. This is about average.Closest monitor was 4.5 miles away from the city center.
City:
0.295
U.S.:
0.251
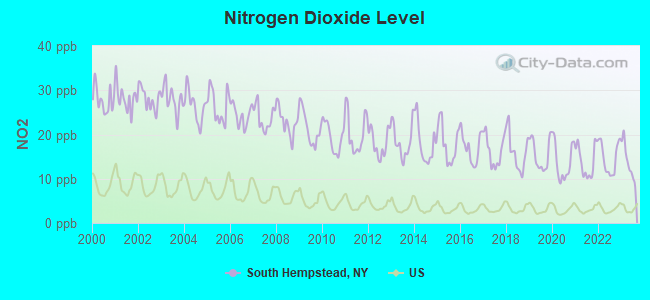
Nitrogen Dioxide (NO2) [ppb] level in 2023 was 13.9. This is significantly worse than average.Closest monitor was 8.8 miles away from the city center.
City:
13.9
U.S.:
5.1
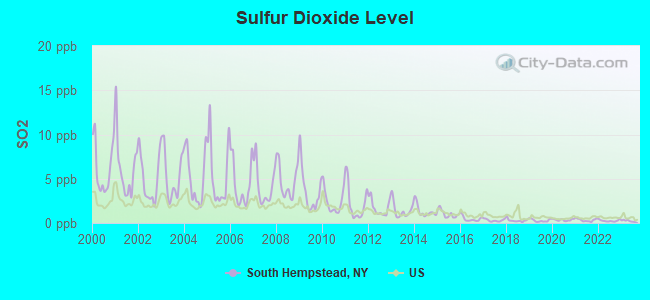
Sulfur Dioxide (SO2) [ppb] level in 2023 was 0.236. This is significantly better than average.Closest monitor was 1.2 miles away from the city center.
City:
0.236
U.S.:
1.515
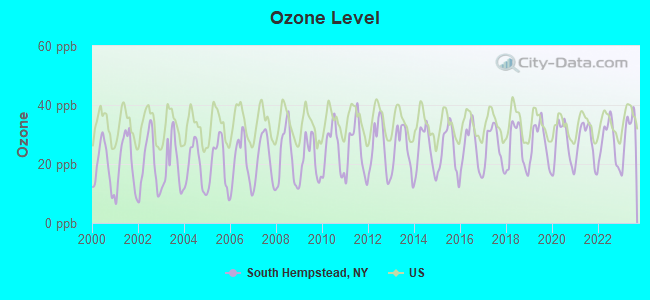
Ozone [ppb] level in 2023 was 30.9. This is about average.Closest monitor was 4.5 miles away from the city center.
City:
30.9
U.S.:
33.3
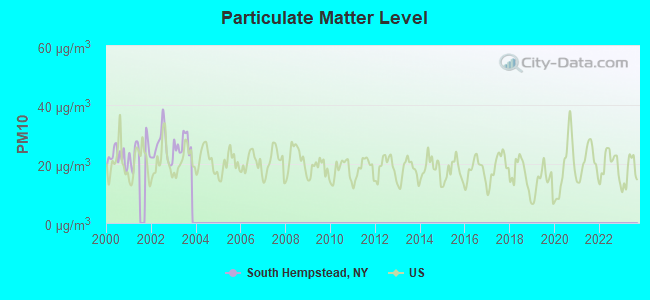
Particulate Matter (PM10) [µg/m3] level in 2003 was 26.9. This is worse than average.Closest monitor was 7.2 miles away from the city center.
City:
26.9
U.S.:
19.2
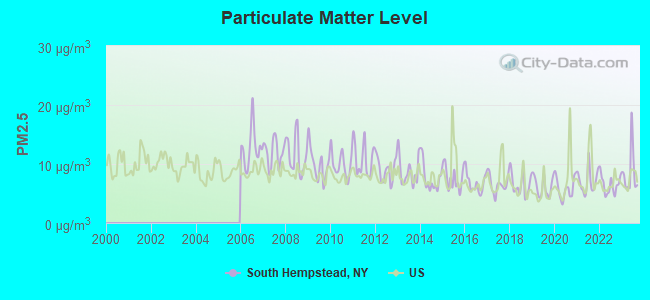
Particulate Matter (PM2.5) [µg/m3] level in 2023 was 8.54. This is about average.Closest monitor was 4.5 miles away from the city center.
City:
8.54
U.S.:
8.11
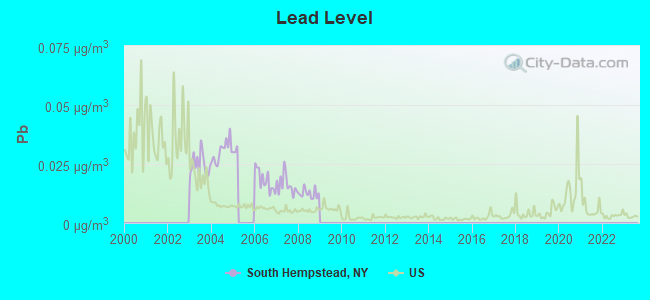
Lead (Pb) [µg/m3] level in 2008 was 0.0125. This is worse than average.Closest monitor was 4.5 miles away from the city center.
City:
0.0125
U.S.:
0.0093
Tornado activity:
South Hempstead-area historical tornado activity is slightly above New York state average. It is 52% smaller than the overall U.S. average.
On 9/7/1998, a category F2 (max. wind speeds 113-157 mph) tornado 3.9 miles away from the South Hempstead place center injured 6 peopleand caused $1 million in damages.
On 9/27/1970, a category F2 tornado 6.4 miles away from the place center causedbetween $50,000 and $500,000 in damages.
Earthquake activity:
South Hempstead-area historical earthquake activity is significantly above New York state average. It is 70% smaller than the overall U.S. average.
On 8/23/2011 at 17:51:04, a magnitude 5.8 (5.8 MW, Depth: 3.7 mi, Class: Moderate, Intensity: VI - VII) earthquake occurred 300.2 miles away from South Hempstead center On 10/7/1983 at 10:18:46, a magnitude 5.3 (5.1 MB, 5.3 LG, 5.1 ML) earthquake occurred 229.1 miles away from South Hempstead center On 4/20/2002 at 10:50:47, a magnitude 5.3 (5.3 ML, Depth: 3.0 mi) earthquake occurred 264.9 miles away from the city center On 1/16/1994 at 01:49:16, a magnitude 4.6 (4.6 MB, 4.6 LG, Depth: 3.1 mi, Class: Light, Intensity: IV - V) earthquake occurred 129.4 miles away from the city center On 4/20/2002 at 10:50:47, a magnitude 5.2 (5.2 MB, 4.2 MS, 5.2 MW, 5.0 MW) earthquake occurred 263.1 miles away from the city center On 8/22/1992 at 12:20:32, a magnitude 4.8 (4.8 MB, 3.8 MS, 4.7 LG, Depth: 6.2 mi) earthquake occurred 206.4 miles away from South Hempstead center Magnitude types: regional Lg-wave magnitude (LG), body-wave magnitude (MB), local magnitude (ML), surface-wave magnitude (MS), moment magnitude (MW)
Natural disasters:
The number of natural disasters in Nassau County (25) is a lot greater than the US average (15). Major Disasters (Presidential) Declared: 17 Emergencies Declared: 7
Causes of natural disasters: Hurricanes: 8, Storms: 7, Floods: 6, Blizzards: 2, Snowstorms: 2, Heavy Rain: 1, Power Outage: 1, Tropical Depression: 1, Tropical Storm: 1, Water Shortage: 1, Winter Storm: 1, Other: 3 (Note: some incidents may be assigned to more than one category).
Hospitals and medical centers near South Hempstead:
MERCY MEDICAL CENTER Acute Care Hospitals (about 1 miles away; ROCKVILLE CENTRE, NY)
NASSAU DIALYSIS LLC (Dialysis Facility, about 2 miles away; HEMPSTEAD, NY)
MAYFAIR CARE CENTER INC (Nursing Home, about 2 miles away; HEMPSTEAD, NY)
LIFE CARE HOSPICE (Hospital, about 2 miles away; HEMPSTEAD, NY)
FREE, INC (Hospital, about 2 miles away; HEMPSTEAD, NY)
SOUTH NASSAU COMM HOSP CHHA (Home Health Center, about 3 miles away; BALDWIN, NY)
HEMPSTEAD PARK NH CLOSED (Nursing Home, about 3 miles away; HEMPSTEAD, NY)
Amtrak stations near South Hempstead:
10 miles: KENNEDY AIRPORT NEW YORK (QUEENS, ) - Bus Station . Services: enclosed waiting area, public restrooms, public payphones, snack bar and vending machines, ATM, paid short-term parking, paid long-term parking, car rental agency, taxi stand.
15 miles: LA GUARDIA AIRPORT (QUEENS, ) - Bus Station . Services: enclosed waiting area, public restrooms, public payphones, snack bar and vending machines, ATM, paid short-term parking, paid long-term parking, car rental agency, taxi stand.
19 miles: NEW ROCHELLE (DEPOT PLAZA NORTH) . Services: enclosed waiting area, public restrooms, public payphones, paid short-term parking, paid long-term parking, call for car rental service, taxi stand, public transit connection.
Colleges/universities with over 2000 students nearest to South Hempstead:
Molloy College (about 1 miles; Rockville Centre, NY; Full-time enrollment: 3,962)
Hofstra University (about 3 miles; Hempstead, NY; FT enrollment: 9,429)
Adelphi University (about 4 miles; Garden City, NY; FT enrollment: 7,312)
Nassau Community College (about 4 miles; Garden City, NY; FT enrollment: 18,552)
SUNY College at Old Westbury (about 8 miles; Old Westbury, NY; FT enrollment: 4,096)
Briarcliffe College (about 9 miles; Bethpage, NY; FT enrollment: 2,134)
CUNY Queensborough Community College (about 9 miles; Bayside, NY; FT enrollment: 11,931)
Public elementary/middle school in South Hempstead:
Nassau County has a predicted average indoor radon screening level less than 2 pCi/L (pico curies per liter) - Low Potential
Average household size:
This place:
3.1 people
New York:
2.6 people
Percentage of family households:
This place:
80.9%
Whole state:
63.5%
Percentage of households with unmarried partners:
This place:
3.1%
Whole state:
6.8%
Likely homosexual households (counted as self-reported same-sex unmarried-partner households)
Lesbian couples: 0.1% of all households
Gay men: 0.1% of all households
Banks with branches in South Hempstead (2011 data):
Bank of America, National Association: South Hempstead Branch at 1150 Grand Avenue, branch established on 1954/11/15. Info updated 2009/11/18: Bank assets: $1,451,969.3 mil, Deposits: $1,077,176.8 mil, headquarters in Charlotte, NC, positive income, 5782 total offices, Holding Company: Bank Of America Corporation
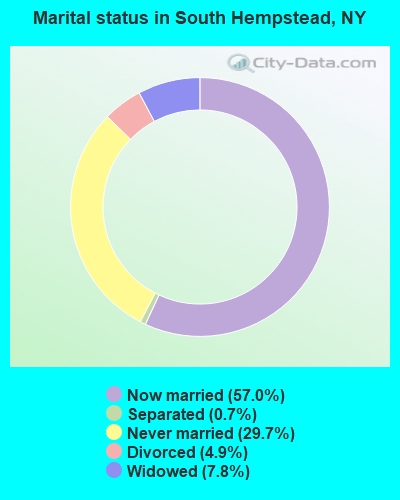
For population 15 years and over in South Hempstead:
Never married: 29.7%
Now married: 57.0%
Separated: 0.7%
Widowed: 7.8%
Divorced: 4.9%
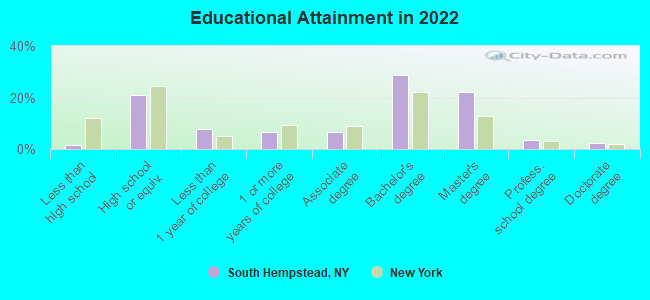
For population 25 years and over in South Hempstead:
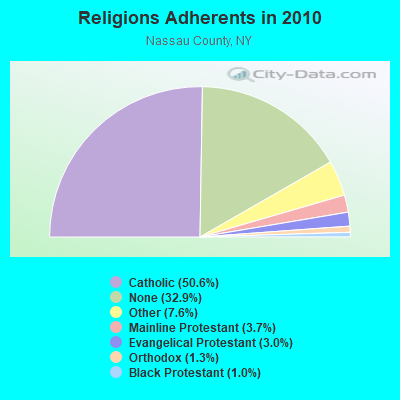
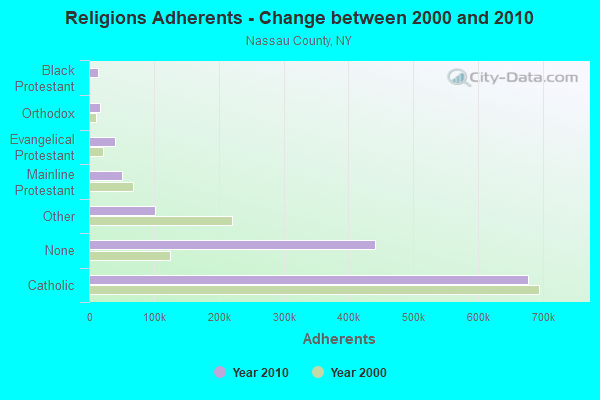
Religion statistics for South Hempstead, NY (based on Nassau County data)
Religion
Adherents
Congregations
Catholic
677,149
73
Other
102,012
168
Mainline Protestant
50,181
184
Evangelical Protestant
39,923
251
Orthodox
16,758
22
Black Protestant
13,189
45
None
440,320
-
Source: Clifford Grammich, Kirk Hadaway, Richard Houseal, Dale E.Jones, Alexei Krindatch, Richie Stanley and Richard H.Taylor. 2012. 2010 U.S.Religion Census: Religious Congregations & Membership Study. Association of Statisticians of American Religious Bodies. Jones, Dale E., et al. 2002. Congregations and Membership in the United States 2000. Nashville, TN: Glenmary Research Center. Graphs represent county-level data
Lat: 40.684000 Lon: -73.620000, Call Sign: WQVX200, Licensee ID: L00794749, Assigned Frequencies: 458.600 MHz, 458.350 MHz, 465.387 MHz, Grant Date: 06/03/2015, Expiration Date: 06/03/2025, Certifier: Paul Cartier, Registrant: South Hempstead Fire District, 555 Mat Street, South Hempstead, NY 11550, Phone: (516) 486-3406
FCC Registered Amateur Radio Licenses:
4
Call Sign: N2UEX, Licensee ID: L00676998, Grant Date: 04/28/2003, Expiration Date: 03/16/2013, Cancellation Date: 03/17/2015, Registrant: Moryl Gattereau, 659 Georgia St, South Hempstead, NY 11550
Call Sign: WA2JOR, Licensee ID: L01278335, Grant Date: 04/24/2017, Expiration Date: 05/01/2027, Certifier: Gerald J Strein, Registrant: Gerald J Strein, 547 Maude St, South Hempstead, NY 11550
Call Sign: WA2JSO, Grant Date: 06/03/1996, Expiration Date: 06/03/2006, Cancellation Date: 06/04/2008, Registrant: Ronald L Szabo, 1223 Webber Ave, South Hempstead, NY 11550
Call Sign: KC2OJM, Licensee ID: L01030220, Grant Date: 04/17/2015, Expiration Date: 06/15/2025, Certifier: Richard T Watson, Registrant: Richard T Watson, 1053 Long Beach Road, South Hempstead, NY 11550
Home Mortgage Disclosure Act Aggregated Statistics For Year 2009 (Based on 1 full tract)
A) FHA, FSA/RHS & VA Home Purchase Loans
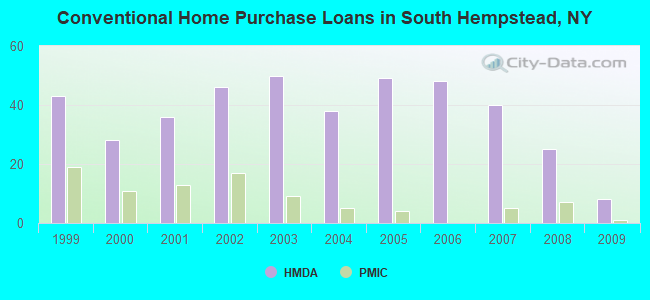
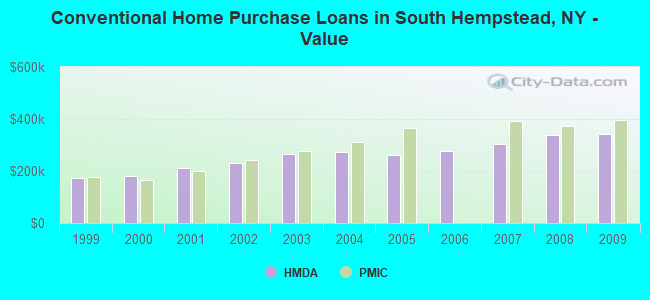
B) Conventional Home Purchase Loans
C) Refinancings
D) Home Improvement Loans
F) Non-occupant Loans on < 5 Family Dwellings (A B C & D)
Number
Average Value
Number
Average Value
Number
Average Value
Number
Average Value
Number
Average Value
LOANS ORIGINATED
5
$315,106
8
$342,148
33
$258,862
3
$156,620
1
$246,930
APPLICATIONS APPROVED, NOT ACCEPTED
0
$0
2
$234,930
4
$324,652
1
$24,990
0
$0
APPLICATIONS DENIED
5
$339,698
1
$217,930
18
$304,575
5
$93,372
0
$0
APPLICATIONS WITHDRAWN
0
$0
0
$0
17
$290,207
0
$0
0
$0
FILES CLOSED FOR INCOMPLETENESS
0
$0
0
$0
7
$287,486
0
$0
0
$0
Aggregated Statistics For Year 2008 (Based on 1 full tract)
A) FHA, FSA/RHS & VA Home Purchase Loans
B) Conventional Home Purchase Loans
C) Refinancings
D) Home Improvement Loans
F) Non-occupant Loans on < 5 Family Dwellings (A B C & D)
Number
Average Value
Number
Average Value
Number
Average Value
Number
Average Value
Number
Average Value
LOANS ORIGINATED
6
$320,737
25
$336,739
22
$323,358
8
$53,109
1
$299,910
APPLICATIONS APPROVED, NOT ACCEPTED
0
$0
3
$292,913
8
$295,036
2
$74,980
0
$0
APPLICATIONS DENIED
1
$362,890
7
$364,034
32
$351,488
7
$125,249
0
$0
APPLICATIONS WITHDRAWN
1
$360,890
1
$416,870
10
$286,414
1
$269,920
0
$0
FILES CLOSED FOR INCOMPLETENESS
0
$0
0
$0
0
$0
0
$0
0
$0
Aggregated Statistics For Year 2007 (Based on 1 full tract)
A) FHA, FSA/RHS & VA Home Purchase Loans
B) Conventional Home Purchase Loans
C) Refinancings
D) Home Improvement Loans
F) Non-occupant Loans on < 5 Family Dwellings (A B C & D)
Number
Average Value
Number
Average Value
Number
Average Value
Number
Average Value
Number
Average Value
LOANS ORIGINATED
0
$0
40
$302,459
37
$276,971
6
$82,975
3
$293,247
APPLICATIONS APPROVED, NOT ACCEPTED
0
$0
11
$350,804
14
$273,632
3
$269,920
1
$95,970
APPLICATIONS DENIED
0
$0
19
$325,692
49
$313,498
8
$20,869
3
$176,613
APPLICATIONS WITHDRAWN
1
$228,930
2
$394,880
12
$345,397
0
$0
0
$0
FILES CLOSED FOR INCOMPLETENESS
0
$0
1
$490,850
7
$418,874
0
$0
0
$0
Aggregated Statistics For Year 2006 (Based on 1 full tract)
B) Conventional Home Purchase Loans
C) Refinancings
D) Home Improvement Loans
F) Non-occupant Loans on < 5 Family Dwellings (A B C & D)
Number
Average Value
Number
Average Value
Number
Average Value
Number
Average Value
LOANS ORIGINATED
48
$277,896
51
$247,730
9
$159,174
2
$234,930
APPLICATIONS APPROVED, NOT ACCEPTED
7
$270,633
16
$281,916
6
$79,310
0
$0
APPLICATIONS DENIED
16
$286,914
42
$272,252
11
$166,677
3
$159,953
APPLICATIONS WITHDRAWN
13
$177,639
35
$239,071
5
$286,914
1
$347,900
FILES CLOSED FOR INCOMPLETENESS
1
$374,890
5
$237,528
1
$189,940
0
$0
Aggregated Statistics For Year 2005 (Based on 1 full tract)
B) Conventional Home Purchase Loans
C) Refinancings
D) Home Improvement Loans
F) Non-occupant Loans on < 5 Family Dwellings (A B C & D)
Number
Average Value
Number
Average Value
Number
Average Value
Number
Average Value
LOANS ORIGINATED
49
$261,758
80
$263,408
9
$164,173
4
$225,932
APPLICATIONS APPROVED, NOT ACCEPTED
14
$241,499
18
$228,876
1
$24,990
3
$219,267
APPLICATIONS DENIED
9
$261,254
30
$215,302
4
$124,712
2
$190,945
APPLICATIONS WITHDRAWN
8
$284,290
26
$293,373
1
$692,790
1
$105,970
FILES CLOSED FOR INCOMPLETENESS
1
$367,890
18
$333,511
0
$0
1
$333,900
Aggregated Statistics For Year 2004 (Based on 1 full tract)
A) FHA, FSA/RHS & VA Home Purchase Loans
B) Conventional Home Purchase Loans
C) Refinancings
D) Home Improvement Loans
F) Non-occupant Loans on < 5 Family Dwellings (A B C & D)
G) Loans On Manufactured Home Dwelling (A B C & D)
Number
Average Value
Number
Average Value
Number
Average Value
Number
Average Value
Number
Average Value
Number
Average Value
LOANS ORIGINATED
1
$239,930
38
$274,418
103
$245,159
14
$130,246
3
$306,573
0
$0
APPLICATIONS APPROVED, NOT ACCEPTED
0
$0
7
$293,626
27
$241,557
4
$293,412
1
$305,910
0
$0
APPLICATIONS DENIED
0
$0
10
$306,708
39
$240,107
13
$46,755
2
$191,445
0
$0
APPLICATIONS WITHDRAWN
0
$0
7
$221,077
57
$273,199
6
$116,798
0
$0
1
$21,990
FILES CLOSED FOR INCOMPLETENESS
0
$0
7
$320,190
16
$252,799
3
$163,617
0
$0
0
$0
Aggregated Statistics For Year 2003 (Based on 1 full tract)
A) FHA, FSA/RHS & VA Home Purchase Loans
B) Conventional Home Purchase Loans
C) Refinancings
D) Home Improvement Loans
F) Non-occupant Loans on < 5 Family Dwellings (A B C & D)
Number
Average Value
Number
Average Value
Number
Average Value
Number
Average Value
Number
Average Value
LOANS ORIGINATED
4
$254,922
50
$267,260
177
$192,948
9
$74,422
3
$99,303
APPLICATIONS APPROVED, NOT ACCEPTED
0
$0
6
$264,087
36
$180,779
2
$89,975
0
$0
APPLICATIONS DENIED
0
$0
8
$296,911
76
$199,559
2
$32,490
1
$275,920
APPLICATIONS WITHDRAWN
0
$0
5
$258,322
56
$220,916
0
$0
0
$0
FILES CLOSED FOR INCOMPLETENESS
1
$202,940
2
$197,440
11
$220,025
0
$0
1
$149,960
Aggregated Statistics For Year 2002 (Based on 1 full tract)
A) FHA, FSA/RHS & VA Home Purchase Loans
B) Conventional Home Purchase Loans
C) Refinancings
D) Home Improvement Loans
F) Non-occupant Loans on < 5 Family Dwellings (A B C & D)
Number
Average Value
Number
Average Value
Number
Average Value
Number
Average Value
Number
Average Value
LOANS ORIGINATED
6
$214,768
46
$232,017
101
$184,885
14
$57,269
2
$293,910
APPLICATIONS APPROVED, NOT ACCEPTED
0
$0
8
$252,924
17
$164,480
2
$36,490
2
$242,925
APPLICATIONS DENIED
1
$260,920
4
$233,930
29
$130,133
7
$52,984
3
$185,277
APPLICATIONS WITHDRAWN
0
$0
7
$217,077
27
$143,401
9
$26,437
2
$137,460
FILES CLOSED FOR INCOMPLETENESS
0
$0
0
$0
14
$173,376
0
$0
0
$0
Aggregated Statistics For Year 2001 (Based on 1 full tract)
A) FHA, FSA/RHS & VA Home Purchase Loans
B) Conventional Home Purchase Loans
C) Refinancings
D) Home Improvement Loans
F) Non-occupant Loans on < 5 Family Dwellings (A B C & D)
Number
Average Value
Number
Average Value
Number
Average Value
Number
Average Value
Number
Average Value
LOANS ORIGINATED
3
$177,280
36
$213,408
83
$160,759
7
$114,823
1
$243,930
APPLICATIONS APPROVED, NOT ACCEPTED
1
$200,940
2
$175,945
14
$175,019
3
$154,953
1
$141,960
APPLICATIONS DENIED
1
$201,940
1
$134,960
35
$139,672
8
$66,105
0
$0
APPLICATIONS WITHDRAWN
1
$236,930
1
$260,920
26
$121,194
5
$22,794
1
$253,920
FILES CLOSED FOR INCOMPLETENESS
1
$239,930
0
$0
3
$134,627
0
$0
0
$0
Aggregated Statistics For Year 2000 (Based on 1 full tract)
A) FHA, FSA/RHS & VA Home Purchase Loans
B) Conventional Home Purchase Loans
C) Refinancings
D) Home Improvement Loans
F) Non-occupant Loans on < 5 Family Dwellings (A B C & D)
Number
Average Value
Number
Average Value
Number
Average Value
Number
Average Value
Number
Average Value
LOANS ORIGINATED
5
$189,744
28
$180,018
23
$114,574
11
$40,261
1
$152,950
APPLICATIONS APPROVED, NOT ACCEPTED
0
$0
7
$170,377
8
$84,225
8
$36,114
0
$0
APPLICATIONS DENIED
1
$224,930
6
$166,783
23
$131,395
10
$30,191
1
$249,930
APPLICATIONS WITHDRAWN
1
$140,960
2
$245,925
26
$91,319
1
$1,000
1
$39,990
FILES CLOSED FOR INCOMPLETENESS
2
$203,940
0
$0
5
$180,746
1
$149,960
0
$0
Aggregated Statistics For Year 1999 (Based on 1 partial tract)
A) FHA, FSA/RHS & VA Home Purchase Loans
B) Conventional Home Purchase Loans
C) Refinancings
D) Home Improvement Loans
E) Loans on Dwellings For 5+ Families
F) Non-occupant Loans on < 5 Family Dwellings (A B C & D)


 Recent articles from our blog. Our writers, many of them Ph.D. graduates or candidates, create easy-to-read articles on a wide variety of topics.

 (1.5 miles