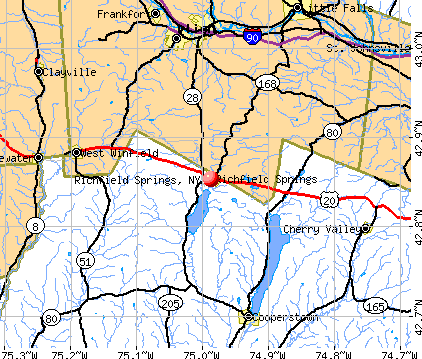
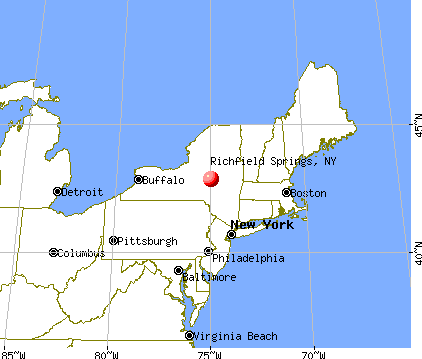
Richfield Springs, New York
Richfield Springs: sunset on route 20 September 8,2012
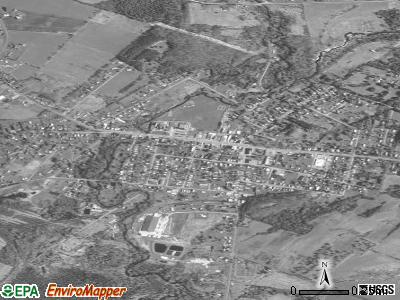
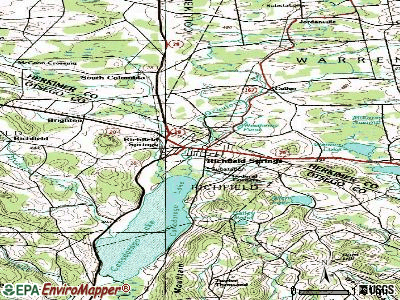
Richfield Springs: Off Route 20 in Richfield Springs
- add
your
Submit your own pictures of this village and show them to the world
- OSM Map
- General Map
- Google Map
- MSN Map
Population change since 2000: -12.9%
 |
| Males: 554 | |
| Females: 539 |
| Median resident age: | 34.3 years |
| New York median age: | 40.0 years |
Zip codes: 13439.
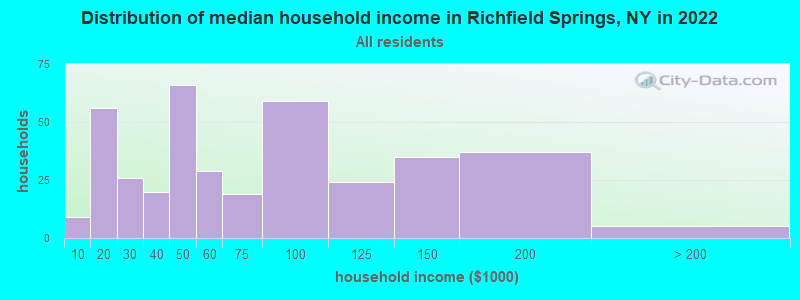
| Richfield Springs: | $53,415 |
| NY: | $79,557 |
Estimated per capita income in 2022: $27,649 (it was $16,865 in 2000)
Richfield Springs village income, earnings, and wages data
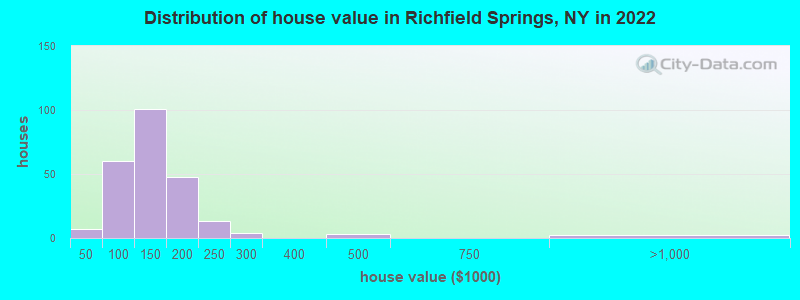
Estimated median house or condo value in 2022: $123,216 (it was $61,700 in 2000)
| Richfield Springs: | $123,216 |
| NY: | $400,400 |
Mean prices in 2022: all housing units: $182,220; detached houses: $179,274; in 2-unit structures: $360,382; mobile homes: $44,521
Median gross rent in 2022: $722.
Richfield Springs, NY residents, houses, and apartments details
(26.8% for White Non-Hispanic residents, 100.0% for Black residents, 4.1% for Hispanic or Latino residents, 8.5% for two or more races residents)
Detailed information about poverty and poor residents in Richfield Springs, NY


Compare current foreclosures near Richfield Springs, NY:
| Photo | Address | Area | Beds / Baths | Price | Details |
|---|---|---|---|---|---|

|
#1
Hogsback Rd
Richfield Springs, NY 13439
|
1,920 sq. feet
|
1 baths 3 beds |
show details | |

|
#2
Main St
Richfield Springs, NY 13439
|
- sq. feet
|
- baths - beds |
show details | |

|
#3
Pine Ave
Herkimer, NY 13350
|
1,014 sq. feet
|
1 baths 3 beds |
$31,500
|
show details |

|
#4
County Highway 29a
Springfield Center, NY 13468
|
- sq. feet
|
2 baths 4 beds |
show details | |

|
#5
Hickling Rd
Edmeston, NY 13335
|
800 sq. feet
|
1 baths 2 beds |
show details | |

|
#6
Johnycake Rd
Mohawk, NY 13407
|
1,404 sq. feet
|
1 baths 3 beds |
show details | |

|
#7
State Route 5s
Little Falls, NY 13365
|
984 sq. feet
|
1 baths 3 beds |
show details | |

|
#8
County Highway 16
Hartwick, NY 13348
|
- sq. feet
|
1 baths 2 beds |
show details | |

|
#9
Shells Bush Rd
Herkimer, NY 13350
|
1,840 sq. feet
|
1 baths 3 beds |
show details | |

|
#10
Norton Rd
Frankfort, NY 13340
|
2,152 sq. feet
|
2 baths 3 beds |
show details |
| Photo | Address | Area | Beds / Baths | Price | Details |
|---|---|---|---|---|---|

|
#11
5th Avenue Ext
Frankfort, NY 13340
|
1,320 sq. feet
|
1 baths 3 beds |
show details | |

|
#12
Albany Rd
Clayville, NY 13322
|
1,502 sq. feet
|
2 baths 2 beds |
show details | |

|
#13
State Route 5
Frankfort, NY 13340
|
1,364 sq. feet
|
1 baths 3 beds |
show details | |

|
#14
Trolley Line Rd
Cooperstown, NY 13326
|
2,259 sq. feet
|
2 baths 3 beds |
show details | |

|
#15
Jerusalem Hill Rd
Clayville, NY 13322
|
1,139 sq. feet
|
1 baths 2 beds |
show details | |

|
#16
Highland Ave
Little Falls, NY 13365
|
1,404 sq. feet
|
1 baths 3 beds |
show details | |

|
#17
Skinner St
Little Falls, NY 13365
|
1,670 sq. feet
|
1 baths 4 beds |
show details | |

|
#18
State Route 5
Frankfort, NY 13340
|
1,317 sq. feet
|
1 baths 3 beds |
show details | |

|
#19
Southside Rd
Frankfort, NY 13340
|
1,652 sq. feet
|
2 baths 3 beds |
show details | |

|
#20
Watkins Rd
Frankfort, NY 13340
|
1,080 sq. feet
|
2 baths 3 beds |
show details |
| Photo | Address | Area | Beds / Baths | Price | Details |
|---|---|---|---|---|---|

|
#21
Hardscrabble Rd
Cassville, NY 13318
|
2,462 sq. feet
|
3 baths 5 beds |
show details | |

|
#22
Burwell St
Little Falls, NY 13365
|
1,480 sq. feet
|
2 baths 4 beds |
show details | |

|
#23
River Rd
Fort Plain, NY 13339
|
3,829 sq. feet
|
2 baths 6 beds |
show details | |

|
#24
Moreland St
Little Falls, NY 13365
|
1,302 sq. feet
|
1 baths 4 beds |
show details | |

|
#25
Ohara Rd
Little Falls, NY 13365
|
1,496 sq. feet
|
1 baths 3 beds |
show details | |

|
#26
Ritter Rd
Little Falls, NY 13365
|
6,400 sq. feet
|
2 baths 4 beds |
show details | |

|
#27
Charles St
Herkimer, NY 13350
|
1,092 sq. feet
|
1 baths 3 beds |
show details | |

|
#28
State Route 167
Little Falls, NY 13365
|
1,256 sq. feet
|
1 baths 3 beds |
show details | |

|
#29
S Richfield St
Mohawk, NY 13407
|
1,564 sq. feet
|
1 baths 3 beds |
show details | |

|
#30
Michigan St
Mohawk, NY 13407
|
1,800 sq. feet
|
2 baths 4 beds |
show details |
| Photo | Address | Area | Beds / Baths | Price | Details |
|---|---|---|---|---|---|

|
#31
Us Highway 20
West Winfield, NY 13491
|
1,456 sq. feet
|
2 baths 3 beds |
show details | |

|
#32
Ray St S
Ilion, NY 13357
|
2,224 sq. feet
|
2 baths 4 beds |
show details | |

|
#33
Us Highway 20
East Springfield, NY 13333
|
1,144 sq. feet
|
2 baths 3 beds |
show details | |

|
#34
Fairground Rd
West Winfield, NY 13491
|
1,408 sq. feet
|
1 baths 3 beds |
show details | |

|
#35
2nd St
Ilion, NY 13357
|
3,041 sq. feet
|
2 baths 4 beds |
show details | |

|
#36
Creek Rd
Little Falls, NY 13365
|
1,414 sq. feet
|
1 baths 2 beds |
show details | |

|
#37
William St # 1
Herkimer, NY 13350
|
2,008 sq. feet
|
2 baths 4 beds |
show details | |

|
#38
County Highway 18a
West Winfield, NY 13491
|
- sq. feet
|
- baths - beds |
show details | |

|
#39
Johnycake Rd
Mohawk, NY 13407
|
- sq. feet
|
- baths - beds |
show details | |

|
#40
County Highway 33
Cherry Valley, NY 13320
|
- sq. feet
|
- baths - beds |
show details |
| Photo | Address | Area | Beds / Baths | Price | Details |
|---|---|---|---|---|---|

|
#41
Albany St
Little Falls, NY 13365
|
- sq. feet
|
- baths - beds |
show details | |

|
#42
Burnwell St
Little Falls, NY 13365
|
- sq. feet
|
- baths - beds |
show details | |

|
#43
Burwell St
Little Falls, NY 13365
|
- sq. feet
|
- baths - beds |
show details | |

|
#44
Burnwell St
Little Falls, NY 13365
|
- sq. feet
|
- baths - beds |
show details | |

|
#45
Burwell St
Little Falls, NY 13365
|
- sq. feet
|
- baths - beds |
show details | |

|
#46
Munson Rd
West Winfield, NY 13491
|
- sq. feet
|
- baths - beds |
show details | |

|
#47
State Route 169
Little Falls, NY 13365
|
- sq. feet
|
- baths - beds |
show details | |

|
#48
Main St
Jordanville, NY 13361
|
- sq. feet
|
- baths - beds |
show details | |

|
#49
Campbell Rd
Sauquoit, NY 13456
|
- sq. feet
|
- baths - beds |
show details | |

|
Check over 1 million property listings on Foreclosure.com!
|
browse all offers | |||


- 1,07388.0%White alone
- 736.0%Hispanic
- 423.4%Two or more races
- 131.1%Black alone
- 60.5%Asian alone
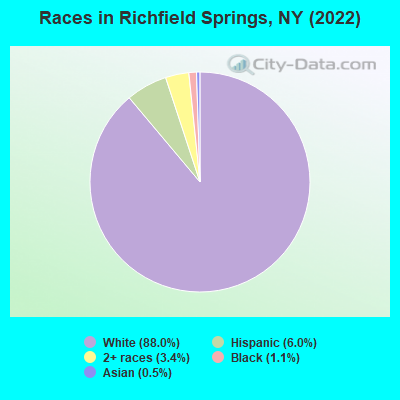
Races in Richfield Springs detailed stats: ancestries, foreign born residents, place of birth
According to our research of New York and other state lists, there were 6 registered sex offenders living in Richfield Springs, New York as of May 09, 2024.
The ratio of all residents to sex offenders in Richfield Springs is 187 to 1.
 Recent articles from our blog. Our writers, many of them Ph.D. graduates or candidates, create easy-to-read articles on a wide variety of topics.

 | smaller Upstate NY cities and towns/African American communities (5974 replies) |
| Graduation videos… (38 replies) |
| Downstate counties have highest rates of students in private schools. Check your district (3 replies) |
| Love/Hate about Herkimer? (10 replies) |
| Cooperstown NY area delis and resturants (4 replies) |
| Small towns in the Mohawk Valley (9 replies) |
Latest news from Richfield Springs, NY collected exclusively by city-data.com from local newspapers, TV, and radio stations
Ancestries: Irish (36.3%), English (11.4%), German (10.8%), American (6.1%), Italian (5.5%), European (2.3%).
Current Local Time: EST time zone
Elevation: 1315 feet
Land area: 1.00 square miles.
Population density: 1,097 people per square mile (low).
16 residents are foreign born
| This village: | 1.3% |
| New York: | 22.6% |
Median real estate property taxes paid for housing units with mortgages in 2022: $2,821 (2.3%)
Median real estate property taxes paid for housing units with no mortgage in 2022: $2,144 (1.6%)
Nearest city with pop. 50,000+: Utica, NY  (20.9 miles , pop. 60,651).
Nearest city with pop. 200,000+: Rochester, NY (134.5 miles , pop. 219,773).
Nearest city with pop. 1,000,000+: Bronx, NY (150.2 miles , pop. 1,332,650).
Nearest cities:
), ), ), ), ), ), )Latitude: 42.85 N, Longitude: 74.99 W
Area code: 315
| Here: | 4.7% |
| New York: | 4.4% |
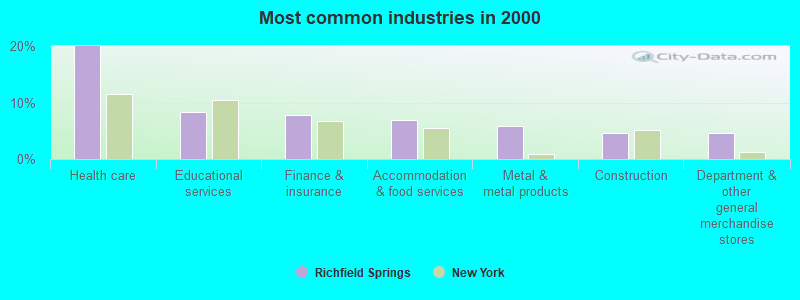
- Health care (20.0%)
- Educational services (8.3%)
- Finance & insurance (7.7%)
- Accommodation & food services (7.0%)
- Metal & metal products (5.9%)
- Construction (4.6%)
- Department & other general merchandise stores (4.6%)
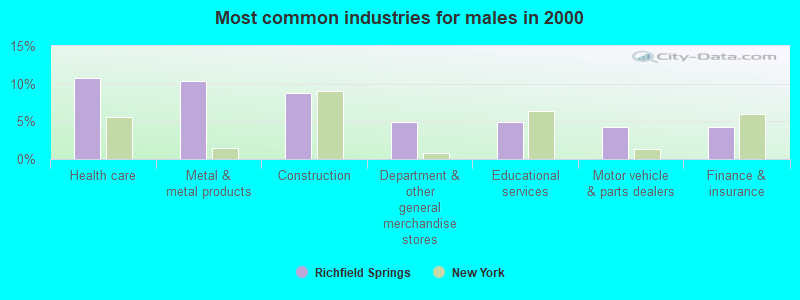
- Health care (10.7%)
- Metal & metal products (10.3%)
- Construction (8.8%)
- Department & other general merchandise stores (5.0%)
- Educational services (5.0%)
- Motor vehicle & parts dealers (4.2%)
- Finance & insurance (4.2%)
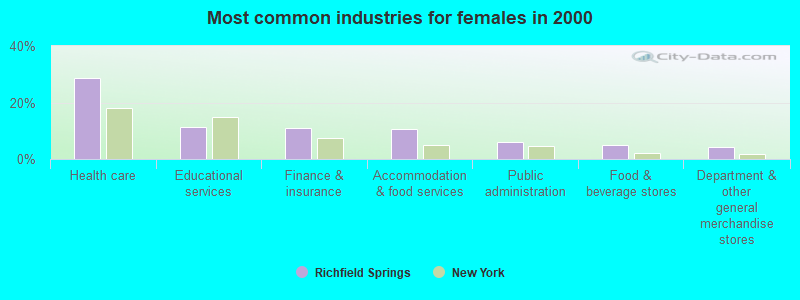
- Health care (28.6%)
- Educational services (11.3%)
- Finance & insurance (11.0%)
- Accommodation & food services (10.6%)
- Public administration (6.0%)
- Food & beverage stores (4.9%)
- Department & other general merchandise stores (4.2%)
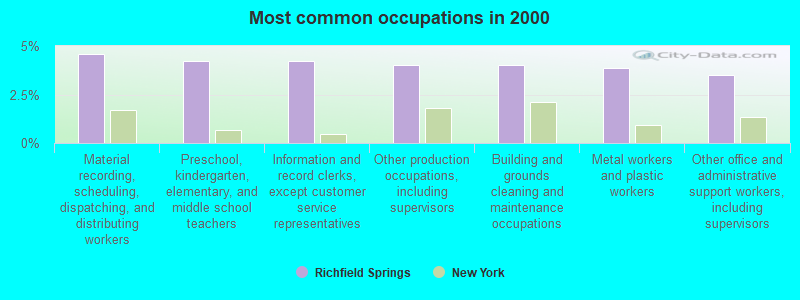
- Material recording, scheduling, dispatching, and distributing workers (4.6%)
- Preschool, kindergarten, elementary, and middle school teachers (4.2%)
- Information and record clerks, except customer service representatives (4.2%)
- Other production occupations, including supervisors (4.0%)
- Building and grounds cleaning and maintenance occupations (4.0%)
- Metal workers and plastic workers (3.9%)
- Other office and administrative support workers, including supervisors (3.5%)
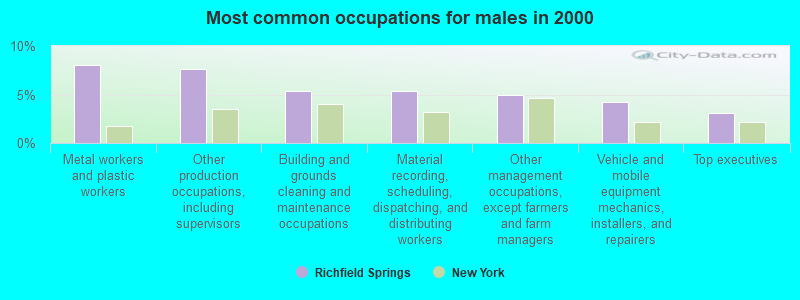
- Metal workers and plastic workers (8.0%)
- Other production occupations, including supervisors (7.6%)
- Building and grounds cleaning and maintenance occupations (5.3%)
- Material recording, scheduling, dispatching, and distributing workers (5.3%)
- Other management occupations, except farmers and farm managers (5.0%)
- Vehicle and mobile equipment mechanics, installers, and repairers (4.2%)
- Top executives (3.1%)
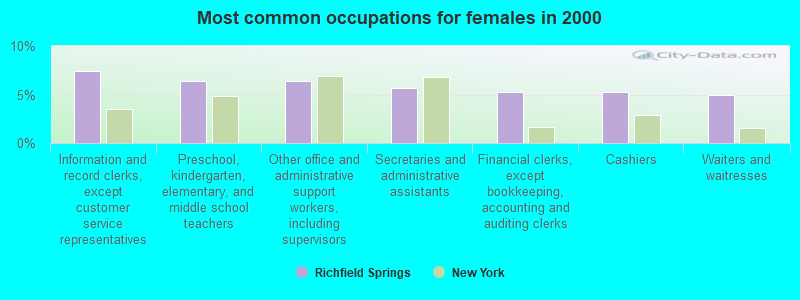
- Information and record clerks, except customer service representatives (7.4%)
- Preschool, kindergarten, elementary, and middle school teachers (6.4%)
- Other office and administrative support workers, including supervisors (6.4%)
- Secretaries and administrative assistants (5.7%)
- Financial clerks, except bookkeeping, accounting and auditing clerks (5.3%)
- Cashiers (5.3%)
- Waiters and waitresses (4.9%)
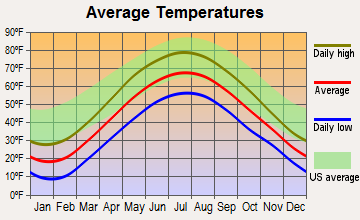
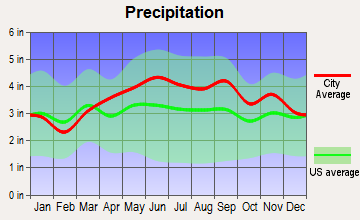
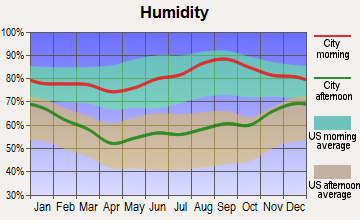
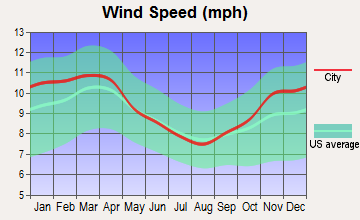
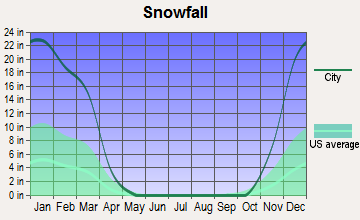
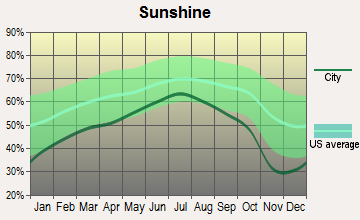
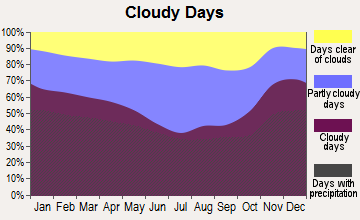
Average climate in Richfield Springs, New York
Based on data reported by over 4,000 weather stations
|
|

(lower is better)
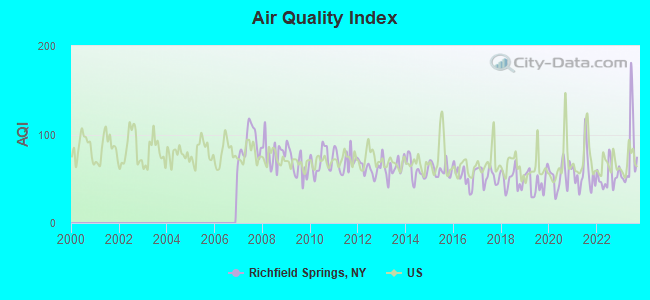
Air Quality Index (AQI) level in 2023 was 77.3. This is about average.
| City: | 77.3 |
| U.S.: | 72.6 |
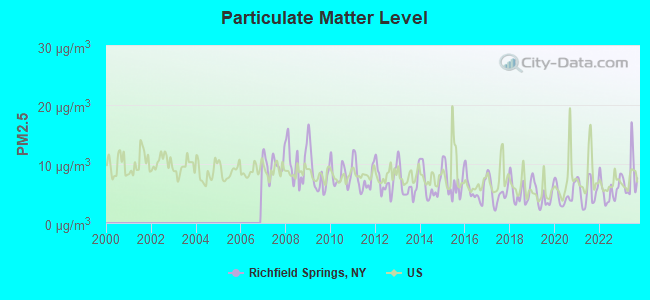
Particulate Matter (PM2.5) [µg/m3] level in 2023 was 7.86. This is about average. Closest monitor was 20.8 miles away from the city center.
| City: | 7.86 |
| U.S.: | 8.11 |
Tornado activity:
Richfield Springs-area historical tornado activity is slightly below New York state average. It is 69% smaller than the overall U.S. average.
On 7/10/1989, a category F4 (max. wind speeds 207-260 mph) tornado 23.3 miles away from the Richfield Springs village center injured 20 people and caused between $5,000,000 and $50,000,000 in damages.
On 5/31/1998, a category F3 (max. wind speeds 158-206 mph) tornado 19.1 miles away from the village center injured 3 people and caused $800,000 in damages.
Earthquake activity:
Richfield Springs-area historical earthquake activity is significantly above New York state average. It is 67% smaller than the overall U.S. average.On 10/7/1983 at 10:18:46, a magnitude 5.3 (5.1 MB, 5.3 LG, 5.1 ML, Class: Moderate, Intensity: VI - VII) earthquake occurred 82.7 miles away from Richfield Springs center
On 4/20/2002 at 10:50:47, a magnitude 5.3 (5.3 ML, Depth: 3.0 mi) earthquake occurred 131.7 miles away from the city center
On 4/20/2002 at 10:50:47, a magnitude 5.2 (5.2 MB, 4.2 MS, 5.2 MW, 5.0 MW) earthquake occurred 129.6 miles away from the city center
On 6/17/1991 at 08:53:16, a magnitude 4.1 (4.0 MB, 4.0 LG, Depth: 3.1 mi, Class: Light, Intensity: IV - V) earthquake occurred 22.0 miles away from Richfield Springs center
On 8/23/2011 at 17:51:04, a magnitude 5.8 (5.8 MW, Depth: 3.7 mi) earthquake occurred 375.5 miles away from the city center
On 1/19/1982 at 00:14:42, a magnitude 4.7 (4.5 MB, 4.7 MD, 4.5 LG) earthquake occurred 176.6 miles away from Richfield Springs center
Magnitude types: regional Lg-wave magnitude (LG), body-wave magnitude (MB), duration magnitude (MD), local magnitude (ML), surface-wave magnitude (MS), moment magnitude (MW)
Natural disasters:
The number of natural disasters in Otsego County (22) is greater than the US average (15).Major Disasters (Presidential) Declared: 13
Emergencies Declared: 7
Causes of natural disasters: Storms: 10, Floods: 8, Hurricanes: 3, Snowstorms: 2, Tropical Storms: 2, Blizzard: 1, Ice Storm: 1, Power Outage: 1, Tornado: 1, Wind: 1, Winter Storm: 1, Other: 2 (Note: some incidents may be assigned to more than one category).
Hospitals and medical centers near Richfield Springs:
- MARY IMOGENE BASSETT HOSPITAL (Dialysis Facility, about 12 miles away; COOPERSTOWN, NY)
- MOHAWK VALLEY GENERAL HOSPITAL (Hospital, about 12 miles away; ILION, NY)
- VALLEY HEALTH SERVICES INC (Nursing Home, about 12 miles away; HERKIMER, NY)
- FOLTS HOME (Nursing Home, about 12 miles away; HERKIMER, NY)
- FAXTON ST. LUKE'S HEALTHCARE - HERKIMER (Dialysis Facility, about 13 miles away; HERKIMER, NY)
- SUE CAMPAGNA HOSPICE OF HERKIMER CO (Hospital, about 13 miles away; HERKIMER, NY)
- HERKIMER CO PUBLIC HLTH CHHA (Home Health Center, about 13 miles away; HERKIMER, NY)
Airports located in Richfield Springs:
- Richfield Airport (NY68) (Runways: 1)
Colleges/universities with over 2000 students nearest to Richfield Springs:
- Herkimer County Community College (about 13 miles; Herkimer, NY; Full-time enrollment: 2,774)
- Mohawk Valley Community College (about 20 miles; Utica, NY; FT enrollment: 5,693)
- Utica College (about 23 miles; Utica, NY; FT enrollment: 2,952)
- SUNY Oneonta (about 28 miles; Oneonta, NY; FT enrollment: 6,081)
- SUNY College of Agriculture and Technology at Cobleskill (about 28 miles; Cobleskill, NY; FT enrollment: 2,455)
- Colgate University (about 28 miles; Hamilton, NY; FT enrollment: 3,094)
- Morrisville State College (about 32 miles; Morrisville, NY; FT enrollment: 2,823)
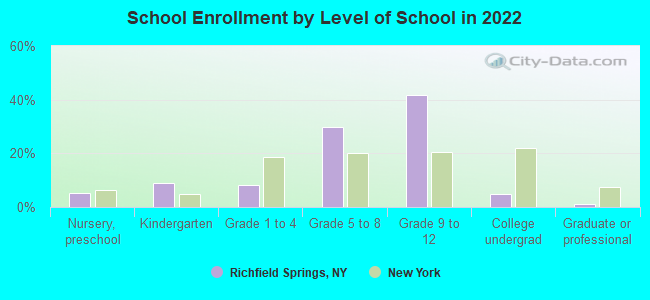
Public high school in Richfield Springs:
- RICHFIELD SPRINGS CENTRAL SCHOOL (Students: 583, Location: 93 MAIN ST, Grades: PK-12)
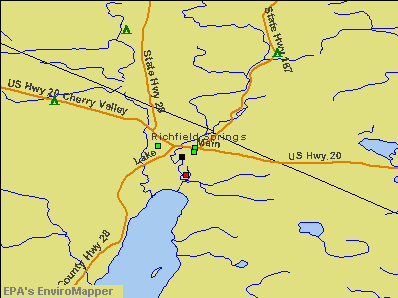
Points of interest:
Notable locations in Richfield Springs: Welcome Home for Adults (A), Terrace Hotel (B), Town of Richfield Garage (C), Richfield Springs Fire Department (D), Richfield Springs Public Library (E), Capitol Theatre (F), Tiller House (G), Gladstone Building (H). Display/hide their locations on the map
Churches in Richfield Springs include: Church of Christ Uniting (A), Richfield Springs Bible Church (B), First Presbyterian Church (C), Saint Joseph's Roman Catholic Church (D), Saint John's Episcopal Church (E). Display/hide their locations on the map
Cemeteries: Presbyterian Cemetery (1), Lakeview Cemetery (2). Display/hide their locations on the map
Park in Richfield Springs: Cary Park (1). Display/hide its location on the map
Birthplace of: Norman Jay Coleman - Newspaper publisher.
Drinking water stations with addresses in Richfield Springs that have no violations reported:
| This village: | 2.1 people |
| New York: | 2.6 people |
| This village: | 56.0% |
| Whole state: | 63.5% |
| This village: | 10.0% |
| Whole state: | 6.8% |
Likely homosexual households (counted as self-reported same-sex unmarried-partner households)
- Lesbian couples: 0.2% of all households
- Gay men: 0.5% of all households
13 people in other nonhousehold living situations in 2000
Banks with branches in Richfield Springs (2011 data):
- NBT Bank, National Association: Richfield Springs Branch at 194 Main Street, branch established on 1974/12/02. Info updated 2012/02/02: Bank assets: $5,558.5 mil, Deposits: $4,381.4 mil, headquarters in Norwich, NY, positive income, Commercial Lending Specialization, 133 total offices, Holding Company: Nbt Bancorp Inc.
For population 15 years and over in Richfield Springs:
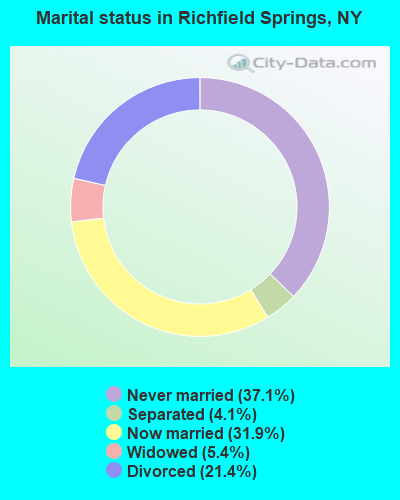
- Never married: 37.1%
- Now married: 31.9%
- Separated: 4.1%
- Widowed: 5.4%
- Divorced: 21.4%
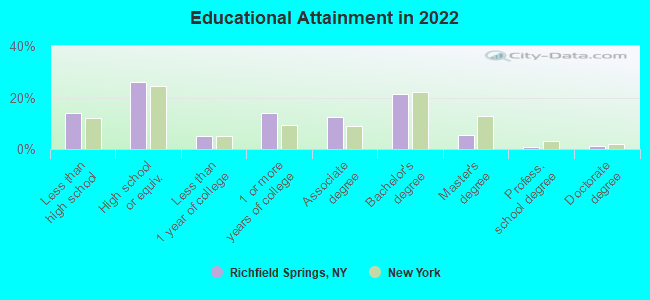
For population 25 years and over in Richfield Springs:
- High school or higher: 84.8%
- Bachelor's degree or higher: 27.5%
- Graduate or professional degree: 7.4%
- Unemployed: 10.5%
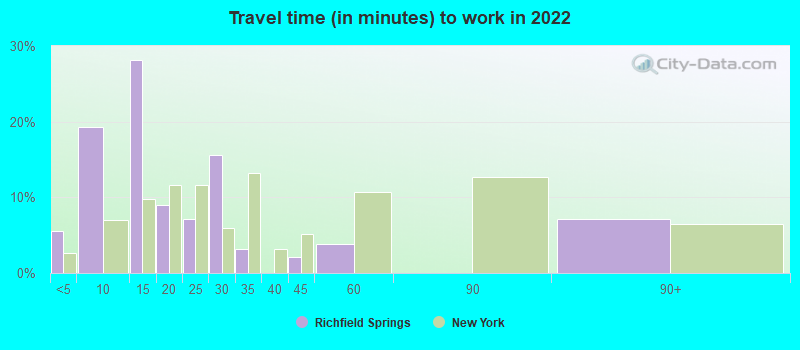
- Mean travel time to work (commute): 23.2 minutes
| Here: | 9.8 |
| New York average: | 13.9 |
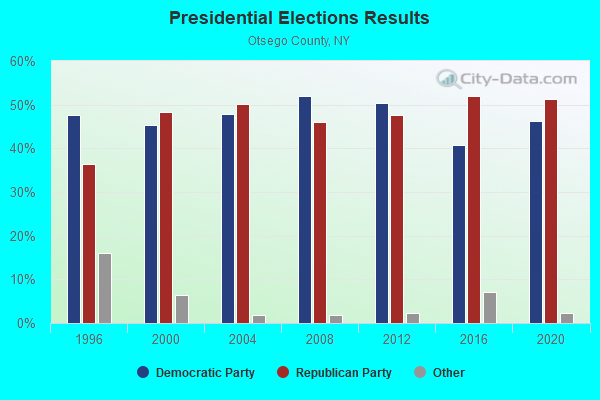
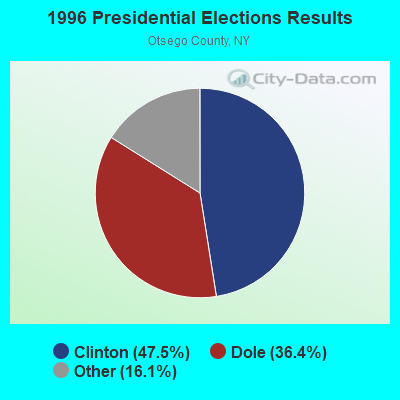
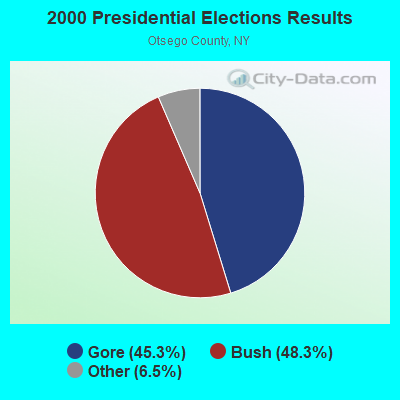
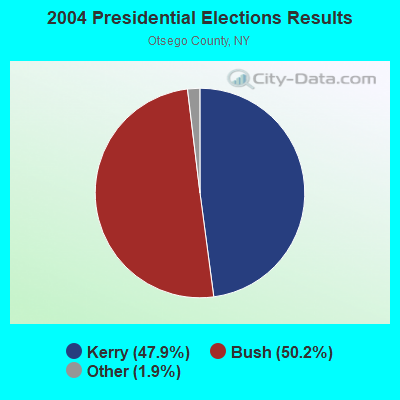
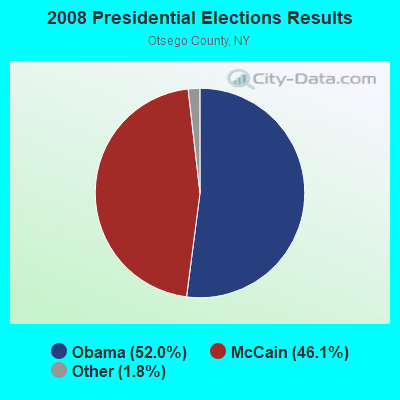
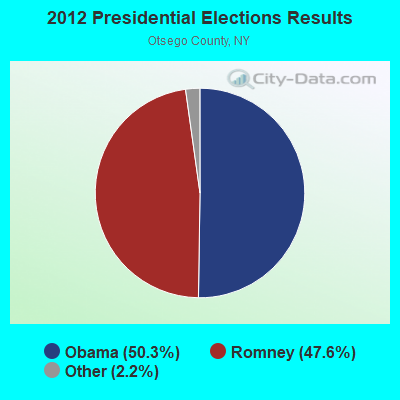
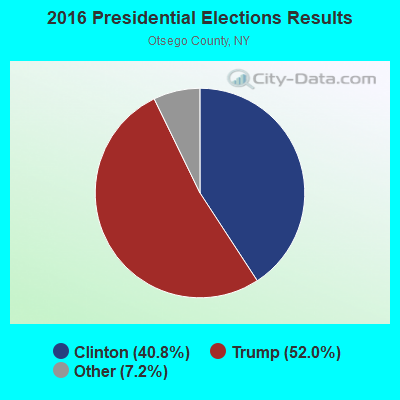
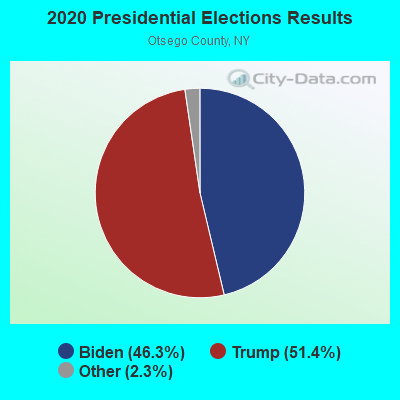
Graphs represent county-level data. Detailed 2008 Election Results
Political contributions by individuals in Richfield Springs, NY
Religion statistics for Richfield Springs, NY (based on Otsego County data)
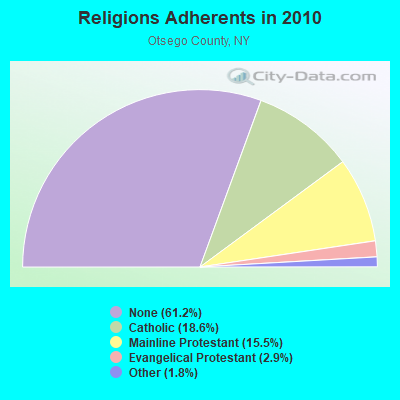
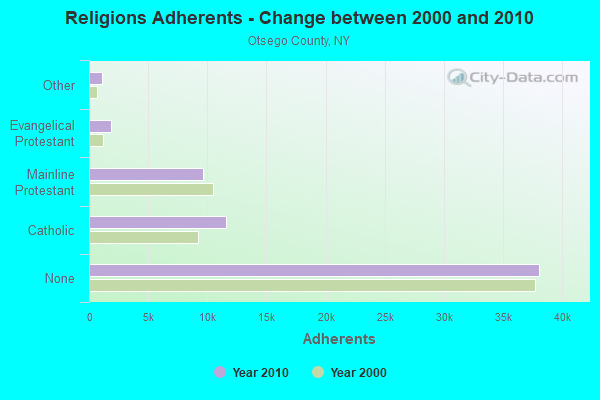
| Religion | Adherents | Congregations |
|---|---|---|
| Catholic | 11,599 | 6 |
| Mainline Protestant | 9,637 | 69 |
| Evangelical Protestant | 1,829 | 26 |
| Other | 1,094 | 9 |
| Orthodox | 25 | 1 |
| None | 38,075 | - |
Food Environment Statistics:
| Here: | 2.89 / 10,000 pop. |
| State: | 4.13 / 10,000 pop. |
| Otsego County: | 0.32 / 10,000 pop. |
| State: | 0.06 / 10,000 pop. |
| Otsego County: | 0.96 / 10,000 pop. |
| State: | 0.92 / 10,000 pop. |
| Otsego County: | 5.62 / 10,000 pop. |
| New York: | 1.68 / 10,000 pop. |
| This county: | 9.96 / 10,000 pop. |
| New York: | 8.82 / 10,000 pop. |
| Otsego County: | 7.7% |
| State: | 8.2% |
| Here: | 24.6% |
| New York: | 23.8% |
| Otsego County: | 15.6% |
| New York: | 15.6% |
Health and Nutrition:
| This city: | 55.6% |
| New York: | 50.1% |
| This city: | 54.7% |
| State: | 48.1% |
| Richfield Springs: | 28.3 |
| New York: | 28.5 |
| Here: | 22.0% |
| New York: | 20.3% |
| Richfield Springs: | 13.4% |
| New York: | 11.1% |
| Richfield Springs: | 7.1 |
| New York: | 6.8 |
| This city: | 39.3% |
| New York: | 33.4% |
| This city: | 58.9% |
| State: | 56.5% |
| This city: | 79.4% |
| New York: | 80.2% |
More about Health and Nutrition of Richfield Springs, NY Residents
| Local government employment and payroll (March 2022) | |||||
| Function | Full-time employees | Monthly full-time payroll | Average yearly full-time wage | Part-time employees | Monthly part-time payroll |
|---|---|---|---|---|---|
| Streets and Highways | 5 | $20,628 | $49,507 | 0 | $0 |
| Water Supply | 1 | $5,292 | $63,504 | 0 | $0 |
| Sewerage | 1 | $4,333 | $51,996 | 0 | $0 |
| Financial Administration | 1 | $1,964 | $23,568 | 0 | $0 |
| Local Libraries | 1 | $2,556 | $30,672 | 1 | $1,550 |
| Health | 0 | $0 | 1 | $1,451 | |
| Judicial and Legal | 0 | $0 | 2 | $1,306 | |
| Other Government Administration | 0 | $0 | 8 | $824 | |
| Totals for Government | 9 | $34,772 | $46,363 | 12 | $5,131 |
Richfield Springs government finances - Expenditure in 2017 (per resident):
- Current Operations - Sewerage: $176,000 ($161.02)
Regular Highways: $170,000 ($155.54)
General - Other: $144,000 ($131.75)
Water Utilities: $143,000 ($130.83)
Local Fire Protection: $82,000 ($75.02)
Central Staff Services: $67,000 ($61.30)
Libraries: $52,000 ($47.58)
Financial Administration: $24,000 ($21.96)
Judicial and Legal Services: $23,000 ($21.04)
General Public Buildings: $17,000 ($15.55)
Parks and Recreation: $16,000 ($14.64)
Protective Inspection and Regulation - Other: $6,000 ($5.49)
Police Protection: $5,000 ($4.57)
Health - Other: $4,000 ($3.66)
Natural Resources - Other: $2,000 ($1.83)
- General - Interest on Debt: $53,000 ($48.49)
- Intergovernmental to Local - Other - Financial Administration: $4,000 ($3.66)
- Other Capital Outlay - Regular Highways: $96,000 ($87.83)
Water Utilities: $89,000 ($81.43)
Local Fire Protection: $12,000 ($10.98)
General Public Building: $8,000 ($7.32)
- Total Salaries and Wages: $346,000 ($316.56)
Richfield Springs government finances - Revenue in 2017 (per resident):
- Charges - Sewerage: $292,000 ($267.15)
Other: $43,000 ($39.34)
- Local Intergovernmental - Other: $104,000 ($95.15)
General Local Government Support: $56,000 ($51.24)
- Miscellaneous - Rents: $22,000 ($20.13)
Fines and Forfeits: $17,000 ($15.55)
Interest Earnings: $15,000 ($13.72)
Special Assessments: $8,000 ($7.32)
General Revenue - Other: $1,000 ($0.91)
- Revenue - Water Utilities: $176,000 ($161.02)
- State Intergovernmental - Highways: $45,000 ($41.17)
General Local Government Support: $12,000 ($10.98)
Other: $5,000 ($4.57)
- Tax - Property: $529,000 ($483.99)
Public Utilities Sales: $20,000 ($18.30)
Other License: $4,000 ($3.66)
Richfield Springs government finances - Debt in 2017 (per resident):
- Long Term Debt - Beginning Outstanding - Unspecified Public Purpose: $2,235,000 ($2044.83)
Outstanding Unspecified Public Purpose: $2,127,000 ($1946.02)
Retired Unspecified Public Purpose: $108,000 ($98.81)
Richfield Springs government finances - Cash and Securities in 2017 (per resident):
- Other Funds - Cash and Securities: $2,191,000 ($2004.57)
Businesses in Richfield Springs, NY
- McDonald's: 1
- Subway: 1
- U-Haul: 1
Strongest AM radio stations in Richfield Springs:
- WGY (810 AM; 50 kW; SCHENECTADY, NY; Owner: CLEAR CHANNEL BROADCASTING LICENSES, INC.)
- WPTR (1540 AM; 50 kW; ALBANY, NY; Owner: KIMTRON, INC.)
- WTLB (1310 AM; 5 kW; UTICA, NY; Owner: GALAXY COMMUNICATIONS, L.P.)
- WIBX (950 AM; 5 kW; UTICA, NY; Owner: REGENT LICENSEE OF UTICA/ROME, INC.)
- WRUN (1150 AM; 5 kW; UTICA, NY)
- WNNZ (640 AM; 50 kW; WESTFIELD, MA; Owner: CLEAR CHANNEL BROADCASTING LICENSES, INC.)
- WLFH (1230 AM; 1 kW; LITTLE FALLS, NY; Owner: CLEAR CHANNEL BROADCASTING LICENSES, INC.)
- WMCA (570 AM; 50 kW; NEW YORK, NY; Owner: SALEM MEDIA OF NEW YORK, LLC)
- WNRS (1420 AM; 1 kW; HERKIMER, NY; Owner: ARJUNA BROADCASTING CORP.)
- WFAN (660 AM; 50 kW; NEW YORK, NY; Owner: INFINITY BROADCASTING OPERATIONS, INC.)
- WABC (770 AM; 50 kW; NEW YORK, NY; Owner: WABC-AM RADIO, INC.)
- WOR (710 AM; 50 kW; NEW YORK, NY; Owner: BUCKLEY BROADCASTING CORPORATION)
- WADR (1480 AM; 5 kW; REMSEN, NY; Owner: CLEAR CHANNEL BROADCASTING LICENSES, INC.)
Strongest FM radio stations in Richfield Springs:
- WJIV (101.9 FM; CHERRY VALLEY, NY; Owner: CHRISTIAN BROADCASTING SYSTEM, LTD.)
- WSKU (105.5 FM; LITTLE FALLS, NY; Owner: CLEAR CHANNEL BROADCASTING LICENSES, INC.)
- WBUG-FM (101.1 FM; FORT PLAIN, NY; Owner: ROSER COMMUNICATIONS NETWORK, INC.)
- WOUR (96.9 FM; UTICA, NY; Owner: CLEAR CHANNEL BROADCASTING LICENSES, INC.)
- WBGK (99.7 FM; NEWPORT VILLAGE, NY; Owner: ROSER COMMUNICATIONS NETWORK, INC.)
- WUNY (89.5 FM; UTICA, NY; Owner: PUBLIC BC COUNCIL OF CENTRAL NY, INC)
- WKVU (100.7 FM; UTICA, NY; Owner: EDUCATIONAL MEDIA FOUNDATION)
- WGKR (105.3 FM; GRAND GORGE, NY; Owner: SOUND OF LIFE, INC.)
- WLZW (98.7 FM; UTICA, NY; Owner: REGENT LICENSEE OF UTICA/ROME, INC.)
- WKLL (94.9 FM; FRANKFORT, NY; Owner: GALAXY COMMUNICATIONS, L.P.)
- WSKS (97.9 FM; WHITESBORO, NY; Owner: CLEAR CHANNEL BROADCASTING LICENSES, INC.)
- WXUR (92.7 FM; HERKIMER, NY; Owner: ARJUNA BROADCASTING CORP.)
- WRBY (102.5 FM; ROME, NY; Owner: CLEAR CHANNEL BROADCASTING LICENSES, INC.)
- WRCK (107.3 FM; UTICA, NY; Owner: GALAXY COMMUNICATIONS, L.P.)
- WFRG-FM (104.3 FM; UTICA, NY; Owner: REGENT LICENSEE OF UTICA/ROME, INC.)
- WDHI (100.3 FM; DELHI, NY; Owner: BANJO COMMUNICATIONS GROUP, INC.)
- WMYY (97.3 FM; SCHOHARIE, NY; Owner: CAPITAL MEDIA CORPORATION)
- WQBJ (103.5 FM; COBLESKILL, NY; Owner: REGENT LICENSEE OF MANSFIELD, INC.)
- WUCL (93.5 FM; REMSEN, NY; Owner: CLEAR CHANNEL BROADCASTING LICENSES, INC.)
- WBKT (95.3 FM; NORWICH, NY; Owner: BANJO COMMUNICATIONS GROUP, INC)
TV broadcast stations around Richfield Springs:
- WKTV (Channel 2; UTICA, NY; Owner: SMITH TELEVISION OF NEW YORK LICENSE HOLDINGS, INC.)
- WFXV (Channel 33; UTICA, NY; Owner: QUORUM OF UTICA LICENSE, LLC)
- W59AU (Channel 59; UTICA, NY; Owner: PUBLIC B/CING.COUNCIL,CENTRAL N. Y.)
- W31BP (Channel 31; BURLINGTON, ETC., NY; Owner: QUORUM OF UTICA LICENSE, LLC)
- WUTR (Channel 20; UTICA, NY; Owner: CENTRAL NY NEWS, INC.)
- WPNY-LP (Channel 11; UTICA, ETC., NY; Owner: QUORUM OF UTICA LICENSE, LLC)
- W29BJ (Channel 29; BURLINGTON, NY; Owner: KEVIN O'KANE)
- W53AM (Channel 53; UTICA, NY; Owner: QUORUM OF UTICA LICENSE, LLC)
- Richfield Springs, New York
- Fatal accident count14
- Vehicles involved in fatal accidents20
- Fatal accidents involving drunk persons:3
- Fatalities15
- Persons involved in fatal accidents31
- Pedestrians involved in fatal accidents2
- New York average
- Fatal accident count12800
- Vehicles involved in fatal accidents19037
- Fatal accidents involving drunk persons2783
- Fatalities13879
- Persons involved in fatal accidents31841
- Pedestrians involved in fatal accidents4282
- National Bridge Inventory (NBI) Statistics
- 6Number of bridges
- 20ft / 6.1mTotal length
- $3,752,000Total costs
- 6,361Total average daily traffic
- 521Total average daily truck traffic
- 6,778Total future (year 2037) average daily traffic
FCC Registered Cell Phone Towers:
2- 192 Millstone Road (98286) (Lat: 42.856444 Lon: -74.964833), Type: Ltower, Structure height: 55.2 m, Overall height: 57.9 m, Call Sign: KNKA468
Assigned Frequencies: 869.040 MHz, 869.040 MHz, 869.040 MHz, 824.040 MHz, 824.040 MHz, 824.040 MHz, 890.010 MHz, 890.010 MHz, 890.010 MHz, 845.010 MHz, 845.010 MHz, 845.010 MHzGrant Date: 09/07/2016, Expiration Date: 10/01/2026, Certifier: David C JatlowRegistrant: At&t Services, Inc., 208 S Akard St, 20f, Dallas, TX 75202, Phone: (855) 699-7073, Fax: (214) 746-6410, Email:
- 2.6 Miles North Of The Intersection Of Routes 20 And 28 (Lat: 42.892417 Lon: -75.017361), Type: Tower, Structure height: 30.5 m, Overall height: 32.9 m, Call Sign: KNKN999
Assigned Frequencies: 880.020 MHz, 835.020 MHz, 891.510 MHz, 846.510 MHzGrant Date: 09/01/2020, Expiration Date: 10/01/2030Registrant: Verizon Wireless, 5055 North Point Pkwy, Np2ne Network Engineering, Alpharetta, GA 30022, Phone: (770) 797-1070, Fax: (770) 797-1036, Email:
FCC Registered Antenna Towers:
3- Sean O'Malley, 192 Millstone Road (Lat: 42.856444 Lon: -74.964833), Type: 60.6, Overall height: 60.6 m, Registrant: Faa/Fcc Compliance Specialist, Bosto-n, Phone: (617) 585-7600
- Sean O'Malley, 192 Millstone Road (Lat: 42.856444 Lon: -74.964833), Type: 60.6, Overall height: 60.6 m, Registrant: Faa/Fcc Compliance Specialist, Bosto-n, Phone: (617) 585-7600
- Tim McDougall, 192 Millstone Road (Lat: 42.856444 Lon: -74.964833), Type: 60.6, Overall height: 60.6 m, Registrant: American Towers, Inc., Bosto-n, Phone: (617) 585-7600
FCC Registered Broadcast Land Mobile Towers:
2- Corner Of E James & Manley St (Lat: 42.851194 Lon: -74.982111), Call Sign: KNAW751,
Assigned Frequencies: 46.4400 MHz, Grant Date: 08/11/2011, Expiration Date: 11/05/2021, Cancellation Date: 01/08/2022, Registrant: Otsego County 911 Communications, 172 County Highway 33w, Cooperstown, NY 13326, Phone: (607) 547-7530, Fax: (607) 547-7529, Email:
- Mower Rd (Lat: 42.864250 Lon: -75.056556), Structure height: 18 m, Call Sign: WPAK258,
Assigned Frequencies: 453.050 MHz, Grant Date: 06/05/1997, Expiration Date: 08/27/2002, Cancellation Date: 12/29/2002, Registrant: Richfield, Town Of, Hwy Dept Alex Shields Supervisor, Richfield Springs, NY 13439, Phone: (315) 858-2830
FCC Registered Microwave Towers:
1- COLUMBIA CTR, Dropp Road (Lat: 42.892417 Lon: -75.017361), Type: Tower, Structure height: 32.9 m, Call Sign: WQPT749,
Assigned Frequencies: 6226.89 MHz, Grant Date: 08/14/2012, Expiration Date: 08/14/2022, Cancellation Date: 01/17/2014, Certifier: Pamelia Y Hoof, Registrant: Verizon Wireless, 1120 Sanctuary Pkwy, #150 Gasa5reg, Alpharetta, GA 30009-7630, Phone: (770) 797-1070, Fax: (770) 797-1036, Email:
FCC Registered Amateur Radio Licenses:
27 (See the full list of FCC Registered Amateur Radio Licenses in Richfield Springs)FAA Registered Aircraft:
5- Aircraft: AERONCA 7CCM (Category: Land, Seats: 2, Weight: Up to 12,499 Pounds, Speed: 90 mph), Engine: CONT MOTOR C90 SERIES (95 HP) (Reciprocating)
N-Number: 4586E, N4586E, N-4586E, Serial Number: 7CCM-158, Year manufactured: 1949, Airworthiness Date: 06/29/1999, Certificate Issue Date: 11/17/2018
Registrant (Individual): James A Ainslie, 206 Ainslie Rd, Richfield Springs, NY 13439 - Aircraft: CONNER CGS HAWK ARROW PLUS (Category: Land, Seats: 2, Weight: Up to 12,499 Pounds), Engine: ROTAX 503 SERIES (52 HP) (2 Cycle)
N-Number: 50469, N50469, N-50469, Serial Number: 0535, Year manufactured: 2000, Airworthiness Date: 07/23/2007, Certificate Issue Date: 02/02/2015
Registrant (Individual): Timothy J Downing, 467 Earl Rd, Richfield Springs, NY 13439 - Aircraft: AINSLIE JAMES A KITFOX III (Category: Land, Seats: 2, Weight: Up to 12,499 Pounds), Engine: BOMBARDIER ROTAX (ALL) (Reciprocating)
N-Number: 887F, N887F, N-887F, Serial Number: 887, Year manufactured: 2000, Airworthiness Date: 07/26/2000, Certificate Issue Date: 03/14/2002
Registrant (Individual): James A Ainslie, 206 Ainslie Rd, Richfield Springs, NY 13439 - Aircraft: MOONEY M20E (Category: Land, Seats: 4, Weight: Up to 12,499 Pounds, Speed: 127 mph), Engine: LYCOMING I0360 SER (180 HP) (Reciprocating)
N-Number: 9254M, N9254M, N-9254M, Serial Number: 1201, Year manufactured: 1966, Airworthiness Date: 06/23/1966, Certificate Issue Date: 08/09/2007
Registrant (Individual): Nikita Grigoriev, Po Box 1410, Richfield Springs, NY 13439 - Aircraft: PATRICIA L BURNEY KITFOX MODEL 4-1200 (Category: Land, Seats: 2, Weight: Up to 12,499 Pounds), Engine: 4 Cycle
N-Number: 115PB, N115PB, N-115PB, Serial Number: ASC-201, Certificate Issue Date: 03/05/2015
Registrant (Individual): Patricia L Burney, Po Box 341, Richfield Springs, NY 13439
| Most common first names in Richfield Springs, NY among deceased individuals | ||
| Name | Count | Lived (average) |
|---|---|---|
| John | 60 | 74.5 years |
| Mary | 40 | 83.0 years |
| William | 35 | 76.2 years |
| George | 25 | 74.7 years |
| Robert | 24 | 75.5 years |
| James | 22 | 67.6 years |
| Anna | 18 | 82.5 years |
| Joseph | 17 | 69.4 years |
| Charles | 17 | 79.8 years |
| Dorothy | 16 | 76.0 years |
| Most common last names in Richfield Springs, NY among deceased individuals | ||
| Last name | Count | Lived (average) |
|---|---|---|
| Smith | 17 | 79.4 years |
| Robinson | 10 | 80.3 years |
| Palmer | 9 | 77.8 years |
| Brown | 8 | 76.7 years |
| Armstrong | 8 | 80.1 years |
| Young | 7 | 79.9 years |
| Willsey | 7 | 78.6 years |
| Hugick | 7 | 81.4 years |
| Domion | 7 | 78.1 years |
| Seamon | 7 | 73.6 years |
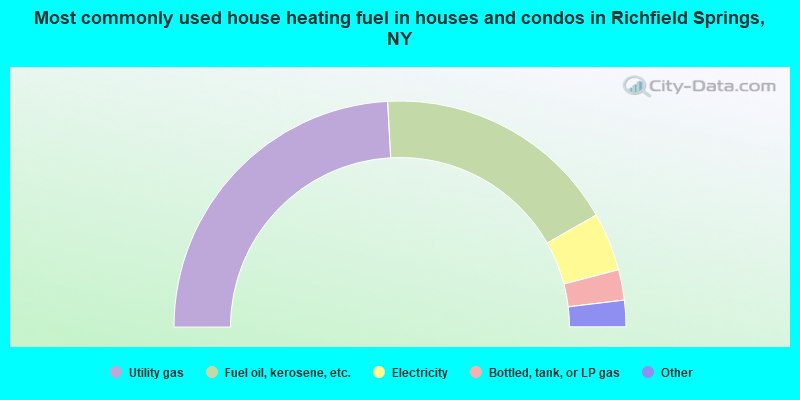
- 48.6%Utility gas
- 35.5%Fuel oil, kerosene, etc.
- 8.4%Electricity
- 4.4%Bottled, tank, or LP gas
- 2.0%Other fuel
- 1.2%Wood
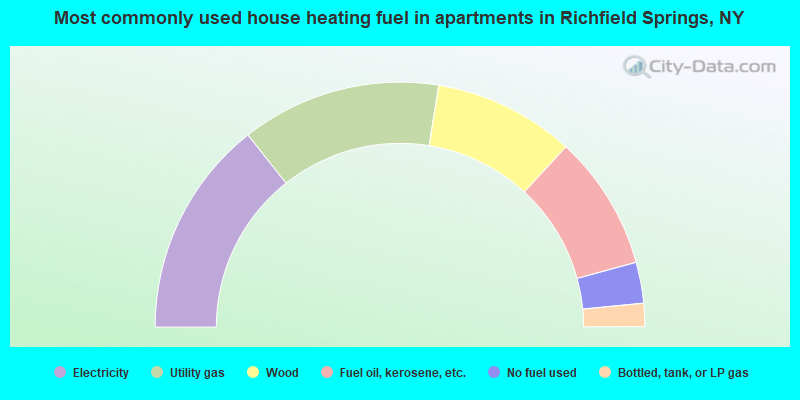
- 28.7%Electricity
- 26.4%Utility gas
- 18.6%Wood
- 17.8%Fuel oil, kerosene, etc.
- 5.4%No fuel used
- 3.1%Bottled, tank, or LP gas
Richfield Springs compared to New York state average:
- Median house value significantly below state average.
- Black race population percentage significantly below state average.
- Hispanic race population percentage significantly below state average.
- Median age above state average.
- Foreign-born population percentage significantly below state average.
- Length of stay since moving in above state average.
- Number of rooms per house above state average.
- Number of college students significantly below state average.
Richfield Springs on our top lists:
- #10 on the list of "Top 101 cities with the most residents born in Malaysia (population 500+)"
- #92 on the list of "Top 101 cities with the most residents born in Russia (population 500+)"
- #93 on the list of "Top 101 cities with the largest percentage of people in other nonhousehold living situations (population 1,000+)"
- #49 on the list of "Top 101 counties with the lowest total withdrawal of fresh water for public supply (pop. 50,000+)"
- #75 on the list of "Top 101 counties with the lowest surface withdrawal of fresh water for public supply (pop. 50,000+)"

|
Total of 8 patent applications in 2008-2024.