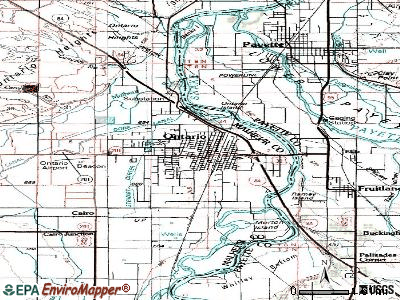
Ontario, Oregon
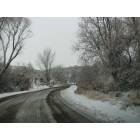
Ontario: Peterson Road just outside Ontario
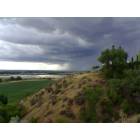
Ontario: Summer Storm over Ontario
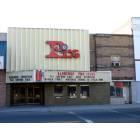
Ontario: The Old Pix Theatre: The past peeking out
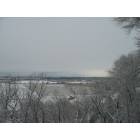
Ontario: City of Ontario from Ontario Heights
- add
your
Submit your own pictures of this city and show them to the world
- OSM Map
- General Map
- Google Map
- MSN Map
Population change since 2000: +6.8%
 |
| Males: 5,624 | |
| Females: 6,108 |
| Median resident age: | 35.4 years |
| Oregon median age: | 40.5 years |
Zip codes: 97914.
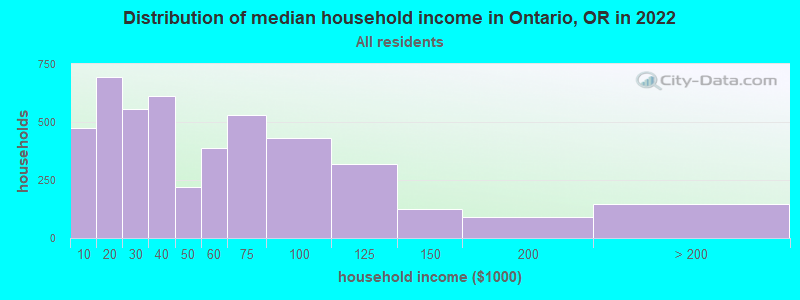
| Ontario: | $39,244 |
| OR: | $75,657 |
Estimated per capita income in 2022: $23,444 (it was $14,683 in 2000)
Ontario city income, earnings, and wages data
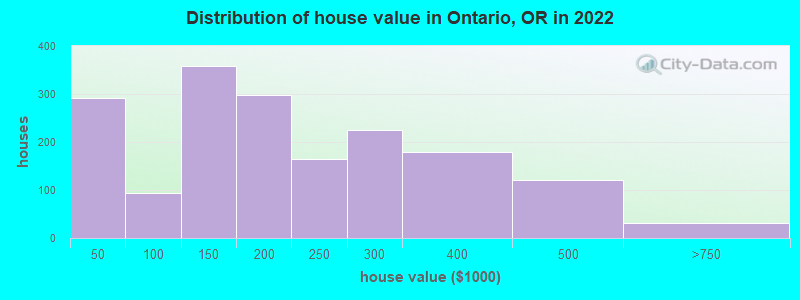
Estimated median house or condo value in 2022: $196,602 (it was $85,900 in 2000)
| Ontario: | $196,602 |
| OR: | $475,600 |
Mean prices in 2022: all housing units: $194,314; detached houses: $219,229; townhouses or other attached units: $270,037; in 2-unit structures: $287,973; mobile homes: $37,314
Median gross rent in 2022: $737.
(24.1% for White Non-Hispanic residents, 100.0% for Black residents, 18.9% for Hispanic or Latino residents, 21.8% for American Indian residents, 22.1% for other race residents, 5.2% for two or more races residents)
Detailed information about poverty and poor residents in Ontario, OR

Compare current foreclosures near Ontario, OR:
| Photo | Address | Area | Beds / Baths | Price | Details |
|---|---|---|---|---|---|

|
#1
SW 12th Ave
Ontario, OR 97914
|
3,067 sq. feet
|
3 baths 5 beds |
show details | |

|
#2
SW 9th Ave
Ontario, OR 97914
|
1,472 sq. feet
|
2 baths 3 beds |
show details | |

|
#3
N Verde Dr
Ontario, OR 97914
|
2,201 sq. feet
|
2 baths 3 beds |
show details | |

|
#4
W Idaho Ave
Ontario, OR 97914
|
1,068 sq. feet
|
- baths - beds |
show details | |

|
#5
Douglas Rd
Ontario, OR 97914
|
- sq. feet
|
- baths - beds |
show details | |

|
#6
Crest Way
Ontario, OR 97914
|
- sq. feet
|
- baths - beds |
show details | |

|
#7
SE 13th Ave
Ontario, OR 97914
|
700 sq. feet
|
- baths - beds |
show details | |

|
#8
Loveridge Dr
Ontario, OR 97914
|
1,460 sq. feet
|
- baths - beds |
show details | |

|
#9
SW 14th Ave
Ontario, OR 97914
|
- sq. feet
|
- baths - beds |
show details | |

|
#10
W Idaho Ave
Ontario, OR 97914
|
- sq. feet
|
- baths - beds |
show details |
| Photo | Address | Area | Beds / Baths | Price | Details |
|---|---|---|---|---|---|

|
#11
SW 11th St
Ontario, OR 97914
|
2,016 sq. feet
|
- baths - beds |
show details | |

|
#12
Fortner St, Apt 31
Ontario, OR 97914
|
- sq. feet
|
- baths - beds |
show details | |

|
#13
SW 1st Ave
Ontario, OR 97914
|
1,252 sq. feet
|
- baths - beds |
show details | |

|
#14
NW 3rd St
Ontario, OR 97914
|
- sq. feet
|
- baths - beds |
show details | |

|
#15
Bellows Dr
Ontario, OR 97914
|
1,937 sq. feet
|
- baths - beds |
show details | |

|
#16
Laurel Dr
Ontario, OR 97914
|
- sq. feet
|
- baths - beds |
show details | |

|
#17
N 6th St
Nyssa, OR 97913
|
1,050 sq. feet
|
- baths - beds |
show details | |

|
#18
Pearl Rd
Parma, ID 83660
|
- sq. feet
|
- baths - beds |
show details | |

|
#19
N 6th St
Nyssa, OR 97913
|
- sq. feet
|
- baths - beds |
show details | |

|
#20
Ehrgood Ave
Nyssa, OR 97913
|
1,344 sq. feet
|
- baths - beds |
show details |
| Photo | Address | Area | Beds / Baths | Price | Details |
|---|---|---|---|---|---|

|
#21
Augusta Ave
Payette, ID 83661
|
- sq. feet
|
- baths - beds |
show details | |

|
#22
NW 16th St
Fruitland, ID 83619
|
- sq. feet
|
- baths - beds |
show details | |

|
#23
C St W
Vale, OR 97918
|
1,042 sq. feet
|
- baths - beds |
show details | |

|
#24
S 12th St Apt 206
Payette, ID 83661
|
- sq. feet
|
- baths - beds |
show details | |

|
#25
W Butterfield St
Weiser, ID 83672
|
- sq. feet
|
- baths - beds |
show details | |

|
#26
N 4th St, Trlr 9
Parma, ID 83660
|
- sq. feet
|
- baths - beds |
show details | |

|
#27
Emison Ave
Nyssa, OR 97913
|
900 sq. feet
|
- baths - beds |
show details | |

|
#28
NW 3rd St
Fruitland, ID 83619
|
- sq. feet
|
- baths - beds |
show details | |

|
#29
Shelley Dr
Payette, ID 83661
|
- sq. feet
|
- baths - beds |
show details | |

|
#30
N River Rd
Payette, ID 83661
|
- sq. feet
|
- baths - beds |
show details |
| Photo | Address | Area | Beds / Baths | Price | Details |
|---|---|---|---|---|---|

|
#31
N 6th St
Payette, ID 83661
|
- sq. feet
|
- baths - beds |
show details | |

|
#32
3rd Ave S
Payette, ID 83661
|
- sq. feet
|
- baths - beds |
show details | |

|
#33
S Pennsylvania Ave
Fruitland, ID 83619
|
- sq. feet
|
- baths - beds |
show details | |

|
#34
Applewood Ave
Fruitland, ID 83619
|
- sq. feet
|
- baths - beds |
show details | |

|
#35
N Fouch Ave
Parma, ID 83660
|
- sq. feet
|
- baths - beds |
show details | |

|
Check over 1 million property listings on Foreclosure.com!
|
browse all offers | |||


- 5,69148.9%Hispanic
- 5,63048.4%White alone
- 2051.8%Two or more races
- 1821.6%Asian alone
- 370.3%American Indian alone
- 220.2%Black alone
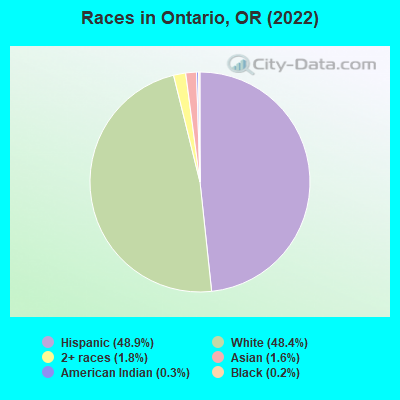
Races in Ontario detailed stats: ancestries, foreign born residents, place of birth
According to our research of Oregon and other state lists, there were 65 registered sex offenders living in Ontario, Oregon as of May 02, 2024.
The ratio of all residents to sex offenders in Ontario is 175 to 1.
Type |
2009 |
2010 |
2011 |
2012 |
2013 |
2014 |
2015 |
2016 |
2017 |
2018 |
2019 |
2020 |
2021 |
2022 |
|---|---|---|---|---|---|---|---|---|---|---|---|---|---|---|
| Murders (per 100,000) | 2 (18.2) | 1 (8.8) | 0 (0.0) | 0 (0.0) | 1 (9.0) | 2 (18.1) | 0 (0.0) | 0 (0.0) | 0 (0.0) | 1 (9.1) | 2 (18.1) | 1 (9.1) | 0 (0.0) | 0 (0.0) |
| Rapes (per 100,000) | 7 (63.7) | 3 (26.4) | 5 (43.5) | 12 (105.7) | 7 (63.2) | 5 (45.4) | 2 (18.4) | 0 (0.0) | 6 (54.7) | 8 (73.0) | 10 (90.5) | 5 (45.7) | 3 (27.0) | 15 (128.9) |
| Robberies (per 100,000) | 9 (81.9) | 2 (17.6) | 6 (52.2) | 5 (44.1) | 12 (108.4) | 16 (145.2) | 5 (45.9) | 6 (54.9) | 11 (100.3) | 12 (109.5) | 11 (99.6) | 5 (45.7) | 4 (36.0) | 14 (120.3) |
| Assaults (per 100,000) | 29 (264.0) | 39 (343.1) | 41 (356.9) | 65 (572.8) | 45 (406.5) | 42 (381.1) | 16 (147.0) | 16 (146.5) | 41 (373.7) | 35 (319.4) | 60 (543.3) | 61 (557.0) | 37 (332.8) | 69 (592.9) |
| Burglaries (per 100,000) | 86 (782.8) | 93 (818.2) | 110 (957.6) | 138 (1,216) | 118 (1,066) | 92 (834.7) | 78 (716.5) | 115 (1,053) | 108 (984.5) | 56 (511.0) | 75 (679.1) | 54 (493.1) | 40 (359.8) | 79 (678.8) |
| Thefts (per 100,000) | 527 (4,797) | 596 (5,244) | 686 (5,972) | 698 (6,151) | 692 (6,252) | 517 (4,691) | 531 (4,877) | 587 (5,373) | 452 (4,120) | 463 (4,225) | 537 (4,862) | 537 (4,903) | 158 (1,421) | 568 (4,881) |
| Auto thefts (per 100,000) | 11 (100.1) | 24 (211.2) | 17 (148.0) | 20 (176.2) | 22 (198.8) | 29 (263.1) | 22 (202.1) | 37 (338.7) | 55 (501.4) | 59 (538.4) | 57 (516.1) | 44 (401.8) | 17 (152.9) | 52 (446.8) |
| Arson (per 100,000) | 2 (18.2) | 3 (26.4) | 2 (17.4) | 0 (0.0) | 3 (27.1) | 2 (18.1) | 0 (0.0) | 5 (45.8) | 3 (27.3) | 4 (36.5) | 5 (45.3) | 7 (63.9) | 2 (18.0) | 4 (34.4) |
| City-Data.com crime index | 419.4 | 396.5 | 439.6 | 557.6 | 523.1 | 459.4 | 319.3 | 361.5 | 422.4 | 421.2 | 530.5 | 442.7 | 193.2 | 536.3 |
The City-Data.com crime index weighs serious crimes and violent crimes more heavily. Higher means more crime, U.S. average is 246.1. It adjusts for the number of visitors and daily workers commuting into cities.
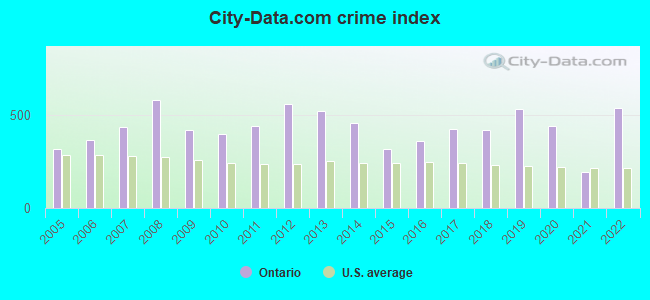
Crime rate in Ontario detailed stats: murders, rapes, robberies, assaults, burglaries, thefts, arson
Full-time law enforcement employees in 2021, including police officers: 28 (24 officers - 23 male; 1 female).
| Officers per 1,000 residents here: | 2.16 |
| Oregon average: | 1.48 |
 Recent articles from our blog. Our writers, many of them Ph.D. graduates or candidates, create easy-to-read articles on a wide variety of topics.

 | Ontario Oregon (14 replies) |
| OMG! So many out-of-state license plates.... (26 replies) |
| Self Serve Gas at issue again! (145 replies) |
| Does anyone have information about Ontario, Oregon? (17 replies) |
| Info on Ontario Oregon ~ (6 replies) |
| drive ~ Baker City to Ontario (2 replies) |
Latest news from Ontario, OR collected exclusively by city-data.com from local newspapers, TV, and radio stations
Ancestries: English (9.0%), German (5.8%), American (4.8%), European (3.0%), Irish (2.3%), Welsh (1.1%).
Current Local Time: PST time zone
Incorporated in 1899
Elevation: 2154 feet
Land area: 4.47 square miles.
Population density: 2,627 people per square mile (average).
1,291 residents are foreign born (9.5% Latin America).
| This city: | 11.1% |
| Oregon: | 9.8% |
Median real estate property taxes paid for housing units with mortgages in 2022: $1,848 (1.0%)
Median real estate property taxes paid for housing units with no mortgage in 2022: $1,422 (0.7%)
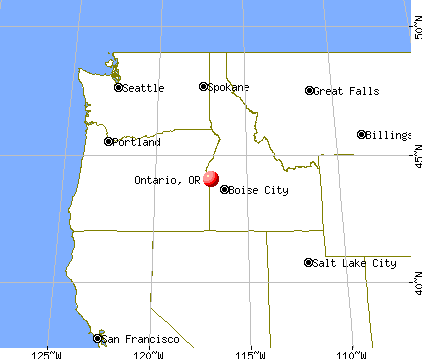
Nearest city with pop. 50,000+: Nampa, ID  (37.2 miles , pop. 51,867).
Nearest city with pop. 200,000+: Northwest Clackamas, OR (293.4 miles , pop. 224,220).
Nearest city with pop. 1,000,000+: Los Angeles, CA (691.7 miles , pop. 3,694,820).
Nearest cities:
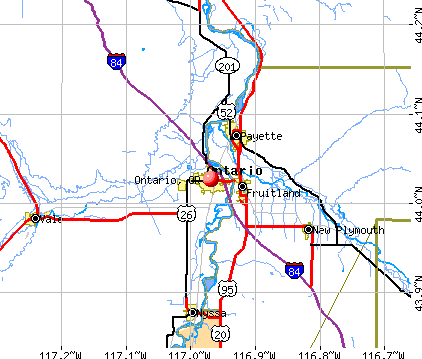
), ), ), )Latitude: 44.03 N, Longitude: 116.97 W
Daytime population change due to commuting: +2,964 (+25.5%)
Workers who live and work in this city: 2,894 (61.3%)
Area code: 541
Ontario, Oregon accommodation & food services, waste management - Economy and Business Data
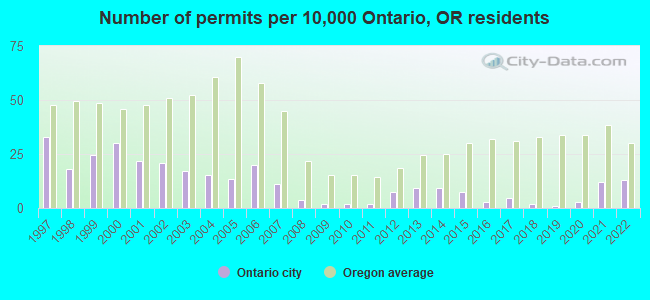
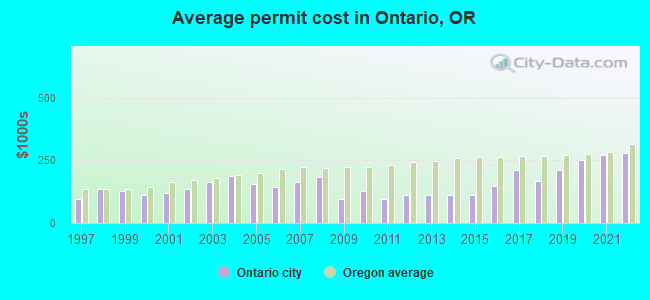
Single-family new house construction building permits:
- 2022: 14 buildings, average cost: $278,500
- 2021: 13 buildings, average cost: $271,200
- 2020: 3 buildings, average cost: $252,500
- 2019: 1 building, cost: $210,200
- 2018: 2 buildings, average cost: $167,300
- 2017: 5 buildings, average cost: $210,200
- 2016: 3 buildings, average cost: $148,600
- 2015: 8 buildings, average cost: $110,200
- 2014: 10 buildings, average cost: $110,200
- 2013: 10 buildings, average cost: $110,200
- 2012: 8 buildings, average cost: $111,900
- 2011: 2 buildings, average cost: $95,000
- 2010: 2 buildings, average cost: $127,500
- 2009: 2 buildings, average cost: $93,500
- 2008: 4 buildings, average cost: $185,000
- 2007: 12 buildings, average cost: $162,300
- 2006: 22 buildings, average cost: $143,300
- 2005: 15 buildings, average cost: $157,300
- 2004: 17 buildings, average cost: $188,000
- 2003: 19 buildings, average cost: $164,500
- 2002: 23 buildings, average cost: $135,200
- 2001: 24 buildings, average cost: $119,500
- 2000: 33 buildings, average cost: $112,500
- 1999: 27 buildings, average cost: $126,100
- 1998: 20 buildings, average cost: $134,800
- 1997: 36 buildings, average cost: $95,900
| Here: | 3.8% |
| Oregon: | 3.9% |
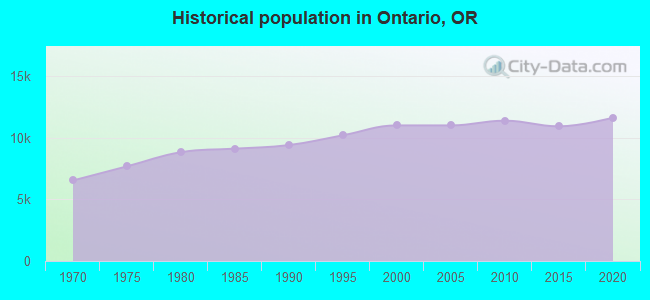
Population change in the 1990s: +1,603 (+17.1%).
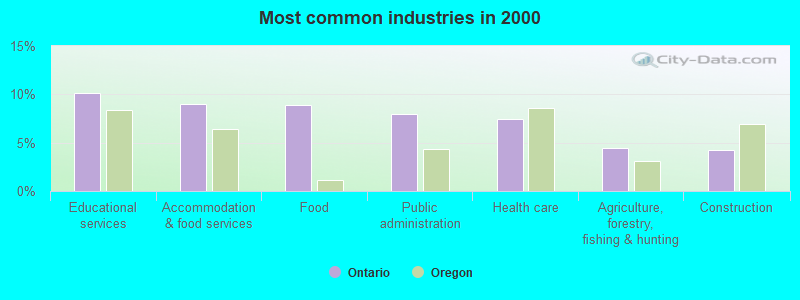
- Educational services (10.1%)
- Accommodation & food services (9.0%)
- Food (8.9%)
- Public administration (8.0%)
- Health care (7.5%)
- Agriculture, forestry, fishing & hunting (4.4%)
- Construction (4.2%)
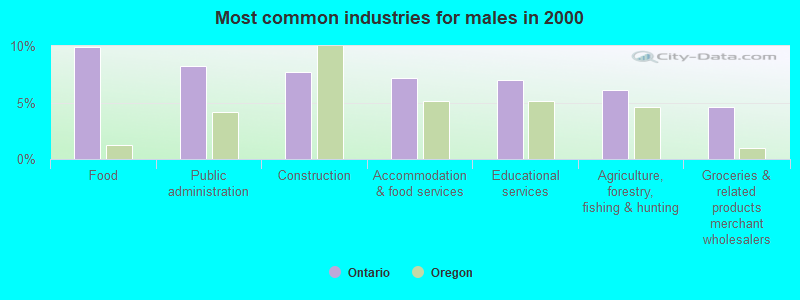
- Food (10.0%)
- Public administration (8.3%)
- Construction (7.7%)
- Accommodation & food services (7.2%)
- Educational services (7.0%)
- Agriculture, forestry, fishing & hunting (6.1%)
- Groceries & related products merchant wholesalers (4.6%)
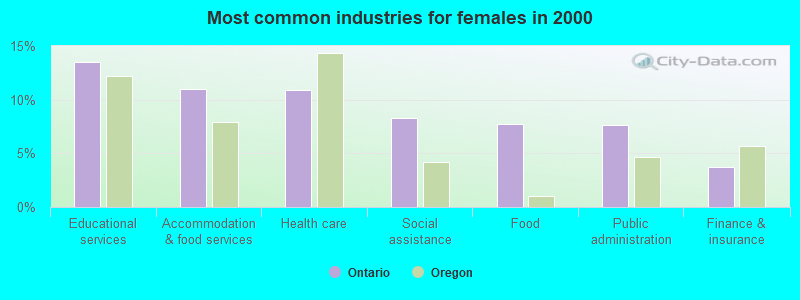
- Educational services (13.5%)
- Accommodation & food services (11.0%)
- Health care (10.9%)
- Social assistance (8.3%)
- Food (7.8%)
- Public administration (7.6%)
- Finance & insurance (3.8%)
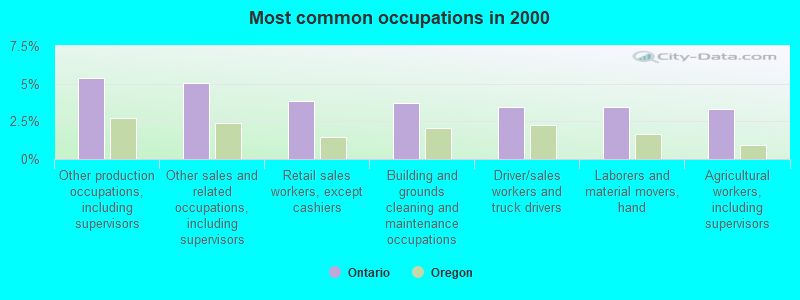
- Other production occupations, including supervisors (5.4%)
- Other sales and related occupations, including supervisors (5.0%)
- Retail sales workers, except cashiers (3.8%)
- Building and grounds cleaning and maintenance occupations (3.7%)
- Driver/sales workers and truck drivers (3.5%)
- Laborers and material movers, hand (3.4%)
- Agricultural workers, including supervisors (3.3%)
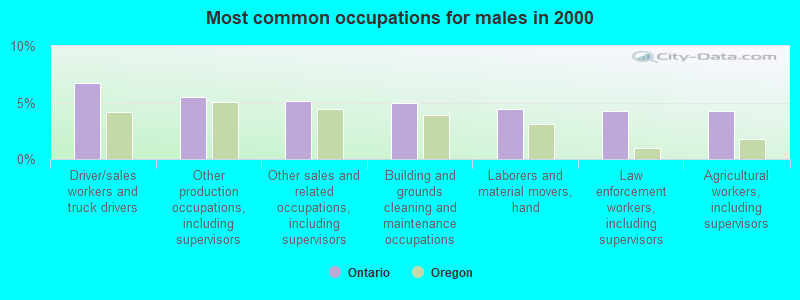
- Driver/sales workers and truck drivers (6.7%)
- Other production occupations, including supervisors (5.5%)
- Other sales and related occupations, including supervisors (5.1%)
- Building and grounds cleaning and maintenance occupations (5.0%)
- Laborers and material movers, hand (4.4%)
- Law enforcement workers, including supervisors (4.3%)
- Agricultural workers, including supervisors (4.3%)
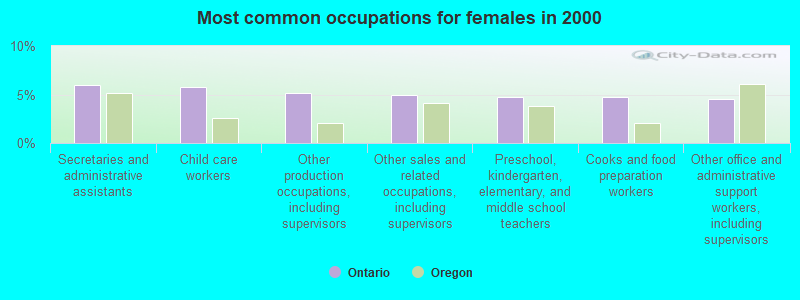
- Secretaries and administrative assistants (5.9%)
- Child care workers (5.8%)
- Other production occupations, including supervisors (5.2%)
- Other sales and related occupations, including supervisors (4.9%)
- Preschool, kindergarten, elementary, and middle school teachers (4.7%)
- Cooks and food preparation workers (4.7%)
- Other office and administrative support workers, including supervisors (4.5%)
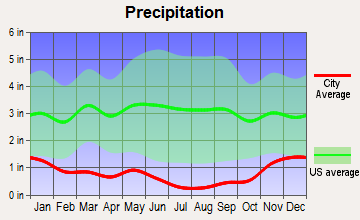
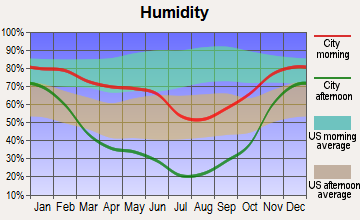
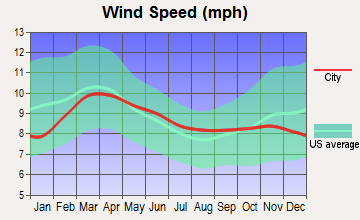
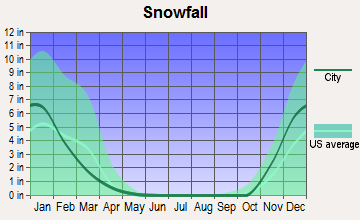
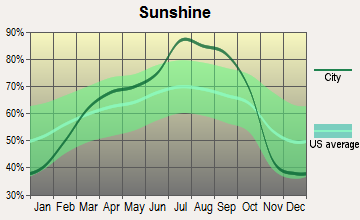
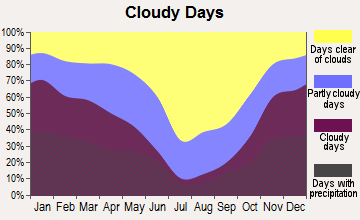
Average climate in Ontario, Oregon
Based on data reported by over 4,000 weather stations

|
|

Earthquake activity:
Ontario-area historical earthquake activity is significantly above Oregon state average. It is 2164% greater than the overall U.S. average.On 10/28/1983 at 14:06:06, a magnitude 7.3 (6.2 MB, 7.3 MS, 7.0 MW, Class: Major, Intensity: VIII - XII) earthquake occurred 157.4 miles away from Ontario center, causing 2 deaths (2 shaking deaths) and 3 injuries, causing $15,000,000 total damage
On 10/3/1915 at 06:52:48, a magnitude 7.6 (7.6 UK) earthquake occurred 245.5 miles away from the city center
On 8/18/1959 at 06:37:13, a magnitude 7.7 (7.7 UK) earthquake occurred 314.7 miles away from the city center, causing $26,000,000 total damage
On 3/31/2020 at 23:52:30, a magnitude 6.5 (6.5 MW, Depth: 7.5 mi, Class: Strong, Intensity: VII - IX) earthquake occurred 96.6 miles away from the city center
On 12/16/1954 at 11:07:12, a magnitude 7.0 (7.0 UK) earthquake occurred 338.1 miles away from Ontario center
On 12/21/1932 at 06:10:09, a magnitude 7.2 (7.2 UK) earthquake occurred 386.0 miles away from Ontario center
Magnitude types: body-wave magnitude (MB), surface-wave magnitude (MS), moment magnitude (MW)
Natural disasters:
The number of natural disasters in Malheur County (5) is a lot smaller than the US average (15).Major Disasters (Presidential) Declared: 3
Emergencies Declared: 2
Causes of natural disasters: Drought: 1, Flood: 1, Heavy Rain: 1, Hurricane: 1, Winter Storm: 1, Other: 1 (Note: some incidents may be assigned to more than one category).
Hospitals and medical centers in Ontario:
- PATHWAY HOSPICE INC (1050 SW 3RD AVENUE, SUITE 1600)
- ST ALPHONSUS MEDICAL CENTER - ONTARIO, INC (Voluntary non-profit - Church, provides emergency services, 351 SW 9TH STREET)
- PRESBYTERIAN COMMUNITY CARE CE (1085 N. OREGON STREET)
- PRESBYTERIAN NURSING HOME (1085 N OREGON STREET)
- FOUR RIVERS DIALYSIS CENTER (515 EAST LANE)
- ST ALPHONSUS ONTARIO, HOME CARE (824 SW 4TH AVENUE)
- XL HOME HEALTH SERVICES (49 NW FIRST STREET SUITE 4)
Airports and heliports located in Ontario:
- Ontario Municipal Airport (ONO) (Runways: 1, Itinerant Ops: 8,080, Local Ops: 4,850)
- Saint Alphonsus Medical Center-Ontario Heliport (5OR6)
College/University in Ontario:
Other colleges/universities with over 2000 students near Ontario:
- College of Western Idaho (about 37 miles; Nampa, ID; Full-time enrollment: 6,300)
- Northwest Nazarene University (about 38 miles; Nampa, ID; FT enrollment: 2,290)
- Boise State University (about 48 miles; Boise, ID; FT enrollment: 16,774)
- Eastern Oregon University (about 106 miles; La Grande, OR; FT enrollment: 3,127)
- Walla Walla Community College (about 156 miles; Walla Walla, WA; FT enrollment: 4,263)
- College of Southern Idaho (about 161 miles; Twin Falls, ID; FT enrollment: 5,051)
- Lewis-Clark State College (about 165 miles; Lewiston, ID; FT enrollment: 3,199)
Public high school in Ontario:
- ONTARIO HIGH SCHOOL (Students: 844, Location: 1115 W IDAHO AVE, Grades: 9-12)
Private high school in Ontario:
Public elementary/middle schools in Ontario:
- ONTARIO MIDDLE SCHOOL (Students: 673, Location: 573 SW 2ND AVE, Grades: 7-8)
- MAY ROBERTS ELEMENTARY SCHOOL (Students: 357, Location: 590 NW 8TH ST, Grades: KG-6)
- ALAMEDA ELEMENTARY SCHOOL (Students: 349, Location: 1252 ALAMEDA DR, Grades: KG-6)
- AIKEN ELEMENTARY SCHOOL (Students: 255, Location: 1297 W IDAHO AVE, Grades: KG-5)
- FOUR RIVERS COMMUNITY SCHOOL (Students: 144, Location: 2449 SW 4TH AVE, Grades: KG-8, Charter school)
- CAIRO ELEMENTARY SCHOOL (Students: 126, Location: 531 HWY 20/26, Grades: KG-5)
- PIONEER ELEMENTARY SCHOOL (Students: 126, Location: 4744 PIONEER RD, Grades: KG-5)
- ANNEX CHARTER SCHOOL (Location: 402 ANNEX RD, Grades: KG-8, Charter school)
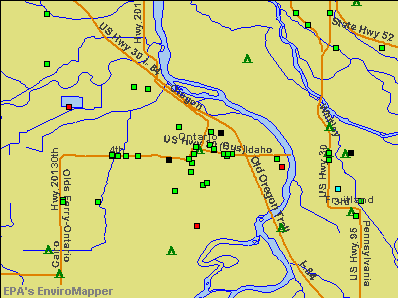
Points of interest:
Notable locations in Ontario: Greyhound Bus Station Ontario (A), Ontario Water Treatment Plant (B), Ontario Municipal Golf Course (C), Ontario Safety Rest Area (D), Malheur County Fairgrounds (E), Ontario City Hall (F), Four Rivers Cultural Center and Museum Convention Center (G), Four Rivers Cultural Center and Museum Meyer McLean Theater (H), Ontario Community Library (I), Ontario Public Works Department (J), Ontario Municipal Court (K), Malheur County Justice Court (L), Malheur County Health Department Office (M), Ontario Fire and Rescue (N), Department of Motor Vehicles Ontario (O), Malheur County Alcohol and Drug Recovery Center (P), Four Rivers Cultural Center and Museum (Q). Display/hide their locations on the map
Cemeteries: Saint Johns Cemetery (1), Evergreen Cemetery (2). Display/hide their locations on the map
Reservoir: Becker Ponds (A). Display/hide its location on the map
Parks in Ontario include: Laxson Park (1), Eastside Park (2), Treasure Valley Ball Park (3), Beck-Kiwanis Park (4), Ontario State Park (5), Lions Park (6). Display/hide their locations on the map
Tourist attractions: Four Rivers Cultural Center & Museum (676 Southwest 5th Avenue), Video Amusement's & Music CO (Amusement & Theme Parks; 373 Northeast 4th Avenue).
Hotels: Holiday Inn (1249 Tapadera Avenue), Budget Inn (1737 North Oregon Street), Oregon Trail Motel (92 East Idaho Avenue), Ontario Inn (1144 Southwest 4th Avenue), Budget Luxury Motel (1395 Tapadera Avenue), Colonial Inns of Ontario (1395 Tapadera Avenue), Motel 6 (275 Northeast 12th Street), Economy Inn Motel (88 North Oregon Street), Best Western Inn and Suites (251 Goodfellow Street).
Birthplace of: Dave Wilcox - Football player, Denny Smith - Politician, Erik Fisher - Alpine skier, Phyllis McGinley - Writer and poet, Randall B. Kester - Judge, Chuck Winder - Politician, Leland Evan Thomas - Marine, Sally Flynn - Female singer, Tom Edens - Baseball player.
Drinking water stations with addresses in Ontario and their reported violations in the past:
GOLF MOBILE CITY (Population served: 32, Groundwater):Past health violations:WINNERS HORSESHOE - ANNEX (Population served: 25, Groundwater):Past monitoring violations:
- MCL, Average - Between APR-2014 and JUN-2014, Contaminant: Arsenic
- MCL, Single Sample - Between APR-2014 and JUN-2014, Contaminant: Nitrate
- MCL, Average - Between JAN-2014 and MAR-2014, Contaminant: Arsenic. Follow-up actions: St Public Notif requested (APR-17-2014)
- MCL, Single Sample - Between JAN-2014 and MAR-2014, Contaminant: Nitrate. Follow-up actions: St Public Notif received (FEB-20-2014), St Public Notif requested (MAR-18-2014)
- MCL, Average - Between OCT-2013 and DEC-2013, Contaminant: Arsenic. Follow-up actions: St Admin Penalty assessed (DEC-06-2012), St Public Notif requested (JAN-27-2014)
- MCL, Average - Between JUL-2013 and SEP-2013, Contaminant: Arsenic. Follow-up actions: St Admin Penalty assessed (DEC-06-2012), St Public Notif requested (OCT-18-2013)
- 27 other older health violations
- Initial Tap Sampling for Pb and Cu - In JAN-01-2014, Contaminant: Lead and Copper Rule. Follow-up actions: St Admin Penalty assessed (DEC-06-2012)
- Initial Tap Sampling for Pb and Cu - In JUL-01-2013, Contaminant: Lead and Copper Rule. Follow-up actions: St Admin Penalty assessed (DEC-06-2012)
- Initial Tap Sampling for Pb and Cu - In JAN-01-2013, Contaminant: Lead and Copper Rule. Follow-up actions: St AO (w/penalty) issued (MAY-27-2011), St Violation/Reminder Notice (FEB-04-2013)
- Initial Tap Sampling for Pb and Cu - In JUL-01-2012, Contaminant: Lead and Copper Rule. Follow-up actions: St AO (w/penalty) issued (MAY-27-2011), St Violation/Reminder Notice (JUL-30-2012)
- Monitoring, Source Water (GWR) - In JUL-01-2011, Contaminant: E. COLI. Follow-up actions: St Violation/Reminder Notice (AUG-22-2011), St Compliance achieved (APR-29-2013)
- 17 routine major monitoring violations
- 2 minor monitoring violations
- 151 regular monitoring violations
- 2 other older monitoring violations
Past monitoring violations:
- 5 routine major monitoring violations
- One regular monitoring violation
| This city: | 2.6 people |
| Oregon: | 2.5 people |
| This city: | 62.6% |
| Whole state: | 63.4% |
| This city: | 8.3% |
| Whole state: | 8.0% |
Likely homosexual households (counted as self-reported same-sex unmarried-partner households)
- Lesbian couples: 0.5% of all households
- Gay men: 0.1% of all households
People in group quarters in Ontario in 2010:
- 123 people in college/university student housing
- 39 people in group homes intended for adults
- 36 people in other noninstitutional facilities
- 34 people in nursing facilities/skilled-nursing facilities
- 24 people in residential treatment centers for adults
People in group quarters in Ontario in 2000:
- 135 people in nursing homes
- 63 people in college dormitories (includes college quarters off campus)
- 37 people in other noninstitutional group quarters
- 16 people in other group homes
- 5 people in homes for the mentally ill
- 2 people in homes or halfway houses for drug/alcohol abuse
Banks with branches in Ontario (2011 data):
- JPMorgan Chase Bank, National Association: Ontario at 319 S.W. Fourth Avenue, branch established on 1969/05/05. Info updated 2011/11/10: Bank assets: $1,811,678.0 mil, Deposits: $1,190,738.0 mil, headquarters in Columbus, OH, positive income, International Specialization, 5577 total offices, Holding Company: Jpmorgan Chase & Co.
- Panhandle State Bank: Ontario Branch at 98 South Oregon Street, branch established on 1979/01/01. Info updated 2009/07/09: Bank assets: $936.3 mil, Deposits: $731.7 mil, headquarters in Sandpoint, ID, positive income, Commercial Lending Specialization, 22 total offices, Holding Company: Intermountain Community Bancorp
- U.S. Bank National Association: Ontario Branch at 281 S.W. First Street, branch established on 1935/07/15. Info updated 2012/01/30: Bank assets: $330,470.8 mil, Deposits: $236,091.5 mil, headquarters in Cincinnati, OH, positive income, 3121 total offices, Holding Company: U.S. Bancorp
- Bank of America, National Association: Ontario Branch at 1448 Southwest Fourth Avenue, branch established on 1890/01/01. Info updated 2009/11/18: Bank assets: $1,451,969.3 mil, Deposits: $1,077,176.8 mil, headquarters in Charlotte, NC, positive income, 5782 total offices, Holding Company: Bank Of America Corporation
- Sterling Savings Bank: Ontario Branch at 225 Sw 4th Avenue, branch established on 2001/08/01. Info updated 2012/03/21: Bank assets: $9,207.8 mil, Deposits: $6,454.1 mil, headquarters in Spokane, WA, positive income, Commercial Lending Specialization, 192 total offices, Holding Company: Sterling Financial Corporation
- Bank of the West: Ontario Branch at 505 Sunset Drive, branch established on 1934/11/03. Info updated 2009/11/16: Bank assets: $62,408.3 mil, Deposits: $43,995.2 mil, headquarters in San Francisco, CA, positive income, 647 total offices, Holding Company: Bnp Paribas
- Wells Fargo Bank, National Association: Ontario Branch at 189 South First Street, branch established on 1954/02/08. Info updated 2011/04/05: Bank assets: $1,161,490.0 mil, Deposits: $905,653.0 mil, headquarters in Sioux Falls, SD, positive income, 6395 total offices, Holding Company: Wells Fargo & Company
For population 15 years and over in Ontario:
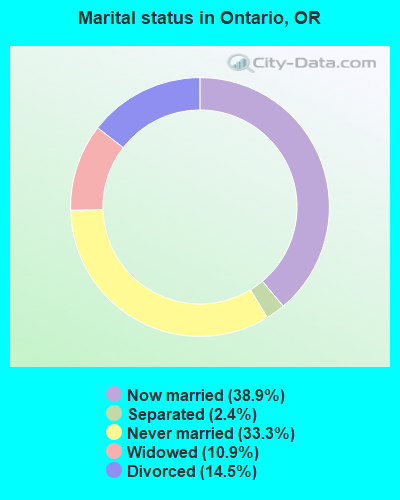
- Never married: 33.3%
- Now married: 38.9%
- Separated: 2.4%
- Widowed: 10.9%
- Divorced: 14.5%
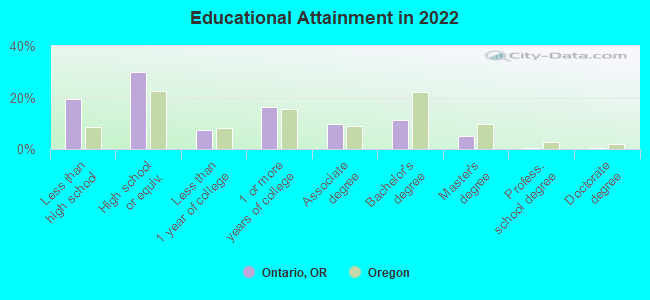
For population 25 years and over in Ontario:
- High school or higher: 79.9%
- Bachelor's degree or higher: 16.7%
- Graduate or professional degree: 5.9%
- Unemployed: 13.9%
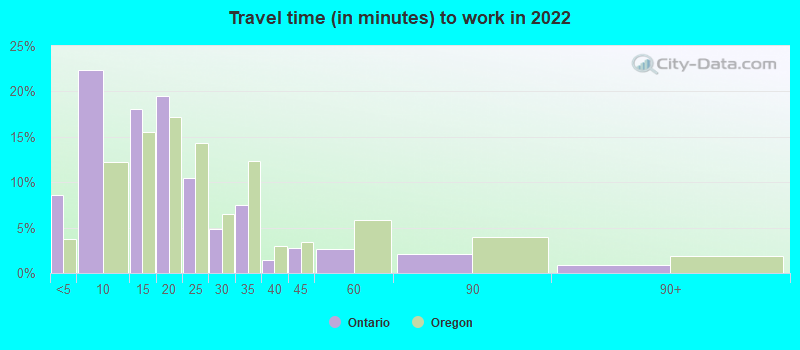
- Mean travel time to work (commute): 13.4 minutes
| Here: | 14.0 |
| Oregon average: | 11.6 |
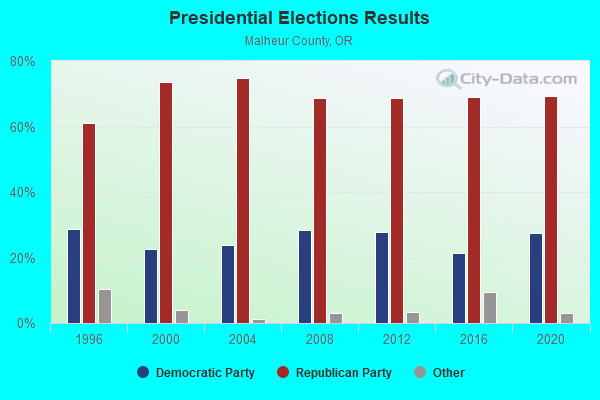
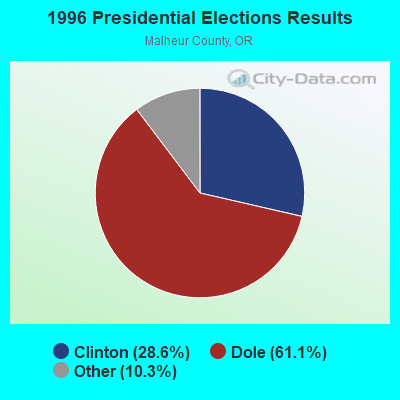
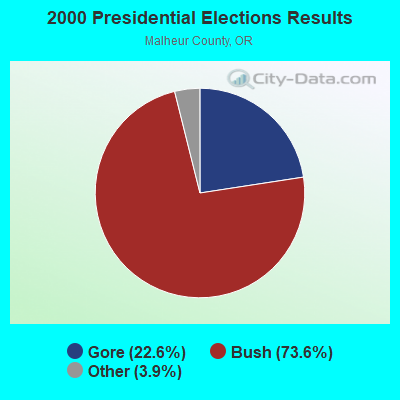
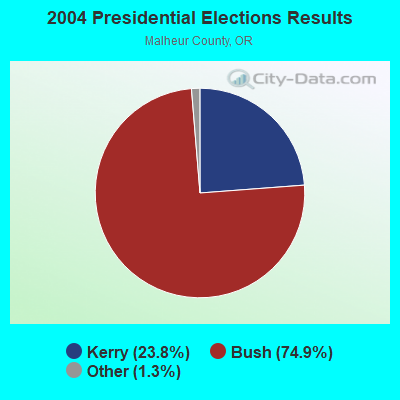
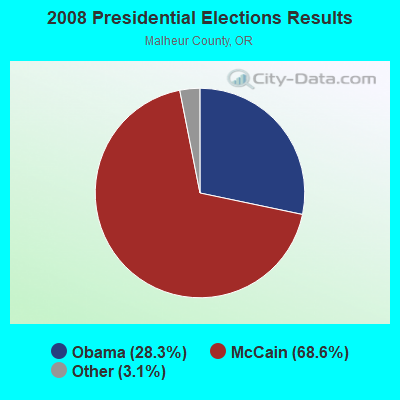
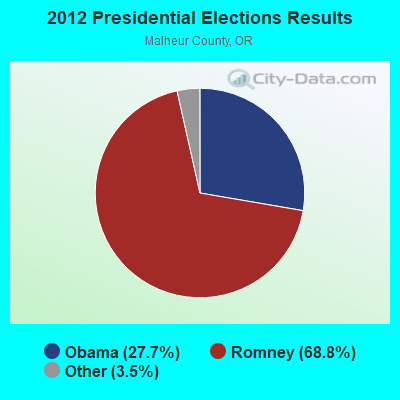
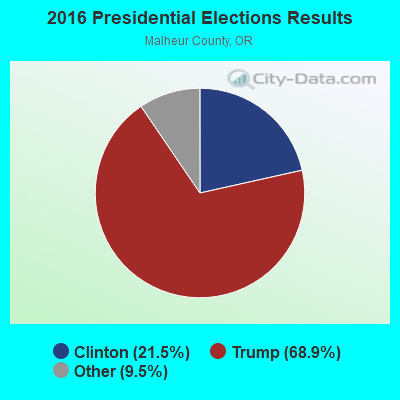
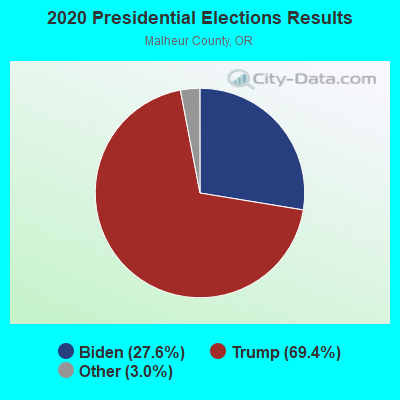
Graphs represent county-level data. Detailed 2008 Election Results
Religion statistics for Ontario, OR (based on Malheur County data)
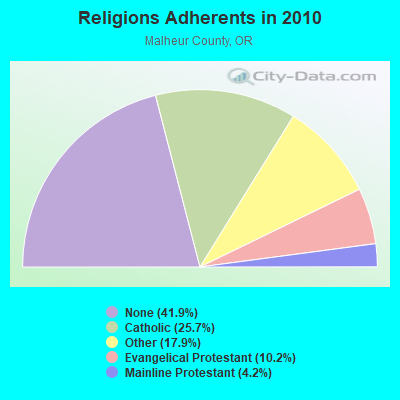
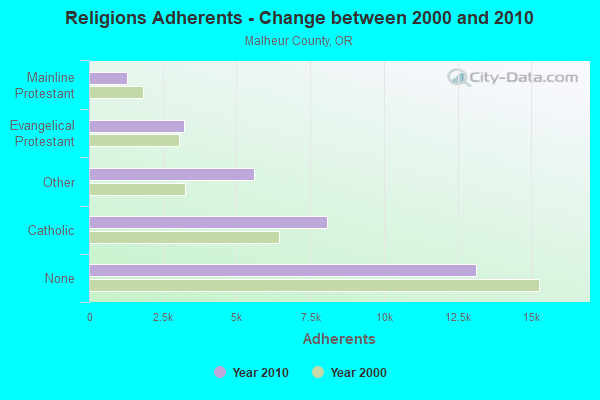
| Religion | Adherents | Congregations |
|---|---|---|
| Catholic | 8,060 | 7 |
| Other | 5,611 | 18 |
| Evangelical Protestant | 3,208 | 28 |
| Mainline Protestant | 1,304 | 13 |
| None | 13,130 | - |
Food Environment Statistics:
| This county: | 1.61 / 10,000 pop. |
| Oregon: | 2.03 / 10,000 pop. |
| This county: | 0.64 / 10,000 pop. |
| State: | 0.33 / 10,000 pop. |
| Malheur County: | 0.64 / 10,000 pop. |
| Oregon: | 2.01 / 10,000 pop. |
| Here: | 1.93 / 10,000 pop. |
| Oregon: | 1.69 / 10,000 pop. |
| Malheur County: | 9.03 / 10,000 pop. |
| Oregon: | 9.93 / 10,000 pop. |
| Malheur County: | 7.0% |
| State: | 7.4% |
| Here: | 29.7% |
| Oregon: | 25.6% |
| Here: | 20.6% |
| Oregon: | 14.2% |
Health and Nutrition:
| Here: | 47.8% |
| Oregon: | 49.6% |
| This city: | 45.3% |
| State: | 46.8% |
| Ontario: | 28.3 |
| State: | 28.5 |
| Ontario: | 23.5% |
| State: | 21.2% |
| Ontario: | 11.3% |
| Oregon: | 10.1% |
| Here: | 6.8 |
| State: | 6.8 |
| This city: | 31.4% |
| Oregon: | 33.3% |
| Ontario: | 53.8% |
| Oregon: | 56.5% |
| Here: | 78.6% |
| Oregon: | 78.7% |
More about Health and Nutrition of Ontario, OR Residents
| Local government employment and payroll (March 2022) | |||||
| Function | Full-time employees | Monthly full-time payroll | Average yearly full-time wage | Part-time employees | Monthly part-time payroll |
|---|---|---|---|---|---|
| Police Protection - Officers | 25 | $182,995 | $87,838 | 0 | $0 |
| Firefighters | 9 | $68,907 | $91,876 | 19 | $6,561 |
| Other Government Administration | 3 | $21,814 | $87,256 | 6 | $825 |
| Police - Other | 3 | $9,924 | $39,696 | 1 | $1,821 |
| Housing and Community Development (Local) | 1 | $7,949 | $95,388 | 0 | $0 |
| Other and Unallocable | 1 | $2,258 | $27,096 | 0 | $0 |
| Fire - Other | 1 | $3,380 | $40,560 | 0 | $0 |
| Financial Administration | 1 | $5,818 | $69,816 | 0 | $0 |
| Airports | 0 | $0 | 1 | $4,734 | |
| Totals for Government | 44 | $303,046 | $82,649 | 27 | $13,941 |
Ontario government finances - Expenditure in 2021 (per resident):
- Construction - Parks and Recreation: $868,000 ($73.99)
Water Utilities: $727,000 ($61.97)
Sewerage: $665,000 ($56.68)
Regular Highways: $87,000 ($7.42)
Air Transportation: $54,000 ($4.60)
- Current Operations - Police Protection: $3,012,000 ($256.73)
Water Utilities: $2,168,000 ($184.79)
Sewerage: $1,939,000 ($165.27)
Regular Highways: $1,576,000 ($134.33)
Local Fire Protection: $1,248,000 ($106.38)
Central Staff Services: $651,000 ($55.49)
General - Other: $563,000 ($47.99)
Parks and Recreation: $338,000 ($28.81)
Financial Administration: $254,000 ($21.65)
Solid Waste Management: $213,000 ($18.16)
General Public Buildings: $165,000 ($14.06)
Protective Inspection and Regulation - Other: $147,000 ($12.53)
Miscellaneous Commercial Activities - Other: $118,000 ($10.06)
Air Transportation: $110,000 ($9.38)
Housing and Community Development: $22,000 ($1.88)
- General - Interest on Debt: $99,000 ($8.44)
- Intergovernmental to Local - Other - General - Other: $227,000 ($19.35)
Other - Local Fire Protection: $67,000 ($5.71)
- Other Capital Outlay - Water Utilities: $155,000 ($13.21)
Sewerage: $96,000 ($8.18)
Air Transportation: $70,000 ($5.97)
Regular Highways: $48,000 ($4.09)
Local Fire Protection: $24,000 ($2.05)
- Total Salaries and Wages: $3,426,000 ($292.02)
- Water Utilities - Interest on Debt: $99,000 ($8.44)
Ontario government finances - Revenue in 2021 (per resident):
- Charges - Sewerage: $3,754,000 ($319.98)
Other: $172,000 ($14.66)
Air Transportation: $90,000 ($7.67)
Parks and Recreation: $78,000 ($6.65)
Miscellaneous Commercial Activities: $27,000 ($2.30)
- Local Intergovernmental - Other: $313,000 ($26.68)
General Local Government Support: $19,000 ($1.62)
- Miscellaneous - Interest Earnings: $264,000 ($22.50)
Donations From Private Sources: $135,000 ($11.51)
Fines and Forfeits: $84,000 ($7.16)
General Revenue - Other: $37,000 ($3.15)
Special Assessments: $5,000 ($0.43)
- Revenue - Water Utilities: $3,949,000 ($336.60)
- State Intergovernmental - Highways: $971,000 ($82.77)
Housing and Community Development: $487,000 ($41.51)
General Local Government Support: $396,000 ($33.75)
Other: $161,000 ($13.72)
- Tax - Property: $3,933,000 ($335.24)
Public Utilities Sales: $2,394,000 ($204.06)
Other Selective Sales: $1,061,000 ($90.44)
Occupation and Business License - Other: $302,000 ($25.74)
Other License: $13,000 ($1.11)
Alcoholic Beverage License: $3,000 ($0.26)
Ontario government finances - Debt in 2021 (per resident):
- Long Term Debt - Beginning Outstanding - Unspecified Public Purpose: $4,624,000 ($394.14)
Outstanding Unspecified Public Purpose: $4,052,000 ($345.38)
Retired Unspecified Public Purpose: $572,000 ($48.76)
Ontario government finances - Cash and Securities in 2021 (per resident):
- Other Funds - Cash and Securities: $15,391,000 ($1311.88)
| Businesses in Ontario, OR | ||||
| Name | Count | Name | Count | |
|---|---|---|---|---|
| Albertsons | 1 | MasterBrand Cabinets | 4 | |
| Arby's | 1 | Maurices | 1 | |
| Ashley Furniture | 1 | McDonald's | 2 | |
| AutoZone | 1 | Motel 6 | 1 | |
| Baskin-Robbins | 1 | Payless | 1 | |
| Best Western | 1 | Pizza Hut | 1 | |
| Big O Tires | 1 | Quiznos | 1 | |
| Burger King | 1 | RadioShack | 1 | |
| Carl\s Jr. | 1 | Rite Aid | 1 | |
| Curves | 1 | Rodeway Inn | 1 | |
| Dairy Queen | 1 | Rue21 | 1 | |
| Dennys | 1 | Sears | 1 | |
| Domino's Pizza | 1 | Sprint Nextel | 1 | |
| FedEx | 4 | Staples | 1 | |
| Ford | 1 | Subaru | 1 | |
| GNC | 1 | Subway | 3 | |
| GameStop | 1 | Super 8 | 1 | |
| H&R Block | 2 | T-Mobile | 2 | |
| Holiday Inn | 2 | Taco Bell | 1 | |
| Home Depot | 1 | Toyota | 1 | |
| Jack In The Box | 1 | True Value | 1 | |
| KFC | 2 | U-Haul | 2 | |
| Kmart | 1 | U.S. Cellular | 2 | |
| La-Z-Boy | 1 | UPS | 5 | |
| Lane Furniture | 1 | Walgreens | 1 | |
| Long John Silver's | 1 | Walmart | 1 | |
Strongest AM radio stations in Ontario:
- KSRV (1380 AM; 5 kW; ONTARIO, OR; Owner: HBG-RADIO ONTARIO LLC)
- KWEI (1260 AM; 50 kW; WEISER, ID; Owner: TREASURE VALLEY BROADCASTING CO.)
- KIOV (1450 AM; 1 kW; PAYETTE, ID; Owner: ASSOCIATES COMMUNICATIONS OF IDAHO,)
- KBOI (670 AM; 50 kW; BOISE, ID; Owner: CITADEL BROADCASTING COMPANY)
- KBGN (1060 AM; daytime; 10 kW; CALDWELL, ID; Owner: NELSON M. AND KAREN E. WILSON)
- KBSU (730 AM; 15 kW; BOISE, ID; Owner: IDAHO STATE BOARD OF EDUCATION)
- KIDO (580 AM; 5 kW; NAMPA, ID; Owner: CITICASTERS LICENSES, L.P.)
- KGEM (1140 AM; 10 kW; BOISE, ID; Owner: JOURNAL BROADCAST CORPORATION)
- KFXD (630 AM; 5 kW; BOISE, ID; Owner: CITICASTERS LICENSES, L.P.)
- KKIC (950 AM; 4 kW; BOISE, ID; Owner: WESTERN PACIFIC, INC)
- KTIK (1350 AM; 5 kW; NAMPA, ID; Owner: CITADEL BROADCASTING COMPANY)
- KPOJ (620 AM; 50 kW; PORTLAND, OR; Owner: CITICASTERS LICENSES, L.P.)
- KTBI (810 AM; daytime; 50 kW; EPHRATA, WA; Owner: TACOMA BROADCASTERS, INCORPORATED)
Strongest FM radio stations in Ontario:
- K298AC (107.5 FM; ONTARIO, OR; Owner: OREGON PUBLIC BROADCASTING)
- KWEI-FM (99.5 FM; FRUITLAND, ID; Owner: TREASURE VALLEY BROADCASTING CO.)
- KJHY (101.9 FM; EMMETT, ID; Owner: CAPITAL WEST INC)
- KIZN (92.3 FM; BOISE, ID; Owner: CITADEL BROADCASTING COMPANY)
- KKGL (96.9 FM; NAMPA, ID; Owner: CITADEL BROADCASTING COMPANY)
- KQFC (97.9 FM; BOISE, ID; Owner: CITADEL BROADCASTING COMPANY)
- KZMG (93.1 FM; NEW PLYMOUTH, ID; Owner: CITADEL BROADCASTING COMPANY)
- KBSU-FM (90.3 FM; BOISE, ID; Owner: IDAHO STATE BOARD OF EDUCATION)
- KBSX (91.5 FM; BOISE, ID; Owner: IDAHO STATE BOARD OF EDUCATION)
- KCIX (105.9 FM; GARDEN CITY, ID; Owner: CITICASTERS LICENSES, L.P.)
- KRVB (94.9 FM; NAMPA, ID; Owner: JOURNAL BROADCAST CORPORATION)
- KXLT-FM (107.9 FM; EAGLE, ID; Owner: CITICASTERS LICENSES, L.P.)
- KJOT (105.1 FM; BOISE, ID; Owner: JOURNAL BROADCAST CORPORATION)
- KTHI (107.1 FM; CALDWELL, ID; Owner: JOURNAL BROADCAST CORPORATION)
- KBXL (94.1 FM; CALDWELL, ID; Owner: KSPD, INC.)
- KTSY (89.5 FM; CALDWELL, ID; Owner: GEM STATE ADVENTIST ACADEMY)
- KSAS-FM (103.3 FM; CALDWELL, ID; Owner: CITICASTERS LICENSES, L.P.)
- KLTB (104.3 FM; BOISE, ID; Owner: CITICASTERS LICENSES, L.P.)
- KQXR (100.3 FM; PAYETTE, ID; Owner: JOURNAL BROADCAST CORPORATION)
- KSRV-FM (96.1 FM; ONTARIO, OR; Owner: HBG-RADIO ONTARIO LLC)
TV broadcast stations around Ontario:
- KMBA-LP (Channel 19; ONTARIO, OR; Owner: TREASURE VALLEY COMMUNITY COLLEGE)
- K15DY (Channel 15; ONTARIO, ETC., OR; Owner: OREGON PUBLIC BROADCASTING)
- National Bridge Inventory (NBI) Statistics
- 31Number of bridges
- 604ft / 184mTotal length
- $5,909,000Total costs
- 261,893Total average daily traffic
- 56,606Total average daily truck traffic
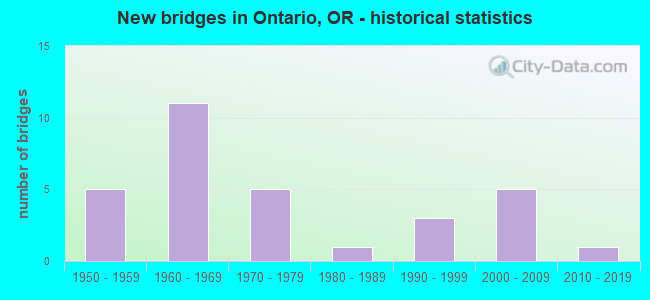
- New bridges - historical statistics
- 51950-1959
- 111960-1969
- 51970-1979
- 11980-1989
- 31990-1999
- 52000-2009
- 12010-2019
FCC Registered Antenna Towers: 83 (See the full list of FCC Registered Antenna Towers)
FCC Registered Private Land Mobile Towers: 1 (See the full list of FCC Registered Private Land Mobile Towers in Ontario, OR)
FCC Registered Broadcast Land Mobile Towers: 43 (See the full list of FCC Registered Broadcast Land Mobile Towers)
FCC Registered Microwave Towers: 50 (See the full list of FCC Registered Microwave Towers in this town)
FCC Registered Paging Towers: 5 (See the full list of FCC Registered Paging Towers)
FCC Registered Amateur Radio Licenses: 100 (See the full list of FCC Registered Amateur Radio Licenses in Ontario)
FAA Registered Aircraft Manufacturers and Dealers: 4 (See the full list of FAA Registered Manufacturers and Dealers in Ontario)
FAA Registered Aircraft: 73 (See the full list of FAA Registered Aircraft)
2002 - 2018 National Fire Incident Reporting System (NFIRS) incidents
- Fire incident types reported to NFIRS in Ontario, OR
- 78852.9%Outside Fires
- 38125.6%Structure Fires
- 22014.8%Mobile Property/Vehicle Fires
- 1026.8%Other
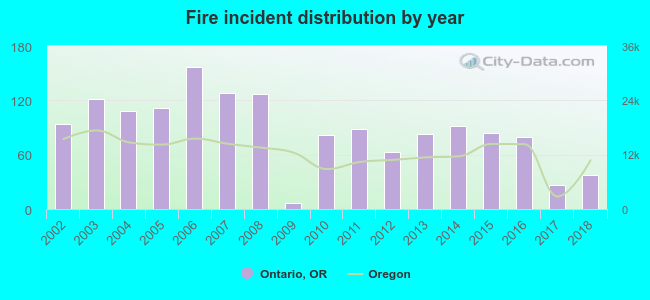 Based on the data from the years 2002 - 2018 the average number of fires per year is 88. The highest number of fire incidents - 157 took place in 2006, and the least - 7 in 2009. The data has a dropping trend.
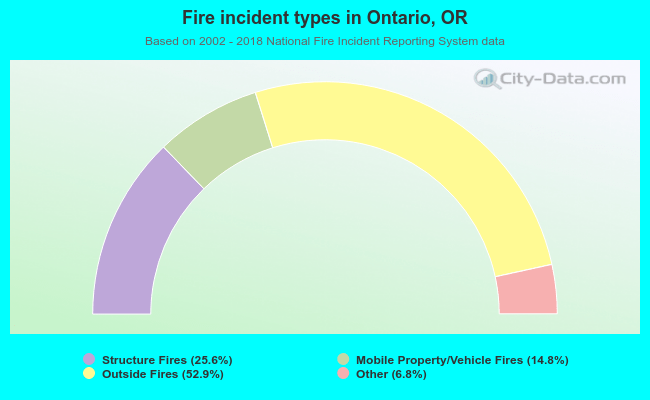 When looking into fire subcategories, the most reports belonged to: Outside Fires (52.9%), and Structure Fires (25.6%).
Fire-safe hotels and motels in Ontario, Oregon:
- Clarion Inn, 1249 Tapadera Ave, Ontario, Oregon 97914 , Phone: (541) 889-8621
- Best Western Inn & Suites, 251 NE Goodfellow St, Ontario, Oregon 97914 , Phone: (541) 889-2600, Fax: (541) 889-2259
- Super 8 Motel, 266 Goodfellow St, Ontario, Oregon 97914 , Phone: (541) 889-8282, Fax: (541) 881-1400
- Sleep Inn, 1221 S E First Ave, Ontario, Oregon 97914 , Phone: (541) 881-0007, Fax: (541) 881-8898
- Holiday Inn Express Hotel & Suites, 212 SE Tenth St, Ontario, Oregon 97914 , Phone: (541) 889-7100, Fax: (541) 889-2266
| Most common first names in Ontario, OR among deceased individuals | ||
| Name | Count | Lived (average) |
|---|---|---|
| John | 92 | 75.8 years |
| James | 84 | 72.8 years |
| Mary | 82 | 80.4 years |
| William | 79 | 78.5 years |
| Charles | 72 | 77.0 years |
| Robert | 70 | 72.9 years |
| George | 59 | 78.4 years |
| Helen | 49 | 79.6 years |
| Harold | 38 | 75.8 years |
| Ruth | 37 | 82.1 years |
| Most common last names in Ontario, OR among deceased individuals | ||
| Last name | Count | Lived (average) |
|---|---|---|
| Smith | 52 | 78.9 years |
| Johnson | 40 | 78.3 years |
| Davis | 39 | 78.7 years |
| Anderson | 26 | 82.3 years |
| White | 21 | 76.9 years |
| Jones | 20 | 80.9 years |
| Miller | 20 | 80.7 years |
| Brown | 20 | 79.0 years |
| Taylor | 17 | 69.6 years |
| Wilson | 16 | 80.1 years |
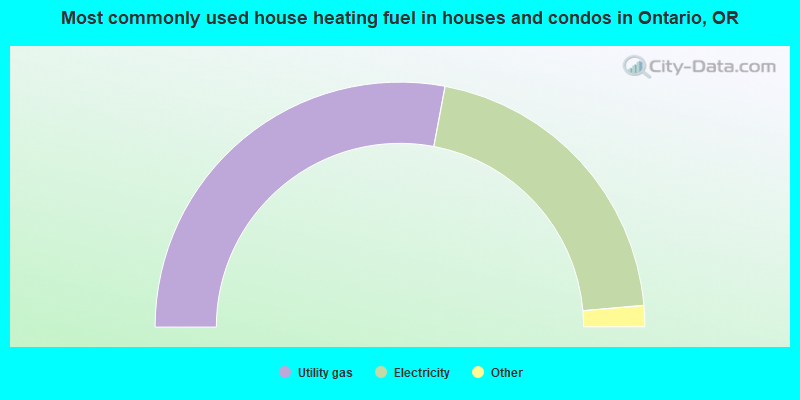
- 55.9%Utility gas
- 41.3%Electricity
- 1.6%Wood
- 0.8%Bottled, tank, or LP gas
- 0.4%Fuel oil, kerosene, etc.
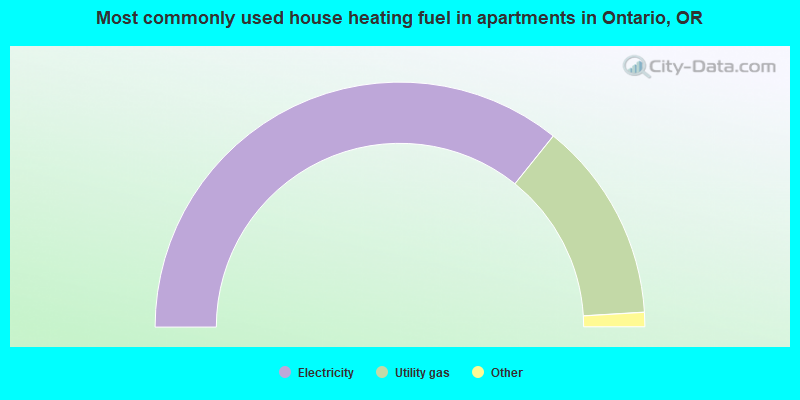
- 71.6%Electricity
- 26.6%Utility gas
- 0.7%Wood
- 0.7%Other fuel
- 0.4%No fuel used
Ontario compared to Oregon state average:
- Median household income below state average.
- Median house value significantly below state average.
- Black race population percentage significantly below state average.
- Hispanic race population percentage significantly above state average.
- Median age below state average.
- Length of stay since moving in above state average.
- Percentage of population with a bachelor's degree or higher below state average.
Ontario on our top lists:
- #88 on the list of "Top 101 cities with the highest number of thefts per 100,000 residents, excludes tourist destinations and others with a lot of outsiders visiting based on city industries data (population 5,000+)"

|
|
Total of 10 patent applications in 2008-2024.