Oakley, California Submit your own pictures of this city and show them to the world
OSM Map
General Map
Google Map
MSN Map
OSM Map
General Map
Google Map
MSN Map
OSM Map
General Map
Google Map
MSN Map
OSM Map
General Map
Google Map
MSN Map
Please wait while loading the map...
Population in 2022: 44,688 (99% urban, 1% rural). Population change since 2000: +74.4%Males: 22,554 Females: 22,134
March 2022 cost of living index in Oakley: 116.0 (more than average, U.S. average is 100) Percentage of residents living in poverty in 2022: 7.0%for White Non-Hispanic residents , 11.7% for Black residents , 9.9% for Hispanic or Latino residents , 7.7% for other race residents , 8.8% for two or more races residents )Business Search - 14 Million verified businesses
Data:
Median household income ($)
Median household income (% change since 2000)
Household income diversity
Ratio of average income to average house value (%)
Ratio of average income to average rent
Median household income ($) - White
Median household income ($) - Black or African American
Median household income ($) - Asian
Median household income ($) - Hispanic or Latino
Median household income ($) - American Indian and Alaska Native
Median household income ($) - Multirace
Median household income ($) - Other Race
Median household income for houses/condos with a mortgage ($)
Median household income for apartments without a mortgage ($)
Races - White alone (%)
Races - White alone (% change since 2000)
Races - Black alone (%)
Races - Black alone (% change since 2000)
Races - American Indian alone (%)
Races - American Indian alone (% change since 2000)
Races - Asian alone (%)
Races - Asian alone (% change since 2000)
Races - Hispanic (%)
Races - Hispanic (% change since 2000)
Races - Native Hawaiian and Other Pacific Islander alone (%)
Races - Native Hawaiian and Other Pacific Islander alone (% change since 2000)
Races - Two or more races (%)
Races - Two or more races (% change since 2000)
Races - Other race alone (%)
Races - Other race alone (% change since 2000)
Racial diversity
Unemployment (%)
Unemployment (% change since 2000)
Unemployment (%) - White
Unemployment (%) - Black or African American
Unemployment (%) - Asian
Unemployment (%) - Hispanic or Latino
Unemployment (%) - American Indian and Alaska Native
Unemployment (%) - Multirace
Unemployment (%) - Other Race
Population density (people per square mile)
Population - Males (%)
Population - Females (%)
Population - Males (%) - White
Population - Males (%) - Black or African American
Population - Males (%) - Asian
Population - Males (%) - Hispanic or Latino
Population - Males (%) - American Indian and Alaska Native
Population - Males (%) - Multirace
Population - Males (%) - Other Race
Population - Females (%) - White
Population - Females (%) - Black or African American
Population - Females (%) - Asian
Population - Females (%) - Hispanic or Latino
Population - Females (%) - American Indian and Alaska Native
Population - Females (%) - Multirace
Population - Females (%) - Other Race
Coronavirus confirmed cases (May 04, 2024)
Deaths caused by coronavirus (May 04, 2024)
Coronavirus confirmed cases (per 100k population) (May 04, 2024)
Deaths caused by coronavirus (per 100k population) (May 04, 2024)
Daily increase in number of cases (May 04, 2024)
Weekly increase in number of cases (May 04, 2024)
Cases doubled (in days) (May 04, 2024)
Hospitalized patients (Apr 18, 2022)
Negative test results (Apr 18, 2022)
Total test results (Apr 18, 2022)
COVID Vaccine doses distributed (per 100k population) (Sep 19, 2023)
COVID Vaccine doses administered (per 100k population) (Sep 19, 2023)
COVID Vaccine doses distributed (Sep 19, 2023)
COVID Vaccine doses administered (Sep 19, 2023)
Likely homosexual households (%)
Likely homosexual households (% change since 2000)
Likely homosexual households - Lesbian couples (%)
Likely homosexual households - Lesbian couples (% change since 2000)
Likely homosexual households - Gay men (%)
Likely homosexual households - Gay men (% change since 2000)
Cost of living index
Median gross rent ($)
Median contract rent ($)
Median monthly housing costs ($)
Median house or condo value ($)
Median house or condo value ($ change since 2000)
Mean house or condo value by units in structure - 1, detached ($)
Mean house or condo value by units in structure - 1, attached ($)
Mean house or condo value by units in structure - 2 ($)
Mean house or condo value by units in structure by units in structure - 3 or 4 ($)
Mean house or condo value by units in structure - 5 or more ($)
Mean house or condo value by units in structure - Boat, RV, van, etc. ($)
Mean house or condo value by units in structure - Mobile home ($)
Median house or condo value ($) - White
Median house or condo value ($) - Black or African American
Median house or condo value ($) - Asian
Median house or condo value ($) - Hispanic or Latino
Median house or condo value ($) - American Indian and Alaska Native
Median house or condo value ($) - Multirace
Median house or condo value ($) - Other Race
Median resident age
Resident age diversity
Median resident age - Males
Median resident age - Females
Median resident age - White
Median resident age - Black or African American
Median resident age - Asian
Median resident age - Hispanic or Latino
Median resident age - American Indian and Alaska Native
Median resident age - Multirace
Median resident age - Other Race
Median resident age - Males - White
Median resident age - Males - Black or African American
Median resident age - Males - Asian
Median resident age - Males - Hispanic or Latino
Median resident age - Males - American Indian and Alaska Native
Median resident age - Males - Multirace
Median resident age - Males - Other Race
Median resident age - Females - White
Median resident age - Females - Black or African American
Median resident age - Females - Asian
Median resident age - Females - Hispanic or Latino
Median resident age - Females - American Indian and Alaska Native
Median resident age - Females - Multirace
Median resident age - Females - Other Race
Commute - mean travel time to work (minutes)
Travel time to work - Less than 5 minutes (%)
Travel time to work - Less than 5 minutes (% change since 2000)
Travel time to work - 5 to 9 minutes (%)
Travel time to work - 5 to 9 minutes (% change since 2000)
Travel time to work - 10 to 19 minutes (%)
Travel time to work - 10 to 19 minutes (% change since 2000)
Travel time to work - 20 to 29 minutes (%)
Travel time to work - 20 to 29 minutes (% change since 2000)
Travel time to work - 30 to 39 minutes (%)
Travel time to work - 30 to 39 minutes (% change since 2000)
Travel time to work - 40 to 59 minutes (%)
Travel time to work - 40 to 59 minutes (% change since 2000)
Travel time to work - 60 to 89 minutes (%)
Travel time to work - 60 to 89 minutes (% change since 2000)
Travel time to work - 90 or more minutes (%)
Travel time to work - 90 or more minutes (% change since 2000)
Marital status - Never married (%)
Marital status - Now married (%)
Marital status - Separated (%)
Marital status - Widowed (%)
Marital status - Divorced (%)
Median family income ($)
Median family income (% change since 2000)
Median non-family income ($)
Median non-family income (% change since 2000)
Median per capita income ($)
Median per capita income (% change since 2000)
Median family income ($) - White
Median family income ($) - Black or African American
Median family income ($) - Asian
Median family income ($) - Hispanic or Latino
Median family income ($) - American Indian and Alaska Native
Median family income ($) - Multirace
Median family income ($) - Other Race
Median year house/condo built
Median year apartment built
Year house built - Built 2005 or later (%)
Year house built - Built 2000 to 2004 (%)
Year house built - Built 1990 to 1999 (%)
Year house built - Built 1980 to 1989 (%)
Year house built - Built 1970 to 1979 (%)
Year house built - Built 1960 to 1969 (%)
Year house built - Built 1950 to 1959 (%)
Year house built - Built 1940 to 1949 (%)
Year house built - Built 1939 or earlier (%)
Average household size
Household density (households per square mile)
Average household size - White
Average household size - Black or African American
Average household size - Asian
Average household size - Hispanic or Latino
Average household size - American Indian and Alaska Native
Average household size - Multirace
Average household size - Other Race
Occupied housing units (%)
Vacant housing units (%)
Owner occupied housing units (%)
Renter occupied housing units (%)
Vacancy status - For rent (%)
Vacancy status - For sale only (%)
Vacancy status - Rented or sold, not occupied (%)
Vacancy status - For seasonal, recreational, or occasional use (%)
Vacancy status - For migrant workers (%)
Vacancy status - Other vacant (%)
Residents with income below the poverty level (%)
Residents with income below 50% of the poverty level (%)
Children below poverty level (%)
Poor families by family type - Married-couple family (%)
Poor families by family type - Male, no wife present (%)
Poor families by family type - Female, no husband present (%)
Poverty status for native-born residents (%)
Poverty status for foreign-born residents (%)
Poverty among high school graduates not in families (%)
Poverty among people who did not graduate high school not in families (%)
Residents with income below the poverty level (%) - White
Residents with income below the poverty level (%) - Black or African American
Residents with income below the poverty level (%) - Asian
Residents with income below the poverty level (%) - Hispanic or Latino
Residents with income below the poverty level (%) - American Indian and Alaska Native
Residents with income below the poverty level (%) - Multirace
Residents with income below the poverty level (%) - Other Race
Air pollution - Air Quality Index (AQI)
Air pollution - CO
Air pollution - NO2
Air pollution - SO2
Air pollution - Ozone
Air pollution - PM10
Air pollution - PM25
Air pollution - Pb
Crime - Murders per 100,000 population
Crime - Rapes per 100,000 population
Crime - Robberies per 100,000 population
Crime - Assaults per 100,000 population
Crime - Burglaries per 100,000 population
Crime - Thefts per 100,000 population
Crime - Auto thefts per 100,000 population
Crime - Arson per 100,000 population
Crime - City-data.com crime index
Crime - Violent crime index
Crime - Property crime index
Crime - Murders per 100,000 population (5 year average)
Crime - Rapes per 100,000 population (5 year average)
Crime - Robberies per 100,000 population (5 year average)
Crime - Assaults per 100,000 population (5 year average)
Crime - Burglaries per 100,000 population (5 year average)
Crime - Thefts per 100,000 population (5 year average)
Crime - Auto thefts per 100,000 population (5 year average)
Crime - Arson per 100,000 population (5 year average)
Crime - City-data.com crime index (5 year average)
Crime - Violent crime index (5 year average)
Crime - Property crime index (5 year average)
1996 Presidential Elections Results (%) - Democratic Party (Clinton)
1996 Presidential Elections Results (%) - Republican Party (Dole)
1996 Presidential Elections Results (%) - Other
2000 Presidential Elections Results (%) - Democratic Party (Gore)
2000 Presidential Elections Results (%) - Republican Party (Bush)
2000 Presidential Elections Results (%) - Other
2004 Presidential Elections Results (%) - Democratic Party (Kerry)
2004 Presidential Elections Results (%) - Republican Party (Bush)
2004 Presidential Elections Results (%) - Other
2008 Presidential Elections Results (%) - Democratic Party (Obama)
2008 Presidential Elections Results (%) - Republican Party (McCain)
2008 Presidential Elections Results (%) - Other
2012 Presidential Elections Results (%) - Democratic Party (Obama)
2012 Presidential Elections Results (%) - Republican Party (Romney)
2012 Presidential Elections Results (%) - Other
2016 Presidential Elections Results (%) - Democratic Party (Clinton)
2016 Presidential Elections Results (%) - Republican Party (Trump)
2016 Presidential Elections Results (%) - Other
2020 Presidential Elections Results (%) - Democratic Party (Biden)
2020 Presidential Elections Results (%) - Republican Party (Trump)
2020 Presidential Elections Results (%) - Other
Ancestries Reported - Arab (%)
Ancestries Reported - Czech (%)
Ancestries Reported - Danish (%)
Ancestries Reported - Dutch (%)
Ancestries Reported - English (%)
Ancestries Reported - French (%)
Ancestries Reported - French Canadian (%)
Ancestries Reported - German (%)
Ancestries Reported - Greek (%)
Ancestries Reported - Hungarian (%)
Ancestries Reported - Irish (%)
Ancestries Reported - Italian (%)
Ancestries Reported - Lithuanian (%)
Ancestries Reported - Norwegian (%)
Ancestries Reported - Polish (%)
Ancestries Reported - Portuguese (%)
Ancestries Reported - Russian (%)
Ancestries Reported - Scotch-Irish (%)
Ancestries Reported - Scottish (%)
Ancestries Reported - Slovak (%)
Ancestries Reported - Subsaharan African (%)
Ancestries Reported - Swedish (%)
Ancestries Reported - Swiss (%)
Ancestries Reported - Ukrainian (%)
Ancestries Reported - United States (%)
Ancestries Reported - Welsh (%)
Ancestries Reported - West Indian (%)
Ancestries Reported - Other (%)
Educational Attainment - No schooling completed (%)
Educational Attainment - Less than high school (%)
Educational Attainment - High school or equivalent (%)
Educational Attainment - Less than 1 year of college (%)
Educational Attainment - 1 or more years of college (%)
Educational Attainment - Associate degree (%)
Educational Attainment - Bachelor's degree (%)
Educational Attainment - Master's degree (%)
Educational Attainment - Professional school degree (%)
Educational Attainment - Doctorate degree (%)
School Enrollment - Nursery, preschool (%)
School Enrollment - Kindergarten (%)
School Enrollment - Grade 1 to 4 (%)
School Enrollment - Grade 5 to 8 (%)
School Enrollment - Grade 9 to 12 (%)
School Enrollment - College undergrad (%)
School Enrollment - Graduate or professional (%)
School Enrollment - Not enrolled in school (%)
School enrollment - Public schools (%)
School enrollment - Private schools (%)
School enrollment - Not enrolled (%)
Median number of rooms in houses and condos
Median number of rooms in apartments
Housing units lacking complete plumbing facilities (%)
Housing units lacking complete kitchen facilities (%)
Density of houses
Urban houses (%)
Rural houses (%)
Households with people 60 years and over (%)
Households with people 65 years and over (%)
Households with people 75 years and over (%)
Households with one or more nonrelatives (%)
Households with no nonrelatives (%)
Population in households (%)
Family households (%)
Nonfamily households (%)
Population in families (%)
Family households with own children (%)
Median number of bedrooms in owner occupied houses
Mean number of bedrooms in owner occupied houses
Median number of bedrooms in renter occupied houses
Mean number of bedrooms in renter occupied houses
Median number of vehichles in owner occupied houses
Mean number of vehichles in owner occupied houses
Median number of vehichles in renter occupied houses
Mean number of vehichles in renter occupied houses
Mortgage status - with mortgage (%)
Mortgage status - with second mortgage (%)
Mortgage status - with home equity loan (%)
Mortgage status - with both second mortgage and home equity loan (%)
Mortgage status - without a mortgage (%)
Average family size
Average family size - White
Average family size - Black or African American
Average family size - Asian
Average family size - Hispanic or Latino
Average family size - American Indian and Alaska Native
Average family size - Multirace
Average family size - Other Race
Geographical mobility - Same house 1 year ago (%)
Geographical mobility - Moved within same county (%)
Geographical mobility - Moved from different county within same state (%)
Geographical mobility - Moved from different state (%)
Geographical mobility - Moved from abroad (%)
Place of birth - Born in state of residence (%)
Place of birth - Born in other state (%)
Place of birth - Native, outside of US (%)
Place of birth - Foreign born (%)
Housing units in structures - 1, detached (%)
Housing units in structures - 1, attached (%)
Housing units in structures - 2 (%)
Housing units in structures - 3 or 4 (%)
Housing units in structures - 5 to 9 (%)
Housing units in structures - 10 to 19 (%)
Housing units in structures - 20 to 49 (%)
Housing units in structures - 50 or more (%)
Housing units in structures - Mobile home (%)
Housing units in structures - Boat, RV, van, etc. (%)
House/condo owner moved in on average (years ago)
Renter moved in on average (years ago)
Year householder moved into unit - Moved in 1999 to March 2000 (%)
Year householder moved into unit - Moved in 1995 to 1998 (%)
Year householder moved into unit - Moved in 1990 to 1994 (%)
Year householder moved into unit - Moved in 1980 to 1989 (%)
Year householder moved into unit - Moved in 1970 to 1979 (%)
Year householder moved into unit - Moved in 1969 or earlier (%)
Means of transportation to work - Drove car alone (%)
Means of transportation to work - Carpooled (%)
Means of transportation to work - Public transportation (%)
Means of transportation to work - Bus or trolley bus (%)
Means of transportation to work - Streetcar or trolley car (%)
Means of transportation to work - Subway or elevated (%)
Means of transportation to work - Railroad (%)
Means of transportation to work - Ferryboat (%)
Means of transportation to work - Taxicab (%)
Means of transportation to work - Motorcycle (%)
Means of transportation to work - Bicycle (%)
Means of transportation to work - Walked (%)
Means of transportation to work - Other means (%)
Working at home (%)
Industry diversity
Most Common Industries - Agriculture, forestry, fishing and hunting, and mining (%)
Most Common Industries - Agriculture, forestry, fishing and hunting (%)
Most Common Industries - Mining, quarrying, and oil and gas extraction (%)
Most Common Industries - Construction (%)
Most Common Industries - Manufacturing (%)
Most Common Industries - Wholesale trade (%)
Most Common Industries - Retail trade (%)
Most Common Industries - Transportation and warehousing, and utilities (%)
Most Common Industries - Transportation and warehousing (%)
Most Common Industries - Utilities (%)
Most Common Industries - Information (%)
Most Common Industries - Finance and insurance, and real estate and rental and leasing (%)
Most Common Industries - Finance and insurance (%)
Most Common Industries - Real estate and rental and leasing (%)
Most Common Industries - Professional, scientific, and management, and administrative and waste management services (%)
Most Common Industries - Professional, scientific, and technical services (%)
Most Common Industries - Management of companies and enterprises (%)
Most Common Industries - Administrative and support and waste management services (%)
Most Common Industries - Educational services, and health care and social assistance (%)
Most Common Industries - Educational services (%)
Most Common Industries - Health care and social assistance (%)
Most Common Industries - Arts, entertainment, and recreation, and accommodation and food services (%)
Most Common Industries - Arts, entertainment, and recreation (%)
Most Common Industries - Accommodation and food services (%)
Most Common Industries - Other services, except public administration (%)
Most Common Industries - Public administration (%)
Occupation diversity
Most Common Occupations - Management, business, science, and arts occupations (%)
Most Common Occupations - Management, business, and financial occupations (%)
Most Common Occupations - Management occupations (%)
Most Common Occupations - Business and financial operations occupations (%)
Most Common Occupations - Computer, engineering, and science occupations (%)
Most Common Occupations - Computer and mathematical occupations (%)
Most Common Occupations - Architecture and engineering occupations (%)
Most Common Occupations - Life, physical, and social science occupations (%)
Most Common Occupations - Education, legal, community service, arts, and media occupations (%)
Most Common Occupations - Community and social service occupations (%)
Most Common Occupations - Legal occupations (%)
Most Common Occupations - Education, training, and library occupations (%)
Most Common Occupations - Arts, design, entertainment, sports, and media occupations (%)
Most Common Occupations - Healthcare practitioners and technical occupations (%)
Most Common Occupations - Health diagnosing and treating practitioners and other technical occupations (%)
Most Common Occupations - Health technologists and technicians (%)
Most Common Occupations - Service occupations (%)
Most Common Occupations - Healthcare support occupations (%)
Most Common Occupations - Protective service occupations (%)
Most Common Occupations - Fire fighting and prevention, and other protective service workers including supervisors (%)
Most Common Occupations - Law enforcement workers including supervisors (%)
Most Common Occupations - Food preparation and serving related occupations (%)
Most Common Occupations - Building and grounds cleaning and maintenance occupations (%)
Most Common Occupations - Personal care and service occupations (%)
Most Common Occupations - Sales and office occupations (%)
Most Common Occupations - Sales and related occupations (%)
Most Common Occupations - Office and administrative support occupations (%)
Most Common Occupations - Natural resources, construction, and maintenance occupations (%)
Most Common Occupations - Farming, fishing, and forestry occupations (%)
Most Common Occupations - Construction and extraction occupations (%)
Most Common Occupations - Installation, maintenance, and repair occupations (%)
Most Common Occupations - Production, transportation, and material moving occupations (%)
Most Common Occupations - Production occupations (%)
Most Common Occupations - Transportation occupations (%)
Most Common Occupations - Material moving occupations (%)
People in Group quarters - Institutionalized population (%)
People in Group quarters - Correctional institutions (%)
People in Group quarters - Federal prisons and detention centers (%)
People in Group quarters - Halfway houses (%)
People in Group quarters - Local jails and other confinement facilities (including police lockups) (%)
People in Group quarters - Military disciplinary barracks (%)
People in Group quarters - State prisons (%)
People in Group quarters - Other types of correctional institutions (%)
People in Group quarters - Nursing homes (%)
People in Group quarters - Hospitals/wards, hospices, and schools for the handicapped (%)
People in Group quarters - Hospitals/wards and hospices for chronically ill (%)
People in Group quarters - Hospices or homes for chronically ill (%)
People in Group quarters - Military hospitals or wards for chronically ill (%)
People in Group quarters - Other hospitals or wards for chronically ill (%)
People in Group quarters - Hospitals or wards for drug/alcohol abuse (%)
People in Group quarters - Mental (Psychiatric) hospitals or wards (%)
People in Group quarters - Schools, hospitals, or wards for the mentally retarded (%)
People in Group quarters - Schools, hospitals, or wards for the physically handicapped (%)
People in Group quarters - Institutions for the deaf (%)
People in Group quarters - Institutions for the blind (%)
People in Group quarters - Orthopedic wards and institutions for the physically handicapped (%)
People in Group quarters - Wards in general hospitals for patients who have no usual home elsewhere (%)
People in Group quarters - Wards in military hospitals for patients who have no usual home elsewhere (%)
People in Group quarters - Juvenile institutions (%)
People in Group quarters - Long-term care (%)
People in Group quarters - Homes for abused, dependent, and neglected children (%)
People in Group quarters - Residential treatment centers for emotionally disturbed children (%)
People in Group quarters - Training schools for juvenile delinquents (%)
People in Group quarters - Short-term care, detention or diagnostic centers for delinquent children (%)
People in Group quarters - Type of juvenile institution unknown (%)
People in Group quarters - Noninstitutionalized population (%)
People in Group quarters - College dormitories (includes college quarters off campus) (%)
People in Group quarters - Military quarters (%)
People in Group quarters - On base (%)
People in Group quarters - Barracks, unaccompanied personnel housing (UPH), (Enlisted/Officer), ;and similar group living quarters for military personnel (%)
People in Group quarters - Transient quarters for temporary residents (%)
People in Group quarters - Military ships (%)
People in Group quarters - Group homes (%)
People in Group quarters - Homes or halfway houses for drug/alcohol abuse (%)
People in Group quarters - Homes for the mentally ill (%)
People in Group quarters - Homes for the mentally retarded (%)
People in Group quarters - Homes for the physically handicapped (%)
People in Group quarters - Other group homes (%)
People in Group quarters - Religious group quarters (%)
People in Group quarters - Dormitories (%)
People in Group quarters - Agriculture workers' dormitories on farms (%)
People in Group quarters - Job Corps and vocational training facilities (%)
People in Group quarters - Other workers' dormitories (%)
People in Group quarters - Crews of maritime vessels (%)
People in Group quarters - Other nonhousehold living situations (%)
People in Group quarters - Other noninstitutional group quarters (%)
Residents speaking English at home (%)
Residents speaking English at home - Born in the United States (%)
Residents speaking English at home - Native, born elsewhere (%)
Residents speaking English at home - Foreign born (%)
Residents speaking Spanish at home (%)
Residents speaking Spanish at home - Born in the United States (%)
Residents speaking Spanish at home - Native, born elsewhere (%)
Residents speaking Spanish at home - Foreign born (%)
Residents speaking other language at home (%)
Residents speaking other language at home - Born in the United States (%)
Residents speaking other language at home - Native, born elsewhere (%)
Residents speaking other language at home - Foreign born (%)
Class of Workers - Employee of private company (%)
Class of Workers - Self-employed in own incorporated business (%)
Class of Workers - Private not-for-profit wage and salary workers (%)
Class of Workers - Local government workers (%)
Class of Workers - State government workers (%)
Class of Workers - Federal government workers (%)
Class of Workers - Self-employed workers in own not incorporated business and Unpaid family workers (%)
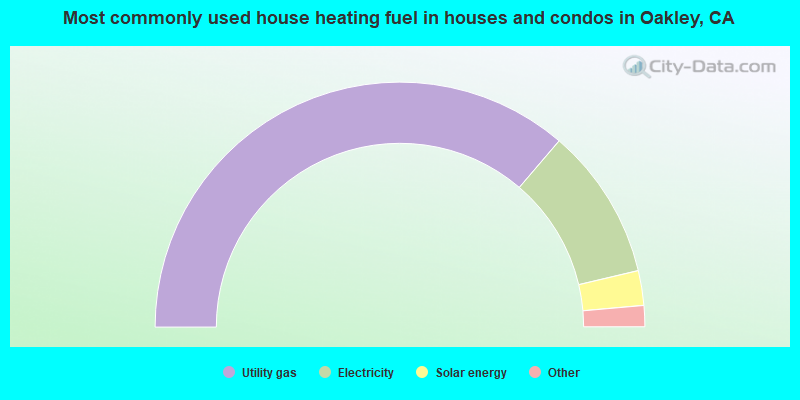
House heating fuel used in houses and condos - Utility gas (%)
House heating fuel used in houses and condos - Bottled, tank, or LP gas (%)
House heating fuel used in houses and condos - Electricity (%)
House heating fuel used in houses and condos - Fuel oil, kerosene, etc. (%)
House heating fuel used in houses and condos - Coal or coke (%)
House heating fuel used in houses and condos - Wood (%)
House heating fuel used in houses and condos - Solar energy (%)
House heating fuel used in houses and condos - Other fuel (%)
House heating fuel used in houses and condos - No fuel used (%)
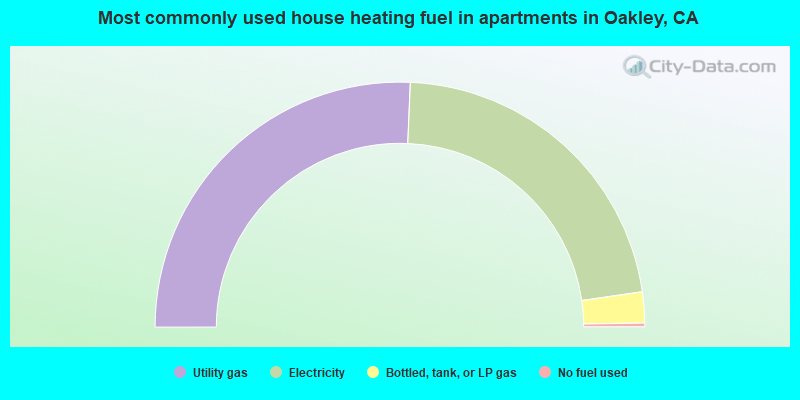
House heating fuel used in apartments - Utility gas (%)
House heating fuel used in apartments - Bottled, tank, or LP gas (%)
House heating fuel used in apartments - Electricity (%)
House heating fuel used in apartments - Fuel oil, kerosene, etc. (%)
House heating fuel used in apartments - Coal or coke (%)
House heating fuel used in apartments - Wood (%)
House heating fuel used in apartments - Solar energy (%)
House heating fuel used in apartments - Other fuel (%)
House heating fuel used in apartments - No fuel used (%)
Armed forces status - In Armed Forces (%)
Armed forces status - Civilian (%)
Armed forces status - Civilian - Veteran (%)
Armed forces status - Civilian - Nonveteran (%)
Fatal accidents locations in years 2005-2021
Fatal accidents locations in 2005
Fatal accidents locations in 2006
Fatal accidents locations in 2007
Fatal accidents locations in 2008
Fatal accidents locations in 2009
Fatal accidents locations in 2010
Fatal accidents locations in 2011
Fatal accidents locations in 2012
Fatal accidents locations in 2013
Fatal accidents locations in 2014
Fatal accidents locations in 2015
Fatal accidents locations in 2016
Fatal accidents locations in 2017
Fatal accidents locations in 2018
Fatal accidents locations in 2019
Fatal accidents locations in 2020
Fatal accidents locations in 2021
Alcohol use - People drinking some alcohol every month (%)
Alcohol use - People not drinking at all (%)
Alcohol use - Average days/month drinking alcohol
Alcohol use - Average drinks/week
Alcohol use - Average days/year people drink much
Audiometry - Average condition of hearing (%)
Audiometry - People that can hear a whisper from across a quiet room (%)
Audiometry - People that can hear normal voice from across a quiet room (%)
Audiometry - Ears ringing, roaring, buzzing (%)
Audiometry - Had a job exposure to loud noise (%)
Audiometry - Had off-work exposure to loud noise (%)
Blood Pressure & Cholesterol - Has high blood pressure (%)
Blood Pressure & Cholesterol - Checking blood pressure at home (%)
Blood Pressure & Cholesterol - Frequently checking blood cholesterol (%)
Blood Pressure & Cholesterol - Has high cholesterol level (%)
Consumer Behavior - Money monthly spent on food at supermarket/grocery store
Consumer Behavior - Money monthly spent on food at other stores
Consumer Behavior - Money monthly spent on eating out
Consumer Behavior - Money monthly spent on carryout/delivered foods
Consumer Behavior - Income spent on food at supermarket/grocery store (%)
Consumer Behavior - Income spent on food at other stores (%)
Consumer Behavior - Income spent on eating out (%)
Consumer Behavior - Income spent on carryout/delivered foods (%)
Current Health Status - General health condition (%)
Current Health Status - Blood donors (%)
Current Health Status - Has blood ever tested for HIV virus (%)
Current Health Status - Left-handed people (%)
Dermatology - People using sunscreen (%)
Diabetes - Diabetics (%)
Diabetes - Had a blood test for high blood sugar (%)
Diabetes - People taking insulin (%)
Diet Behavior & Nutrition - Diet health (%)
Diet Behavior & Nutrition - Milk product consumption (# of products/month)
Diet Behavior & Nutrition - Meals not home prepared (#/week)
Diet Behavior & Nutrition - Meals from fast food or pizza place (#/week)
Diet Behavior & Nutrition - Ready-to-eat foods (#/month)
Diet Behavior & Nutrition - Frozen meals/pizza (#/month)
Drug Use - People that ever used marijuana or hashish (%)
Drug Use - Ever used hard drugs (%)
Drug Use - Ever used any form of cocaine (%)
Drug Use - Ever used heroin (%)
Drug Use - Ever used methamphetamine (%)
Health Insurance - People covered by health insurance (%)
Kidney Conditions-Urology - Avg. # of times urinating at night
Medical Conditions - People with asthma (%)
Medical Conditions - People with anemia (%)
Medical Conditions - People with psoriasis (%)
Medical Conditions - People with overweight (%)
Medical Conditions - Elderly people having difficulties in thinking or remembering (%)
Medical Conditions - People who ever received blood transfusion (%)
Medical Conditions - People having trouble seeing even with glass/contacts (%)
Medical Conditions - People with arthritis (%)
Medical Conditions - People with gout (%)
Medical Conditions - People with congestive heart failure (%)
Medical Conditions - People with coronary heart disease (%)
Medical Conditions - People with angina pectoris (%)
Medical Conditions - People who ever had heart attack (%)
Medical Conditions - People who ever had stroke (%)
Medical Conditions - People with emphysema (%)
Medical Conditions - People with thyroid problem (%)
Medical Conditions - People with chronic bronchitis (%)
Medical Conditions - People with any liver condition (%)
Medical Conditions - People who ever had cancer or malignancy (%)
Mental Health - People who have little interest in doing things (%)
Mental Health - People feeling down, depressed, or hopeless (%)
Mental Health - People who have trouble sleeping or sleeping too much (%)
Mental Health - People feeling tired or having little energy (%)
Mental Health - People with poor appetite or overeating (%)
Mental Health - People feeling bad about themself (%)
Mental Health - People who have trouble concentrating on things (%)
Mental Health - People moving or speaking slowly or too fast (%)
Mental Health - People having thoughts they would be better off dead (%)
Oral Health - Average years since last visit a dentist
Oral Health - People embarrassed because of mouth (%)
Oral Health - People with gum disease (%)
Oral Health - General health of teeth and gums (%)
Oral Health - Average days a week using dental floss/device
Oral Health - Average days a week using mouthwash for dental problem
Oral Health - Average number of teeth
Pesticide Use - Households using pesticides to control insects (%)
Pesticide Use - Households using pesticides to kill weeds (%)
Physical Activity - People doing vigorous-intensity work activities (%)
Physical Activity - People doing moderate-intensity work activities (%)
Physical Activity - People walking or bicycling (%)
Physical Activity - People doing vigorous-intensity recreational activities (%)
Physical Activity - People doing moderate-intensity recreational activities (%)
Physical Activity - Average hours a day doing sedentary activities
Physical Activity - Average hours a day watching TV or videos
Physical Activity - Average hours a day using computer
Physical Functioning - People having limitations keeping them from working (%)
Physical Functioning - People limited in amount of work they can do (%)
Physical Functioning - People that need special equipment to walk (%)
Physical Functioning - People experiencing confusion/memory problems (%)
Physical Functioning - People requiring special healthcare equipment (%)
Prescription Medications - Average number of prescription medicines taking
Preventive Aspirin Use - Adults 40+ taking low-dose aspirin (%)
Reproductive Health - Vaginal deliveries (%)
Reproductive Health - Cesarean deliveries (%)
Reproductive Health - Deliveries resulted in a live birth (%)
Reproductive Health - Pregnancies resulted in a delivery (%)
Reproductive Health - Women breastfeeding newborns (%)
Reproductive Health - Women that had a hysterectomy (%)
Reproductive Health - Women that had both ovaries removed (%)
Reproductive Health - Women that have ever taken birth control pills (%)
Reproductive Health - Women taking birth control pills (%)
Reproductive Health - Women that have ever used Depo-Provera or injectables (%)
Reproductive Health - Women that have ever used female hormones (%)
Sexual Behavior - People 18+ that ever had sex (vaginal, anal, or oral) (%)
Sexual Behavior - Males 18+ that ever had vaginal sex with a woman (%)
Sexual Behavior - Males 18+ that ever performed oral sex on a woman (%)
Sexual Behavior - Males 18+ that ever had anal sex with a woman (%)
Sexual Behavior - Males 18+ that ever had any sex with a man (%)
Sexual Behavior - Females 18+ that ever had vaginal sex with a man (%)
Sexual Behavior - Females 18+ that ever performed oral sex on a man (%)
Sexual Behavior - Females 18+ that ever had anal sex with a man (%)
Sexual Behavior - Females 18+ that ever had any kind of sex with a woman (%)
Sexual Behavior - Average age people first had sex
Sexual Behavior - Average number of female sex partners in lifetime (males 18+)
Sexual Behavior - Average number of female vaginal sex partners in lifetime (males 18+)
Sexual Behavior - Average age people first performed oral sex on a woman (18+)
Sexual Behavior - Average number of woman performed oral sex on in lifetime (18+)
Sexual Behavior - Average number of male sex partners in lifetime (males 18+)
Sexual Behavior - Average number of male anal sex partners in lifetime (males 18+)
Sexual Behavior - Average age people first performed oral sex on a man (18+)
Sexual Behavior - Average number of male oral sex partners in lifetime (18+)
Sexual Behavior - People using protection when performing oral sex (%)
Sexual Behavior - Average number of times people have vaginal or anal sex a year
Sexual Behavior - People having sex without condom (%)
Sexual Behavior - Average number of male sex partners in lifetime (females 18+)
Sexual Behavior - Average number of male vaginal sex partners in lifetime (females 18+)
Sexual Behavior - Average number of female sex partners in lifetime (females 18+)
Sexual Behavior - Circumcised males 18+ (%)
Sleep Disorders - Average hours sleeping at night
Sleep Disorders - People that has trouble sleeping (%)
Smoking-Cigarette Use - People smoking cigarettes (%)
Taste & Smell - People 40+ having problems with smell (%)
Taste & Smell - People 40+ having problems with taste (%)
Taste & Smell - People 40+ that ever had wisdom teeth removed (%)
Taste & Smell - People 40+ that ever had tonsils teeth removed (%)
Taste & Smell - People 40+ that ever had a loss of consciousness because of a head injury (%)
Taste & Smell - People 40+ that ever had a broken nose or other serious injury to face or skull (%)
Taste & Smell - People 40+ that ever had two or more sinus infections (%)
Weight - Average height (inches)
Weight - Average weight (pounds)
Weight - Average BMI
Weight - People that are obese (%)
Weight - People that ever were obese (%)
Weight - People trying to lose weight (%)
18,508 42.7% White alone 14,181 32.7% Hispanic 3,631 8.4% Asian alone 3,605 8.3% Black alone 2,355 5.4% Two or more races 300 0.7% Native Hawaiian and Other 270 0.6% Other race alone 100 0.2% American Indian alone
According to our research of California and other state lists, there were 40 registered sex offenders living in Oakley, California as of May 03, 2024 . The ratio of all residents to sex offenders in Oakley is 998 to 1.The ratio of registered sex offenders to all residents in this city is lower than the state average.
Officers per 1,000 residents here:
0.02California average:
1.98
Latest news from Oakley, CA collected exclusively by city-data.com from local newspapers, TV, and radio stations
Ancestries: American (7.0%), Italian (4.9%), European (3.8%), English (3.1%), Nigerian (2.4%), Irish (2.0%).
Current Local Time:
Land area: 12.4 square miles.
Population density: 3,599 people per square mile (average).
6,955 residents are foreign born (8.6% Latin America , 5.2% Asia ).
This city:
16.1%California:
26.5%
Median real estate property taxes paid for housing units with mortgages in 2022: $6,359 (0.9%)Median real estate property taxes paid for housing units with no mortgage in 2022: $5,463 (0.9%)
Nearest city with pop. 50,000+: East Contra Costa, CA (3.3 miles
Nearest city with pop. 200,000+: Central Contra Costa, CA (18.6 miles
Nearest city with pop. 1,000,000+: Los Angeles, CA
Nearest cities:
Latitude: 37.99 N, Longitude: 121.72 W
Daytime population change due to commuting: -12,993 (-30.0%)Workers who live and work in this city: 5,514 (26.5%)
Area code commonly used in this area: 925
Single-family new house construction building permits:
2022: 239 buildings , average cost: $264,2002021: 488 buildings , average cost: $267,1002020: 326 buildings , average cost: $259,4002019: 262 buildings , average cost: $277,2002018: 184 buildings , average cost: $318,0002017: 162 buildings , average cost: $293,7002016: 295 buildings , average cost: $285,8002015: 235 buildings , average cost: $334,7002014: 73 buildings , average cost: $326,9002013: 195 buildings , average cost: $281,3002012: 150 buildings , average cost: $253,4002011: 77 buildings , average cost: $266,6002010: 166 buildings , average cost: $262,0002009: 210 buildings , average cost: $286,5002008: 163 buildings , average cost: $333,1002007: 277 buildings , average cost: $340,9002006: 607 buildings , average cost: $331,7002005: 524 buildings , average cost: $308,0002004: 209 buildings , average cost: $305,0002003: 261 buildings , average cost: $310,6002002: 223 buildings , average cost: $304,9002001: 207 buildings , average cost: $278,0002000: 34 buildings , average cost: $235,300Unemployment in December 2023:
Most common occupations in Oakley, CA (%)
Both Males Females
Other office and administrative support workers, including supervisors (5.2%)
Electrical equipment mechanics and other installation, maintenance, and repair workers, including supervisors (4.1%)
Other sales and related occupations, including supervisors (4.0%)
Other management occupations, except farmers and farm managers (3.8%)
Building and grounds cleaning and maintenance occupations (3.0%)
Material recording, scheduling, dispatching, and distributing workers (3.0%)
Secretaries and administrative assistants (2.8%)
Electrical equipment mechanics and other installation, maintenance, and repair workers, including supervisors (7.1%)
Other management occupations, except farmers and farm managers (4.9%)
Other sales and related occupations, including supervisors (4.4%)
Other production occupations, including supervisors (4.2%)
Building and grounds cleaning and maintenance occupations (4.1%)
Driver/sales workers and truck drivers (3.9%)
Carpenters (3.5%)
Other office and administrative support workers, including supervisors (9.6%)
Secretaries and administrative assistants (6.4%)
Cashiers (4.0%)
Customer service representatives (4.0%)
Child care workers (3.8%)
Material recording, scheduling, dispatching, and distributing workers (3.7%)
Other sales and related occupations, including supervisors (3.6%)
Earthquake activity:
Oakley-area historical earthquake activity is significantly above California state average. It is 7830% greater than the overall U.S. average. On 4/18/1906 at 13:12:21, a magnitude 7.9 (7.9 UK, Class: Major, Intensity: VIII - XII) earthquake occurred 69.9 miles away from the city center, causing $524,000,000 total damage On 10/18/1989 at 00:04:15, a magnitude 7.1 (6.5 MB, 7.1 MS, 6.9 MW, 7.0 ML) earthquake occurred 61.2 miles away from Oakley center, causing 62 deaths ( 62 shaking deaths) and 3757 injuries, causing $1,305,032,704 total damage On 7/21/1952 at 11:52:14, a magnitude 7.7 (7.7 UK) earthquake occurred 256.3 miles away from Oakley center, causing $50,000,000 total damage On 11/4/1927 at 13:51:53, a magnitude 7.5 (7.5 UK) earthquake occurred 216.3 miles away from Oakley center On 1/31/1922 at 13:17:28, a magnitude 7.6 (7.6 UK) earthquake occurred 277.6 miles away from the city center On 10/3/1915 at 06:52:48, a magnitude 7.6 (7.6 UK) earthquake occurred 284.7 miles away from the city center Magnitude types: body-wave magnitude (MB), local magnitude (ML), surface-wave magnitude (MS), moment magnitude (MW) Natural disasters: The number of natural disasters in Contra Costa County (18) is near the US average (15).Major Disasters (Presidential) Declared: 11Emergencies Declared: 3Floods: 13, Storms: 7, Winter Storms: 7, Mudslides: 5, Landslides: 4, Drought: 1, Earthquake: 1, Hurricane: 1, Tornado: 1, Wind: 1, Other: 1 (Note: some incidents may be assigned to more than one category). Hospitals and medical centers in Oakley: KC'S SUNSHINE HOMES, ANGELIC II (125 BROWNSTONE ROAD) Other hospitals and medical centers near Oakley: FMC DIABLO BRENTWOOD (Dialysis Facility, about 3 miles away; BRENTWOOD, CA)
KAISER FOUNDATION HOSPITAL - ANTIOCH (about 3 miles away; ANTIOCH, CA)
FMC EAST ANTIOCH (Dialysis Facility, about 4 miles away; ANTIOCH, CA)
LONE TREE CONV HOSP (Nursing Home, about 5 miles away; ANTIOCH, CA)
SUTTER DELTA MEDICAL CENTER (about 5 miles away; ANTIOCH, CA)
AMERICAN STAR HOME II ICF/DD-N (Hospital, about 5 miles away; ANTIOCH, CA)
ANTIOCH CONVALESCENT HOSPITAL (Nursing Home, about 5 miles away; ANTIOCH, CA)
Amtrak station near Oakley: 6 miles: ANTIOCH-PITTSBURG (ANTIOCH, I ST. & SANTA FE TRACKS) Services: public payphones, full-service food facilities, free short-term parking, free long-term parking, call for taxi service, intercity bus service, public transit connection.
Colleges/universities with over 2000 students nearest to Oakley:
Los Medanos College (about 8 miles; Pittsburg, CA ; Full-time enrollment: 5,289)
Diablo Valley College (about 20 miles; Pleasant Hill, CA ; FT enrollment: 13,015)
Las Positas College (about 21 miles; Livermore, CA ; FT enrollment: 5,112)
San Joaquin Delta College (about 22 miles; Stockton, CA ; FT enrollment: 12,167)
University of the Pacific (about 23 miles; Stockton, CA ; FT enrollment: 4,999)
Saint Mary's College of California (about 24 miles; Moraga, CA ; FT enrollment: 4,200)
Solano Community College (about 28 miles; Fairfield, CA ; FT enrollment: 5,790)
Public high school in Oakley: FREEDOM HIGH Location: 1050 NEROLY RD., Grades: 9-12)
Private high school in Oakley: FAITH CHRISTIAN LEARNING CENTER Students: 9, Location: 5400 MAIN ST, Grades: 2-12)
Public elementary/middle schools in Oakley: DELTA VISTA MIDDLE Students: 888, Location: 4901 FRANK HENGEL WAY, Grades: 6-8)O'HARA PARK MIDDLE Students: 732, Location: 1100 O'HARA AVE., Grades: 6-8)GEHRINGER ELEMENTARY Students: 405, Location: 100 SIMONI RANCH RD., Grades: KG-5)IRON HOUSE ELEMENTARY Students: 337, Location: 4801 FRANK HENGEL WAY, Grades: KG-5)OAKLEY ELEMENTARY Students: 323, Location: 501 NORCROSS LN., Grades: KG-5)VINTAGE PARKWAY ELEMENTARY Students: 321, Location: 1000 VINTAGE PKWY., Grades: KG-5)ORCHARD PARK Students: 171, Location: 5150 LIVE OAK AVE., Grades: KG-8)LAUREL ELEMENTARY Location: 1141 LAUREL RD., Grades: KG-5)
ALMOND GROVE ELEMENTARY Location: 5000 AMARYLLIS ST., Grades: KG-5)
See full list of schools located in Oakley Contra Costa County has a predicted average indoor radon screening level between 2 and 4 pCi/L (pico curies per liter) - Moderate Potential Drinking water stations with addresses in Oakley and their reported violations in the past:
CAMINO MOBILEHOME (Population served: 210, Groundwater):
Past monitoring violations:
2 routine major monitoring violations
2 minor monitoring violations
Population served: 156, Groundwater):
Past monitoring violations:
2 routine major monitoring violations
2 minor monitoring violations
Population served: 120, Groundwater):
Past monitoring violations:
Monitoring, Repeat Major (TCR) - In MAY-2005, Contaminant: Coliform (TCR). Follow-up actions: St Formal NOV issued (JUN-20-2005)
Monitoring, Repeat Major (TCR) - In MAY-2005, Contaminant: Coliform (TCR). Follow-up actions: St Formal NOV issued (JUN-20-2005)
Monitoring, Repeat Major (TCR) - In MAR-2005, Contaminant: Coliform (TCR). Follow-up actions: St Formal NOV issued (APR-25-2005)
Monitoring, Repeat Major (TCR) - In MAR-2005, Contaminant: Coliform (TCR)
Monitoring, Repeat Major (TCR) - In FEB-2005, Contaminant: Coliform (TCR). Follow-up actions: St Formal NOV issued (MAR-21-2005)
10 routine major monitoring violations
One minor monitoring violation
One other older monitoring violation
Population served: 45, Groundwater):
Past health violations:
MCL, Average - Between JUL-2011 and SEP-2011, Contaminant: Arsenic. Follow-up actions: St Formal NOV issued (JAN-09-2008), St Public Notif issued (JAN-09-2008), St AO (w/o penalty) issued (SEP-04-2009)
MCL, Average - In DEC-2008, Contaminant: Arsenic. Follow-up actions: St Formal NOV issued (2 times from JAN-09-2008 to JAN-22-2009), St AO (w/o penalty) issued (SEP-04-2009)
MCL, Average - Between JAN-2008 and MAR-2008, Contaminant: Arsenic. Follow-up actions: St Formal NOV issued (JAN-09-2008), St Public Notif issued (JAN-09-2008), St AO (w/o penalty) issued (SEP-04-2009)
Drinking water stations with addresses in Oakley that have no violations reported:
SUNSET HARBOR (Population served: 30, Primary Water Source Type: Groundwater)
Average household size: This city:
3.3 peopleCalifornia:
2.9 people
Percentage of family households: This city:
80.6%Whole state:
68.7%
Percentage of households with unmarried partners: This city:
7.8%Whole state:
7.2%
Likely homosexual households (counted as self-reported same-sex unmarried-partner households)
Lesbian couples: 0.5% of all households Gay men: 0.4% of all households
People in group quarters in Oakley in 2010:
36 people in other noninstitutional facilities
22 people in group homes for juveniles (non-correctional)
19 people in group homes intended for adults
14 people in workers' group living quarters and job corps centers
6 people in nursing facilities/skilled-nursing facilities
6 people in residential treatment centers for adults
People in group quarters in Oakley in 2000:
50 people in homes for the mentally retarded
10 people in nursing homes
5 people in other noninstitutional group quarters
2 people in religious group quarters
Banks with branches in Oakley (2011 data):
Bank of America, National Association: Oakley In-Store Branch at 2545 Main Street, branch established on 1999/07/01. Info updated 2009/11/18: Bank assets: $1,451,969.3 mil, Deposits: $1,077,176.8 mil, headquarters in Charlotte, NC, positive income , 5782 total offices , Holding Company: Bank Of America Corporation
Bank of the West: Oakley Branch at 2195 Main Street, Suite D, branch established on 1949/09/01. Info updated 2009/11/16: Bank assets: $62,408.3 mil, Deposits: $43,995.2 mil, headquarters in San Francisco, CA, positive income , 647 total offices , Holding Company: Bnp Paribas
JPMorgan Chase Bank, National Association: Oakley Branch at 2535 Main Street, branch established on 2003/10/01. Info updated 2011/11/10: Bank assets: $1,811,678.0 mil, Deposits: $1,190,738.0 mil, headquarters in Columbus, OH, positive income , International Specialization, 5577 total offices , Holding Company: Jpmorgan Chase & Co.
Bank of Agriculture and Commerce: Oakley Branch at 1070 Laurel Road, branch established on 1986/12/16. Info updated 2009/08/28: Bank assets: $469.4 mil, Deposits: $403.6 mil, headquarters in Stockton, CA, positive income , Commercial Lending Specialization, 10 total offices , Holding Company: Bac Financial Inc.
For population 15 years and over in Oakley:
Never married: 31.5%Now married: 56.5%Separated: 1.3%Widowed: 3.8%Divorced: 6.9% For population 25 years and over in Oakley:
High school or higher: 89.0%Bachelor's degree or higher: 22.8%Graduate or professional degree: 5.0%Unemployed: 3.3%Mean travel time to work (commute): 33.3 minutes
Education Gini index (Inequality in education) Here:
10.7California average:
15.5
Religion statistics for Oakley, CA (based on Contra Costa County data)
Religion Adherents Congregations Catholic 228,400 34 Evangelical Protestant 81,120 352 Other 48,553 123 Mainline Protestant 32,693 101 Black Protestant 10,395 34 Orthodox 2,435 8 None 645,429 -
Source: Clifford Grammich, Kirk Hadaway, Richard Houseal, Dale E.Jones, Alexei Krindatch, Richie Stanley and Richard H.Taylor. 2012. 2010 U.S.Religion Census: Religious Congregations & Membership Study. Association of Statisticians of American Religious Bodies. Jones, Dale E., et al. 2002. Congregations and Membership in the United States 2000. Nashville, TN: Glenmary Research Center. Graphs represent county-level data
Food Environment Statistics: Number of grocery stores : 181Contra Costa County :
1.78 / 10,000 pop.California :
2.14 / 10,000 pop.
Number of supercenters and club stores : 5Contra Costa County :
0.05 / 10,000 pop.California :
0.04 / 10,000 pop.
Number of convenience stores (no gas) : 52Contra Costa County :
0.51 / 10,000 pop.California :
0.62 / 10,000 pop.
Number of convenience stores (with gas) : 178This county :
1.75 / 10,000 pop.California :
1.49 / 10,000 pop.
Number of full-service restaurants : 683Contra Costa County :
6.73 / 10,000 pop.State :
7.42 / 10,000 pop.
Adult diabetes rate : Contra Costa County :
7.1%California :
7.3%
Adult obesity rate : Here :
22.2%California :
21.3%
Low-income preschool obesity rate : Here :
16.8%California :
17.9%
Health and Nutrition: Healthy diet rate : This city:
48.0%California:
49.4%
Average overall health of teeth and gums : Oakley:
46.5%California:
48.0%
Average BMI : Oakley:
28.8California:
28.1
People feeling badly about themselves : People not drinking alcohol at all : Average hours sleeping at night : Overweight people : This city:
34.1%California:
31.5%
General health condition : This city:
56.2%California:
56.4%
Average condition of hearing : Oakley:
81.2%California:
80.9%
More about Health and Nutrition of Oakley, CA Residents
Local government employment and payroll (March 2022)
Function
Full-time employees
Monthly full-time payroll
Average yearly full-time wage
Part-time employees
Monthly part-time payroll
Police Protection - Officers
34 $490,602 $173,154 0 $0 Streets and Highways
9 $85,832 $114,443 1 $2,048 Parks and Recreation
7 $42,917 $73,572 12 $8,042 Other Government Administration
5 $60,700 $145,680 8 $8,846 Other and Unallocable
4 $32,594 $97,782 2 $9,351 Housing and Community Development (Local)
3 $36,837 $147,348 0 $0 Financial Administration
3 $35,542 $142,168 2 $7,157 Police - Other
2 $10,254 $61,524 8 $19,446
Totals for Government
67 $795,278 $142,438 33 $54,890
Oakley government finances - Expenditure in 2017 (per resident):
Construction - Regular Highways: $4,827,000 ($108.02)
Housing and Community Development: $3,365,000 ($75.30)Central Staff Services: $791,000 ($17.70)Parks and Recreation: $547,000 ($12.24)Police Protection: $114,000 ($2.55)Current Operations - Police Protection: $8,038,000 ($179.87)
Regular Highways: $5,129,000 ($114.77)Central Staff Services: $3,343,000 ($74.81)Protective Inspection and Regulation - Other: $1,345,000 ($30.10)Parks and Recreation: $1,159,000 ($25.94)Financial Administration: $462,000 ($10.34)Health - Other: $223,000 ($4.99)Housing and Community Development: $3,000 ($0.07)General - Interest on Debt: $1,633,000 ($36.54)
Other Capital Outlay - Parks and Recreation: $745,000 ($16.67)
Oakley government finances - Revenue in 2017 (per resident):
Charges - Other: $12,999,000 ($290.88)
Regular Highways: $363,000 ($8.12)Parks and Recreation: $74,000 ($1.66)Housing and Community Development: $56,000 ($1.25)Miscellaneous - General Revenue - Other: $1,332,000 ($29.81)
Rents: $161,000 ($3.60)Interest Earnings: $154,000 ($3.45)Fines and Forfeits: $133,000 ($2.98)Donations From Private Sources: $119,000 ($2.66)Sale of Property: $50,000 ($1.12)State Intergovernmental - Highways: $775,000 ($17.34)
Other: $368,000 ($8.23)General Local Government Support: $39,000 ($0.87)Tax - Other: $6,652,000 ($148.85)
Property: $5,559,000 ($124.40)General Sales and Gross Receipts: $2,366,000 ($52.94)Public Utilities Sales: $1,543,000 ($34.53)Other License: $1,228,000 ($27.48)Other Selective Sales: $267,000 ($5.97)Documentary and Stock Transfer: $237,000 ($5.30)Occupation and Business License - Other: $147,000 ($3.29)
Oakley government finances - Debt in 2017 (per resident):
Long Term Debt - Outstanding Unspecified Public Purpose: $61,770,000 ($1382.25)
Beginning Outstanding - Unspecified Public Purpose: $56,720,000 ($1269.24)Issue, Unspecified Public Purpose: $20,050,000 ($448.67)Retired Unspecified Public Purpose: $15,000,000 ($335.66)
Oakley government finances - Cash and Securities in 2017 (per resident):
Bond Funds - Cash and Securities: $15,322,000 ($342.87)
Other Funds - Cash and Securities: $37,580,000 ($840.94)
Sinking Funds - Cash and Securities: $11,054,000 ($247.36)
6.37% of this county's 2021 resident taxpayers lived in other counties in 2020 ($134,084 average adjusted gross income )
Here:
6.37%California average:
5.19%
0.01% of residents moved from foreign countries ($98 average AGI )Contra Costa County:
0.01%California average:
0.03%
Top counties from which taxpayers relocated into this county between 2020 and 2021:
7.09% of this county's 2020 resident taxpayers moved to other counties in 2021 ($123,334 average adjusted gross income )
Here:
7.09%California average:
6.14%
0.01% of residents moved to foreign countries ($92 average AGI )Contra Costa County:
0.01%California average:
0.02%
Top counties to which taxpayers relocated from this county between 2020 and 2021:
Businesses in Oakley, CA
Name Count Name Count
7-Eleven 1 Little Caesars Pizza 1 Ace Hardware 1 MasterBrand Cabinets 3 AutoZone 1 McDonald's 1 Burger King 1 RadioShack 1 Carl\s Jr. 1 Rite Aid 1 Comfort Suites 1 Starbucks 1 Domino's Pizza 1 T-Mobile 1 FedEx 2 Taco Bell 1 GNC 1 U-Haul 2 Jack In The Box 1 UPS 1
Strongest AM radio stations in Oakley:
KATD (990 AM; 10 kW; PITTSBURG, CA; Owner: RADIO UNICA OF SACRAMENTO LICENSE CORP.)
KTRB (860 AM; 50 kW; MODESTO, CA; Owner: PAPPAS RADIO OF CALIFORNIA, A CALIFORNIA LIMITED PARTNERSHIP)
KTCT (1050 AM; 50 kW; SAN MATEO, CA; Owner: SUSQUEHANNA RADIO CORP.)
KFAX (1100 AM; 50 kW; SAN FRANCISCO, CA; Owner: GOLDEN GATE BROADCASTING CO, INC.)
KGO (810 AM; 50 kW; SAN FRANCISCO, CA; Owner: KGO-AM RADIO, INC.)
KNBR (680 AM; 50 kW; SAN FRANCISCO, CA; Owner: KNBR LICO, INC.)
KCBS (740 AM; 50 kW; SAN FRANCISCO, CA; Owner: INFINITY BROADCASTING OPERATIONS, INC.)
KIQI (1010 AM; 35 kW; SAN FRANCISCO, CA; Owner: RADIO UNICA OF SAN FRANCISCO LICENSE CORP.)
KHTK (1140 AM; 50 kW; SACRAMENTO, CA; Owner: INFINITY RADIO SUBSIDIARY OPERATIONS INC.)
KCBC (770 AM; 50 kW; RIVERBANK, CA; Owner: KIERTRON, INC.)
KSTE (650 AM; 25 kW; RANCHO CORDOVA, CA; Owner: AMFM RADIO LICENSES, L.L.C.)
KLOK (1170 AM; 50 kW; SAN JOSE, CA; Owner: ENTRAVISION HOLDINGS, LLC)
KNEW (910 AM; 20 kW; OAKLAND, CA; Owner: AMFM RADIO LICENSES, L.L.C.)
Strongest FM radio stations in Oakley:
KKSF-FM1 (103.7 FM; PLEASANTON, ETC., CA; Owner: AMFM RADIO LICENSES, L.L.C.)
KMEL-FM1 (106.1 FM; CONCORD, CA; Owner: AMFM RADIO LICENSES, L.L.C.)
KBLX-FM2 (102.9 FM; PLEASANTON, CA; Owner: ICBC BROADCAST HOLDINGS -CA, INC.)
KSOL-FM3 (98.9 FM; PLEASANTON, CA; Owner: TMS LICENSE CALIFORNIA, INC)
KFRC-FM3 (99.7 FM; WALNUT CREEK, CA; Owner: INFINITY KFRC-FM, INC.)
KZBR-FM1 (95.7 FM; WALNUT CREEK, CA; Owner: BONNEVILLE HOLDING COMPANY)
KISQ-FM3 (98.1 FM; CONCORD, CA; Owner: AMFM RADIO LICENSES, L.L.C.)
K238AC (95.5 FM; SALIDA, CA; Owner: FAMILY STATIONS, INC.)
KJOY (99.3 FM; STOCKTON, CA; Owner: CITADEL BROADCASTING COMPANY)
KZBR-FM2 (95.7 FM; LIVERMORE, ETC., CA; Owner: BONNEVILLE HOLDING COMPANY)
KFJO (92.1 FM; WALNUT CREEK, CA; Owner: CHASE RADIO PROPERTIES, L.L.C.)
KUIC (95.3 FM; VACAVILLE, CA; Owner: KUIC, INC.)
KOSO (93.1 FM; PATTERSON, CA; Owner: CAPSTAR TX LIMITED PARTNERSHIP)
KDFC-FM1 (102.1 FM; LAFAYETTE, CA; Owner: BONNEVILLE HOLDING COMPANY)
KOIT-FM2 (96.5 FM; MARTINEZ, ETC., CA; Owner: BONNEVILLE HOLDING CO. C/O KOIT(FM))
KIOI-FM1 (101.3 FM; WALNUT CREEK, CA; Owner: AMFM RADIO LICENSES, L.L.C.)
K209BZ (89.7 FM; CONCORD, CA; Owner: YOUR CHRISTIAN COMPANION NETWORK, INC.)
KUOP (91.3 FM; STOCKTON, CA; Owner: UNIVERSITY OF THE PACIFIC)
KLLC (97.3 FM; SAN FRANCISCO, CA; Owner: INFINITY BROADCASTING OPERATIONS, INC.)
KSFB-FM (100.7 FM; SAN RAFAEL, CA; Owner: GOLDEN GATE BROADCASTING COMPANY, INC.)
TV broadcast stations around Oakley:
KOVR (Channel 13; STOCKTON, CA; Owner: SCI - SACRAMENTO LICENSEE, LLC)
KXTV (Channel 10; SACRAMENTO, CA; Owner: KXTV, INC.)
KCRA-TV (Channel 3; SACRAMENTO, CA; Owner: KCRA HEARST-ARGYLE TELEVISION, INC.)
KUVS (Channel 19; MODESTO, CA; Owner: KUVS LICENSE PARTNERSHIP, G.P.)
KSPX (Channel 29; SACRAMENTO, CA; Owner: PAXSON SACRAMENTO LICENSE, INC.)
KTXL (Channel 40; SACRAMENTO, CA; Owner: CHANNEL 40, INC.)
KQCA (Channel 58; STOCKTON, CA; Owner: KCRA HEARST-ARGYLE TELEVISION, INC.)
KVIE (Channel 6; SACRAMENTO, CA; Owner: KVIE, INC.)
KMAX-TV (Channel 31; SACRAMENTO, CA; Owner: UPN STATIONS GROUP INC.)
KQED (Channel 9; SAN FRANCISCO, CA; Owner: KQED, INC.)
KTNC-TV (Channel 42; CONCORD, CA; Owner: KTNC LICENSE, LLC)
KMMK-LP (Channel 14; SACRAMENTO, CA; Owner: CABALLERO TELEVISION TEXAS, L.L.C.)
KEZT-CA (Channel 23; SACRAMENTO, CA; Owner: TELEFUTURA SACRAMENTO LLC)
KGO-TV (Channel 7; SAN FRANCISCO, CA; Owner: KGO TELEVISION, INC.)
KFTL (Channel 64; STOCKTON, CA; Owner: FAMILY STATIONS, INC.)
KBIT-CA (Channel 28; SAN FRANCISCO, ETC., CA; Owner: POLAR BROADCASTING, INC.)
KDTS-CA (Channel 52; STOCKTON, CA; Owner: WORD OF GOD FELLOWSHIP, INC.)
National Bridge Inventory (NBI) Statistics 18 Number of bridges223ft / 68.1m Total length $470,000 Total costs74,461 Total average daily traffic9,399 Total average daily truck traffic
New bridges - historical statistics
1 1920-1929 3 1930-1939 1 1940-1949 1 1950-1959 2 1960-1969 1 1980-1989 5 1990-1999 1 2000-2009 3 2010-2019
See full National Bridge Inventory statistics for Oakley, CA
Home Mortgage Disclosure Act Aggregated Statistics For Year 2009(Based on 3 partial tracts) A) FHA, FSA/RHS & VA B) Conventional C) Refinancings D) Home Improvement Loans F) Non-occupant Loans on G) Loans On Manufactured Number Average Value Number Average Value Number Average Value Number Average Value Number Average Value Number Average Value
LOANS ORIGINATED 384 $245,496 193 $196,393 290 $237,553 7 $60,629 74 $156,319 1 $172,700 APPLICATIONS APPROVED, NOT ACCEPTED 25 $262,706 25 $216,804 43 $251,562 3 $46,117 10 $177,589 1 $23,050 APPLICATIONS DENIED 69 $262,552 52 $205,023 152 $271,984 8 $144,175 26 $186,765 1 $197,580 APPLICATIONS WITHDRAWN 38 $244,429 22 $198,404 74 $240,443 3 $64,153 8 $175,578 0 $0 FILES CLOSED FOR INCOMPLETENESS 10 $244,450 5 $279,588 18 $251,050 1 $82,320 2 $338,930 0 $0
Aggregated Statistics For Year 2008(Based on 3 partial tracts) A) FHA, FSA/RHS & VA B) Conventional C) Refinancings D) Home Improvement Loans E) Loans on Dwellings For 5+ Families F) Non-occupant Loans on G) Loans On Manufactured Number Average Value Number Average Value Number Average Value Number Average Value Number Average Value Number Average Value Number Average Value
LOANS ORIGINATED 265 $281,390 305 $253,486 147 $252,605 22 $96,353 1 $1,185,480 78 $186,276 2 $142,755 APPLICATIONS APPROVED, NOT ACCEPTED 28 $314,728 80 $286,602 45 $290,267 5 $102,316 0 $0 17 $190,818 1 $92,780 APPLICATIONS DENIED 64 $325,712 119 $286,127 218 $334,036 36 $139,281 0 $0 31 $231,778 2 $39,625 APPLICATIONS WITHDRAWN 29 $342,980 46 $279,522 67 $333,799 6 $125,693 0 $0 14 $217,368 3 $331,277 FILES CLOSED FOR INCOMPLETENESS 5 $273,634 19 $287,672 27 $294,282 3 $248,480 0 $0 7 $202,510 0 $0
Aggregated Statistics For Year 2007(Based on 3 partial tracts) A) FHA, FSA/RHS & VA B) Conventional C) Refinancings D) Home Improvement Loans E) Loans on Dwellings For 5+ Families F) Non-occupant Loans on G) Loans On Manufactured Number Average Value Number Average Value Number Average Value Number Average Value Number Average Value Number Average Value Number Average Value
LOANS ORIGINATED 2 $425,010 526 $323,013 639 $319,032 101 $203,626 0 $0 67 $323,274 3 $167,027 APPLICATIONS APPROVED, NOT ACCEPTED 1 $204,820 175 $364,210 199 $345,434 34 $187,488 0 $0 21 $329,507 1 $52,690 APPLICATIONS DENIED 0 $0 313 $379,376 616 $379,157 141 $219,060 0 $0 61 $357,434 6 $123,542 APPLICATIONS WITHDRAWN 1 $268,710 129 $380,327 221 $376,839 26 $240,634 1 $596,030 22 $342,015 0 $0 FILES CLOSED FOR INCOMPLETENESS 0 $0 26 $376,257 86 $390,509 9 $160,103 0 $0 2 $324,890 0 $0
Aggregated Statistics For Year 2006(Based on 3 partial tracts) B) Conventional C) Refinancings D) Home Improvement Loans E) Loans on Dwellings For 5+ Families F) Non-occupant Loans on G) Loans On Manufactured Number Average Value Number Average Value Number Average Value Number Average Value Number Average Value Number Average Value
LOANS ORIGINATED 1,054 $317,830 1,189 $334,991 169 $230,335 0 $0 129 $325,630 4 $164,865 APPLICATIONS APPROVED, NOT ACCEPTED 290 $326,544 265 $337,230 36 $216,587 0 $0 36 $306,375 2 $130,080 APPLICATIONS DENIED 415 $330,053 581 $370,093 157 $209,600 1 $326,660 57 $367,478 3 $96,933 APPLICATIONS WITHDRAWN 223 $356,640 359 $344,259 32 $249,390 0 $0 28 $343,160 0 $0 FILES CLOSED FOR INCOMPLETENESS 50 $293,219 86 $360,493 8 $334,062 0 $0 9 $315,653 1 $289,780
Aggregated Statistics For Year 2005(Based on 3 partial tracts) B) Conventional C) Refinancings D) Home Improvement Loans F) Non-occupant Loans on G) Loans On Manufactured Number Average Value Number Average Value Number Average Value Number Average Value Number Average Value
LOANS ORIGINATED 942 $307,952 1,595 $327,776 178 $229,678 175 $305,840 4 $295,975 APPLICATIONS APPROVED, NOT ACCEPTED 203 $307,190 240 $340,753 26 $200,448 26 $288,045 2 $171,565 APPLICATIONS DENIED 330 $327,465 593 $336,007 127 $175,086 49 $309,470 5 $154,962 APPLICATIONS WITHDRAWN 192 $309,723 406 $324,611 46 $236,658 42 $312,466 1 $142,030 FILES CLOSED FOR INCOMPLETENESS 43 $309,193 115 $343,364 11 $239,724 10 $333,679 0 $0
Aggregated Statistics For Year 2004(Based on 3 partial tracts) A) FHA, FSA/RHS & VA B) Conventional C) Refinancings D) Home Improvement Loans E) Loans on Dwellings For 5+ Families F) Non-occupant Loans on G) Loans On Manufactured Number Average Value Number Average Value Number Average Value Number Average Value Number Average Value Number Average Value Number Average Value
LOANS ORIGINATED 1 $336,150 801 $257,013 1,455 $261,379 162 $191,958 1 $535,440 134 $232,317 5 $176,338 APPLICATIONS APPROVED, NOT ACCEPTED 0 $0 127 $254,515 247 $268,277 22 $126,618 0 $0 15 $260,562 3 $98,170 APPLICATIONS DENIED 0 $0 208 $257,509 482 $268,907 95 $110,020 1 $217,340 43 $258,720 3 $212,713 APPLICATIONS WITHDRAWN 1 $187,700 124 $275,169 447 $262,015 41 $194,679 0 $0 17 $257,201 0 $0 FILES CLOSED FOR INCOMPLETENESS 0 $0 32 $240,553 86 $281,057 10 $121,980 0 $0 1 $231,830 0 $0
Aggregated Statistics For Year 2003(Based on 3 partial tracts) A) FHA, FSA/RHS & VA B) Conventional C) Refinancings D) Home Improvement Loans F) Non-occupant Loans on Number Average Value Number Average Value Number Average Value Number Average Value Number Average Value
LOANS ORIGINATED 32 $237,894 710 $217,905 2,156 $211,301 82 $55,326 124 $195,686 APPLICATIONS APPROVED, NOT ACCEPTED 3 $196,277 101 $243,533 356 $217,541 16 $62,089 19 $210,621 APPLICATIONS DENIED 4 $232,602 117 $208,946 591 $217,395 65 $57,839 28 $215,326 APPLICATIONS WITHDRAWN 3 $269,807 104 $233,268 474 $224,027 25 $84,730 16 $222,904 FILES CLOSED FOR INCOMPLETENESS 0 $0 22 $241,321 73 $235,322 5 $54,060 5 $224,174
Aggregated Statistics For Year 2002(Based on 1 partial tract) A) FHA, FSA/RHS & VA B) Conventional C) Refinancings D) Home Improvement Loans F) Non-occupant Loans on Number Average Value Number Average Value Number Average Value Number Average Value Number Average Value
LOANS ORIGINATED 30 $234,923 273 $207,119 459 $193,603 20 $44,258 36 $183,402 APPLICATIONS APPROVED, NOT ACCEPTED 3 $260,807 30 $228,205 81 $200,719 17 $36,843 3 $180,677 APPLICATIONS DENIED 4 $192,475 53 $211,858 120 $188,217 20 $34,938 7 $200,120 APPLICATIONS WITHDRAWN 6 $227,875 50 $239,796 94 $195,618 11 $50,054 5 $172,554 FILES CLOSED FOR INCOMPLETENESS 0 $0 30 $243,989 43 $219,161 0 $0 1 $335,230
Aggregated Statistics For Year 2001(Based on 1 partial tract) A) FHA, FSA/RHS & VA B) Conventional C) Refinancings D) Home Improvement Loans E) Loans on Dwellings For 5+ Families F) Non-occupant Loans on Number Average Value Number Average Value Number Average Value Number Average Value Number Average Value Number Average Value
LOANS ORIGINATED 39 $217,862 171 $189,523 406 $173,144 22 $36,612 1 $118,550 22 $165,847 APPLICATIONS APPROVED, NOT ACCEPTED 3 $207,680 24 $208,117 51 $155,094 7 $33,213 0 $0 3 $169,480 APPLICATIONS DENIED 3 $229,193 35 $166,908 121 $167,274 20 $41,624 0 $0 5 $172,948 APPLICATIONS WITHDRAWN 5 $216,942 57 $211,214 93 $163,765 8 $20,088 0 $0 3 $106,693 FILES CLOSED FOR INCOMPLETENESS 0 $0 6 $253,342 28 $170,766 1 $52,690 0 $0 0 $0
Aggregated Statistics For Year 2000(Based on 1 partial tract) A) FHA, FSA/RHS & VA B) Conventional C) Refinancings D) Home Improvement Loans E) Loans on Dwellings For 5+ Families F) Non-occupant Loans on Number Average Value Number Average Value Number Average Value Number Average Value Number Average Value Number Average Value
LOANS ORIGINATED 64 $183,523 156 $139,184 95 $124,399 24 $28,649 1 $123,160 13 $135,672 APPLICATIONS APPROVED, NOT ACCEPTED 6 $157,955 16 $159,381 20 $140,216 11 $29,637 0 $0 1 $84,300 APPLICATIONS DENIED 5 $162,674 20 $164,354 74 $117,925 14 $23,051 0 $0 3 $102,740 APPLICATIONS WITHDRAWN 3 $179,797 22 $158,932 49 $125,967 3 $27,003 0 $0 2 $132,710 FILES CLOSED FOR INCOMPLETENESS 1 $283,200 8 $170,742 30 $153,432 1 $8,560 0 $0 1 $84,300
Aggregated Statistics For Year 1999(Based on 3 partial tracts) A) FHA, FSA/RHS & VA B) Conventional C) Refinancings D) Home Improvement Loans E) Loans on Dwellings For 5+ Families F) Non-occupant Loans on Number Average Value Number Average Value Number Average Value Number Average Value Number Average Value Number Average Value
LOANS ORIGINATED 159 $154,389 287 $128,440 468 $125,549 80 $29,749 3 $89,843 37 $112,426 APPLICATIONS APPROVED, NOT ACCEPTED 12 $134,858 24 $126,166 107 $127,236 42 $33,467 2 $143,700 12 $100,262 APPLICATIONS DENIED 15 $151,936 66 $134,436 277 $112,788 73 $28,247 1 $70,790 11 $108,465 APPLICATIONS WITHDRAWN 14 $142,521 72 $167,199 198 $134,849 6 $25,845 0 $0 6 $132,748 FILES CLOSED FOR INCOMPLETENESS 4 $133,285 12 $134,191 53 $127,582 2 $27,995 0 $0 4 $137,735
Detailed HMDA statistics for the following Tracts:
3020.02
, 3020.03 , 3020.04
Private Mortgage Insurance Companies Aggregated Statistics For Year 2009(Based on 3 partial tracts) A) Conventional B) Refinancings Number Average Value Number Average Value
LOANS ORIGINATED 30 $232,122 2 $237,375 APPLICATIONS APPROVED, NOT ACCEPTED 12 $283,682 3 $329,500 APPLICATIONS DENIED 8 $240,289 2 $418,280 APPLICATIONS WITHDRAWN 5 $188,162 1 $138,050 FILES CLOSED FOR INCOMPLETENESS 3 $326,117 1 $98,130
Aggregated Statistics For Year 2008(Based on 3 partial tracts) A) Conventional B) Refinancings C) Non-occupant Loans on D) Loans On Manufactured Number Average Value Number Average Value Number Average Value Number Average Value
LOANS ORIGINATED 118 $318,086 15 $344,890 3 $271,767 1 $274,640 APPLICATIONS APPROVED, NOT ACCEPTED 54 $366,511 15 $350,727 3 $329,413 0 $0 APPLICATIONS DENIED 14 $251,879 0 $0 3 $228,090 0 $0 APPLICATIONS WITHDRAWN 6 $314,745 0 $0 0 $0 0 $0 FILES CLOSED FOR INCOMPLETENESS 2 $294,485 2 $441,260 1 $480,570 0 $0
Aggregated Statistics For Year 2007(Based on 3 partial tracts) A) Conventional B) Refinancings C) Non-occupant Loans on Number Average Value Number Average Value Number Average Value
LOANS ORIGINATED 42 $400,688 27 $435,541 4 $293,480 APPLICATIONS APPROVED, NOT ACCEPTED 12 $430,294 12 $467,694 1 $232,920 APPLICATIONS DENIED 3 $578,327 2 $439,580 1 $249,960 APPLICATIONS WITHDRAWN 4 $411,298 6 $513,573 0 $0 FILES CLOSED FOR INCOMPLETENESS 0 $0 0 $0 0 $0
Aggregated Statistics For Year 2006(Based on 3 partial tracts) A) Conventional B) Refinancings C) Non-occupant Loans on Number Average Value Number Average Value Number Average Value
LOANS ORIGINATED 10 $415,499 11 $486,925 1 $413,690 APPLICATIONS APPROVED, NOT ACCEPTED 4 $491,072 4 $424,222 0 $0 APPLICATIONS DENIED 1 $384,040 0 $0 0 $0 APPLICATIONS WITHDRAWN 2 $462,565 0 $0 0 $0 FILES CLOSED FOR INCOMPLETENESS 1 $490,660 0 $0 0 $0
Aggregated Statistics For Year 2005(Based on 3 partial tracts) A) Conventional B) Refinancings C) Non-occupant Loans on Number Average Value Number Average Value Number Average Value
LOANS ORIGINATED 5 $421,866 15 $388,705 1 $231,780 APPLICATIONS APPROVED, NOT ACCEPTED 1 $427,210 4 $340,282 2 $319,970 APPLICATIONS DENIED 0 $0 1 $428,040 0 $0 APPLICATIONS WITHDRAWN 1 $276,610 0 $0 0 $0 FILES CLOSED FOR INCOMPLETENESS 0 $0 0 $0 0 $0
Aggregated Statistics For Year 2004(Based on 3 partial tracts) A) Conventional B) Refinancings C) Non-occupant Loans on Number Average Value Number Average Value Number Average Value
LOANS ORIGINATED 14 $331,471 19 $325,426 3 $316,977 APPLICATIONS APPROVED, NOT ACCEPTED 3 $289,843 10 $270,797 2 $311,610 APPLICATIONS DENIED 0 $0 1 $197,700 0 $0 APPLICATIONS WITHDRAWN 0 $0 3 $286,497 0 $0 FILES CLOSED FOR INCOMPLETENESS 0 $0 1 $170,430 0 $0
Aggregated Statistics For Year 2003(Based on 3 partial tracts) A) Conventional B) Refinancings C) Non-occupant Loans on Number Average Value Number Average Value Number Average Value
LOANS ORIGINATED 39 $293,384 61 $263,118 3 $218,353 APPLICATIONS APPROVED, NOT ACCEPTED 10 $300,412 25 $244,007 0 $0 APPLICATIONS DENIED 1 $441,620 0 $0 0 $0 APPLICATIONS WITHDRAWN 1 $335,180 3 $290,633 0 $0 FILES CLOSED FOR INCOMPLETENESS 0 $0 1 $272,630 0 $0
Aggregated Statistics For Year 2002(Based on 1 partial tract) A) Conventional B) Refinancings C) Non-occupant Loans on Number Average Value Number Average Value Number Average Value
LOANS ORIGINATED 20 $278,686 20 $222,903 2 $205,485 APPLICATIONS APPROVED, NOT ACCEPTED 7 $263,064 7 $195,793 0 $0 APPLICATIONS DENIED 3 $261,683 1 $19,100 3 $201,970 APPLICATIONS WITHDRAWN 0 $0 1 $300,320 1 $134,350 FILES CLOSED FOR INCOMPLETENESS 0 $0 0 $0 0 $0
Aggregated Statistics For Year 2001(Based on 1 partial tract) A) Conventional B) Refinancings C) Non-occupant Loans on Number Average Value Number Average Value Number Average Value
LOANS ORIGINATED 32 $231,086 28 $201,273 1 $248,290 APPLICATIONS APPROVED, NOT ACCEPTED 5 $190,598 7 $198,239 0 $0 APPLICATIONS DENIED 0 $0 1 $171,890 0 $0 APPLICATIONS WITHDRAWN 1 $143,570 3 $216,020 0 $0 FILES CLOSED FOR INCOMPLETENESS 0 $0 0 $0 0 $0
Aggregated Statistics For Year 2000(Based on 1 partial tract) A) Conventional B) Refinancings C) Non-occupant Loans on Number Average Value Number Average Value Number Average Value
LOANS ORIGINATED 36 $186,201 8 $188,689 2 $163,990 APPLICATIONS APPROVED, NOT ACCEPTED 3 $162,453 3 $167,723 1 $100,770 APPLICATIONS DENIED 3 $189,677 0 $0 0 $0 APPLICATIONS WITHDRAWN 2 $194,615 0 $0 1 $201,530 FILES CLOSED FOR INCOMPLETENESS 1 $81,670 0 $0 0 $0
Aggregated Statistics For Year 1999(Based on 3 partial tracts) A) Conventional B) Refinancings C) Non-occupant Loans on Number Average Value Number Average Value Number Average Value
LOANS ORIGINATED 68 $167,946 78 $155,009 4 $130,605 APPLICATIONS APPROVED, NOT ACCEPTED 4 $167,100 20 $152,912 1 $82,080 APPLICATIONS DENIED 4 $178,302 2 $187,130 0 $0 APPLICATIONS WITHDRAWN 1 $185,190 4 $169,012 1 $92,340 FILES CLOSED FOR INCOMPLETENESS 1 $124,150 1 $177,500 1 $58,480
Detailed PMIC statistics for the following Tracts:
3020.02
, 3020.03 , 3020.04
Most common first names in Oakley, CA among deceased individuals Name Count Lived (average)
John 66 75.2 years William 56 72.6 years Robert 53 70.9 years James 43 73.1 years Mary 39 81.4 years Frank 33 78.0 years George 31 72.7 years Charles 26 73.3 years Donald 24 70.5 years Joseph 24 74.8 years
Most common last names in Oakley, CA among deceased individuals Last name Count Lived (average)
Smith 27 73.0 years Garcia 19 72.9 years Johnson 18 74.2 years Jones 17 75.8 years Davis 15 67.5 years Brown 13 67.3 years Sanchez 11 81.6 years Martin 10 80.6 years Morales 10 72.4 years Clark 10 80.7 years
Oakley compared to California state average:
Unemployed percentage significantly below state average. Black race population percentage above state average. Renting percentage below state average. Number of rooms per house above state average. House age significantly below state average.
#22 on the list of "Top 100 cities with longest commuting times (pop. 5,000+)"
#37 on the list of "Top 100 low-educated but high-earning cities (pop. 5,000+)"
#89 on the list of "Top 101 cities with the most residents born in Europe, n.e.c. (population 500+)"
#10 on the list of "Top 101 counties with the largest increase in the number of infant deaths per 1000 residents 2000-2006 to 2007-2013 (pop. 50,000+)"
#15 on the list of "Top 101 counties with the lowest Sulfur Oxides Annual air pollution readings in 2012 (µg/m3 )"
#17 on the list of "Top 101 counties with the highest Nitrogen Dioxide air pollution readings in 2012 (ppm)"
#31 on the list of "Top 101 counties with the highest percentage of residents that drank alcohol in the past 30 days"
#34 on the list of "Top 101 counties with the highest surface withdrawal of fresh water for public supply (pop. 50,000+)"
Top Patent Applicants
Norman Holt (7)
Arthur J. Barajas (4)
Jeffrey Paul Munoz (3)
Raphael Hercules Sutton (3)
Gunther A. Koblmiller (2)
Clark S. Davis (2)
Brian P. Baillargeon (2)
Mike Lindsay (2)
Michael Shrout (2)
Dustin J. Sterlino (1)
Total of 45 patent applications in 2008-2024.


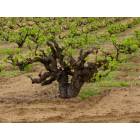


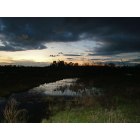


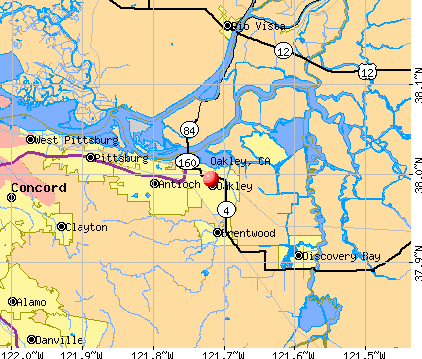


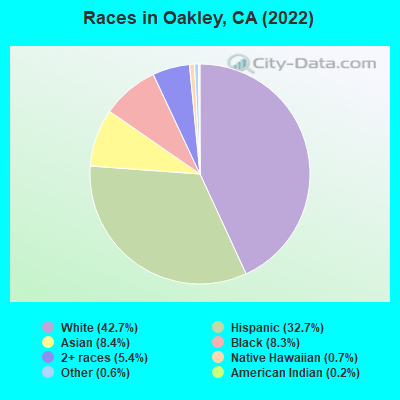
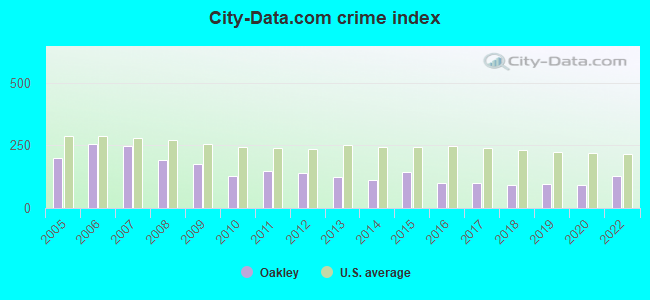
 Recent articles from our blog. Our writers, many of them Ph.D. graduates or candidates, create easy-to-read articles on a wide variety of topics.

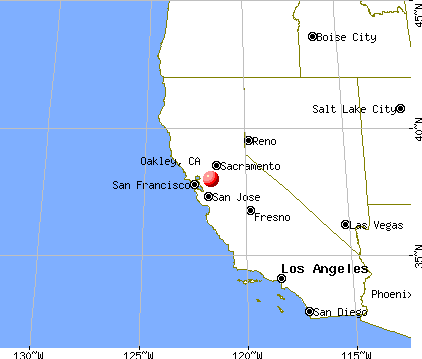
 , pop. 73,778).
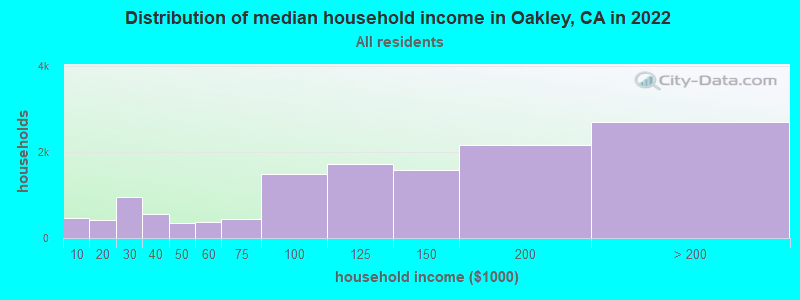
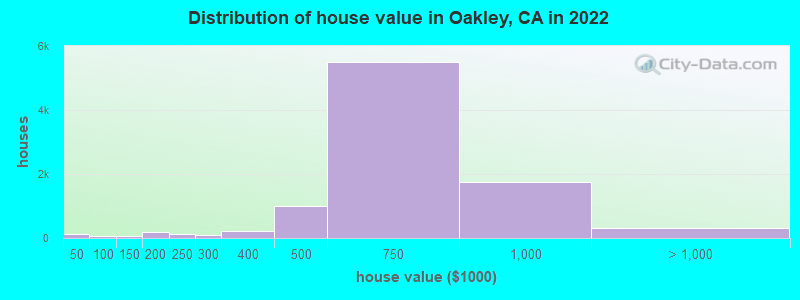
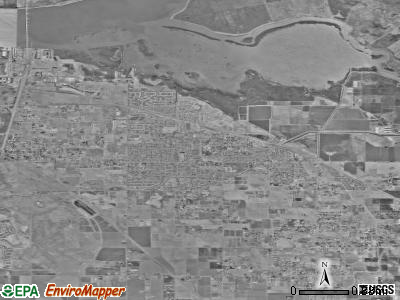
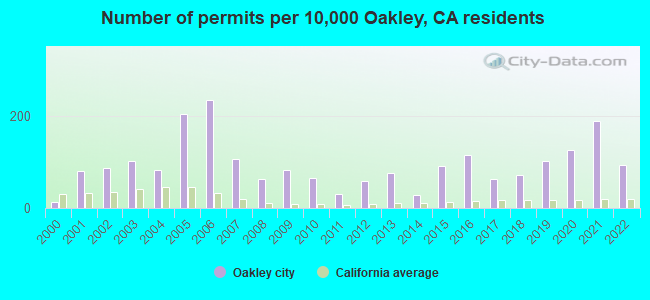
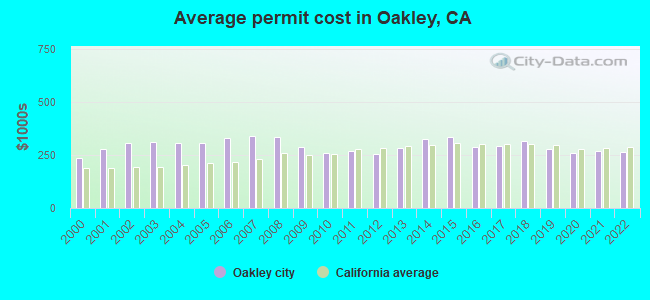
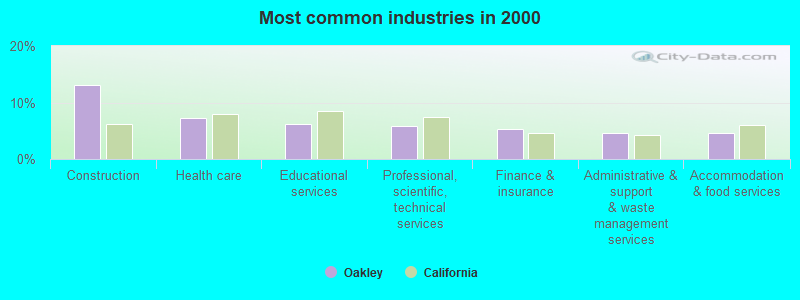
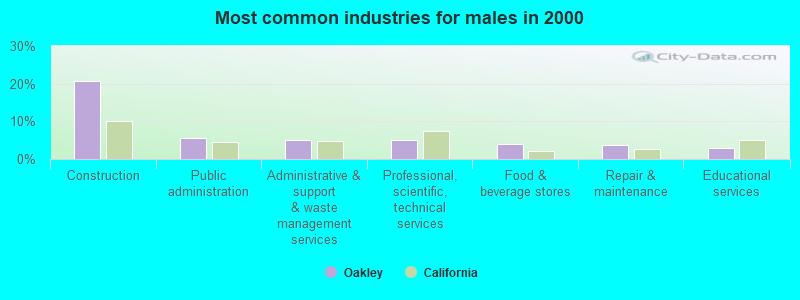
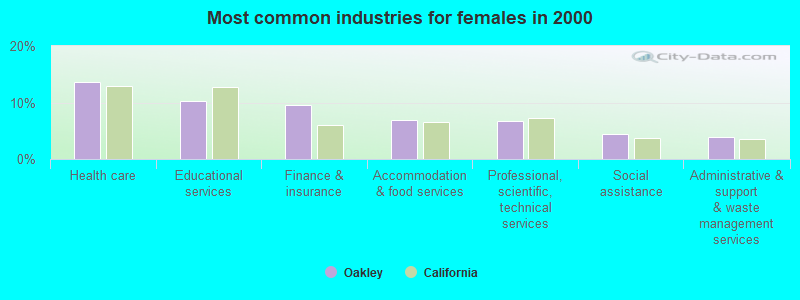
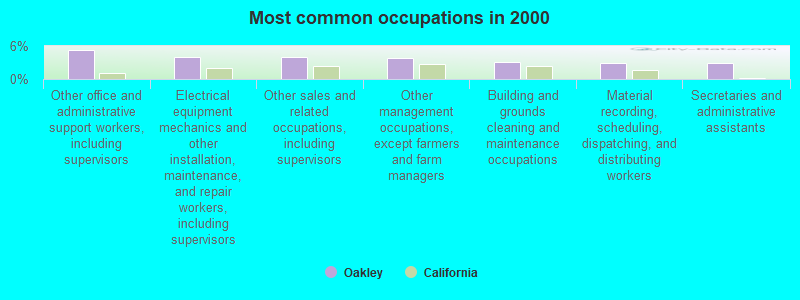
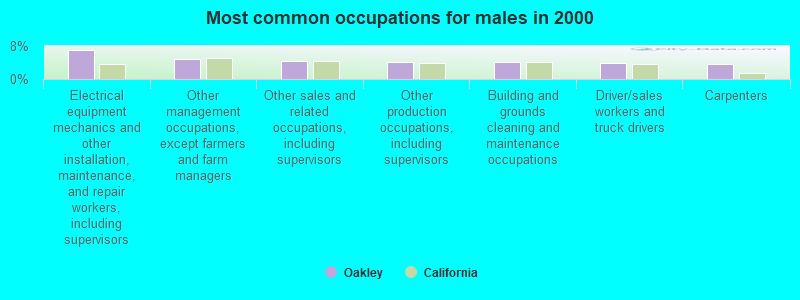
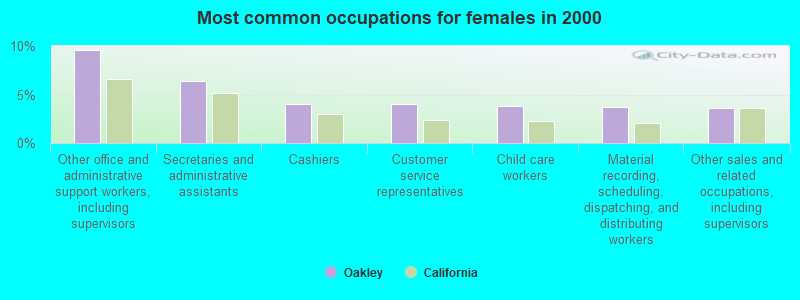

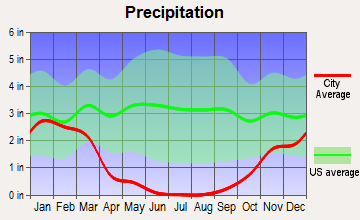
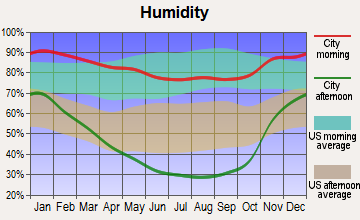
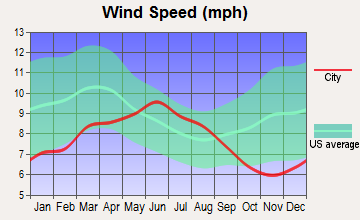
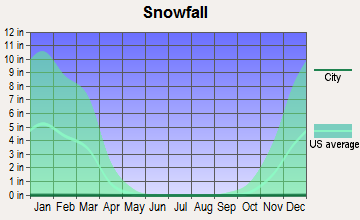
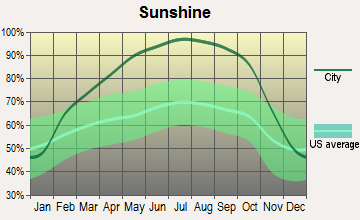
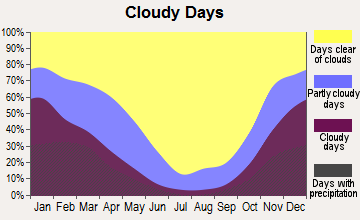
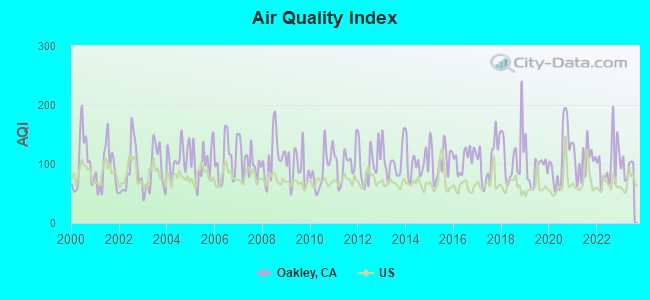
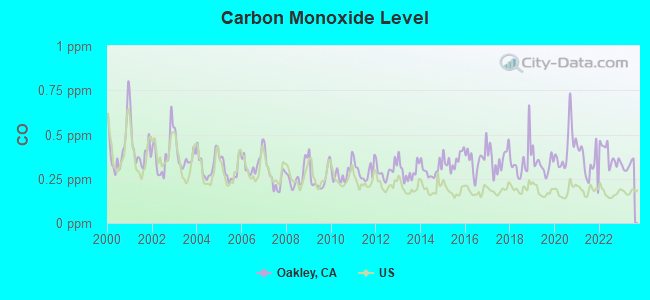
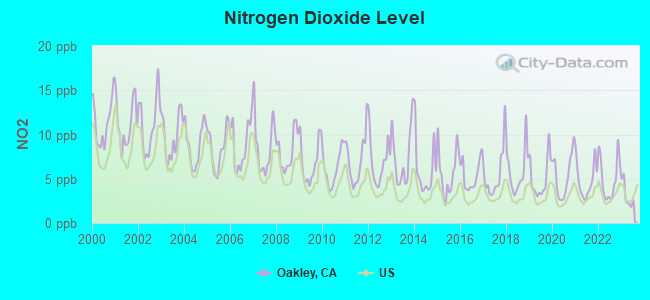
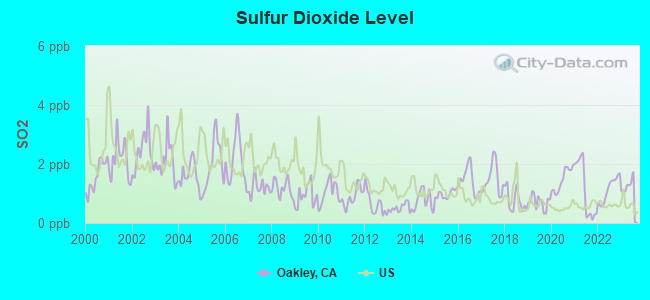
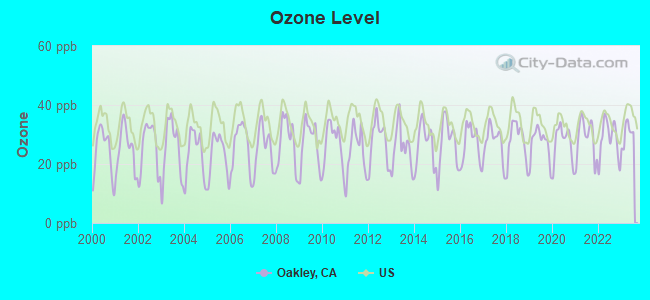
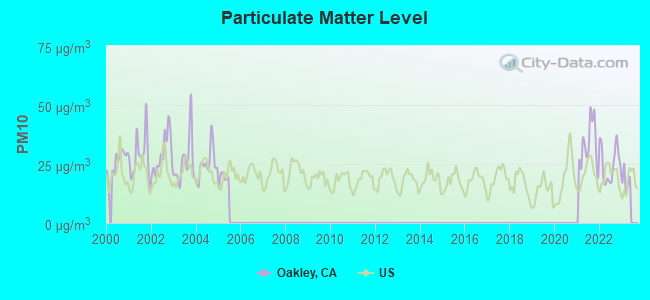
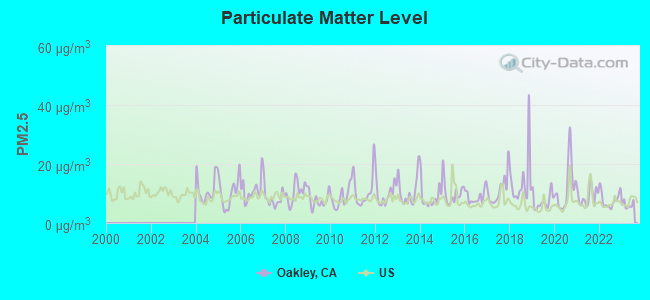
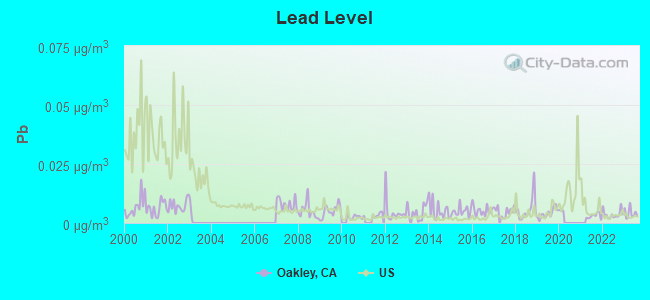
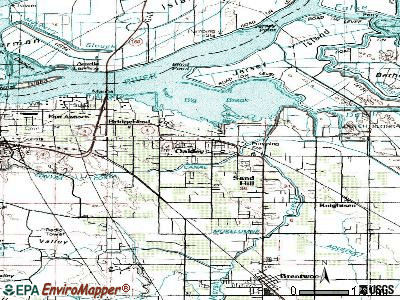
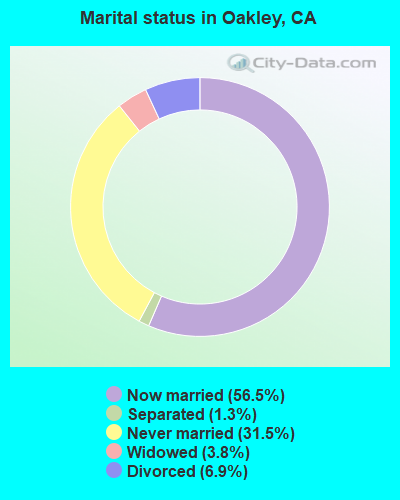
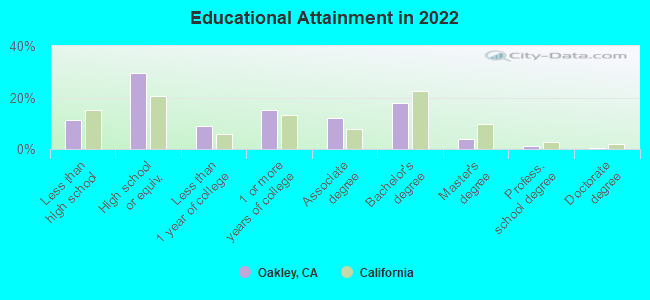
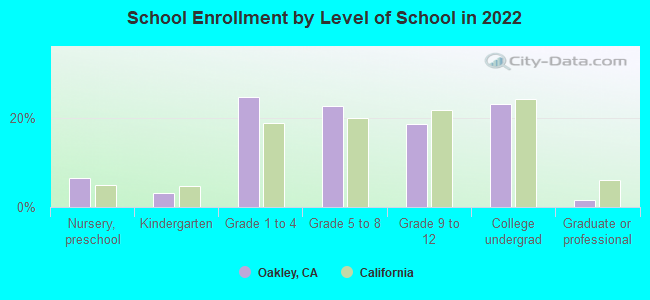
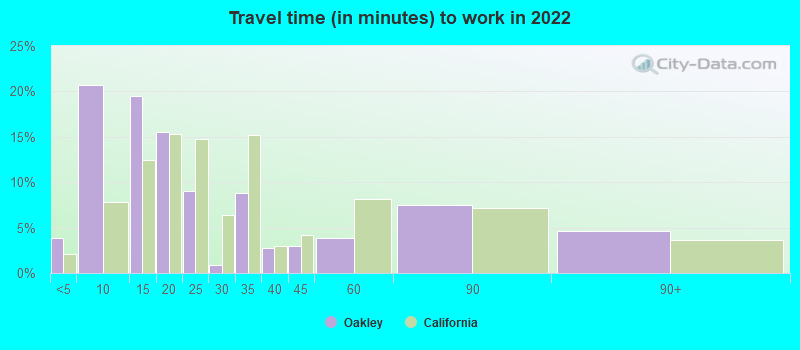
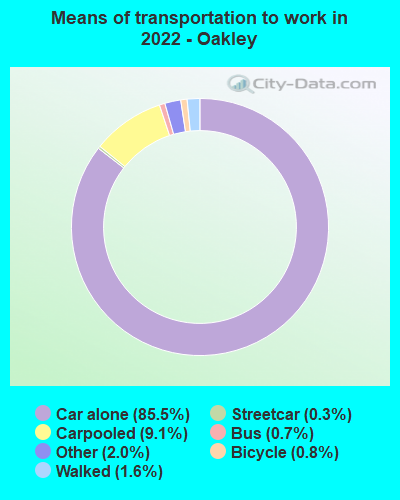


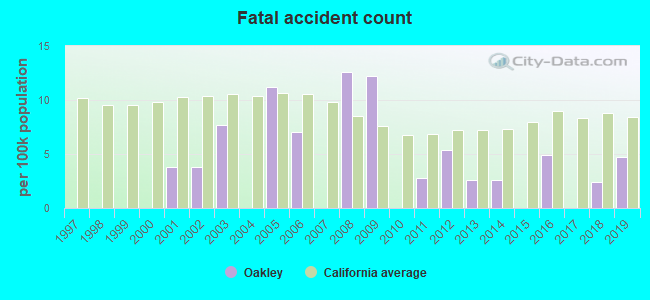
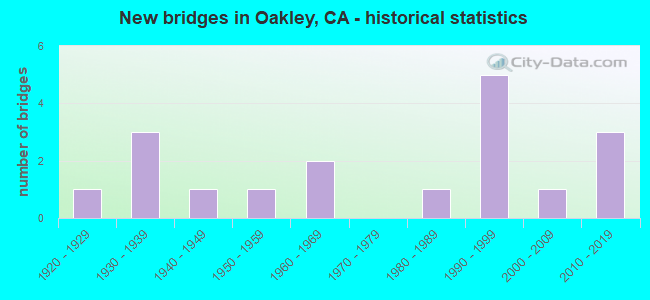
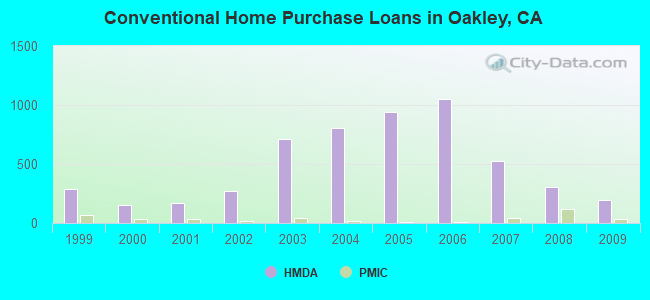
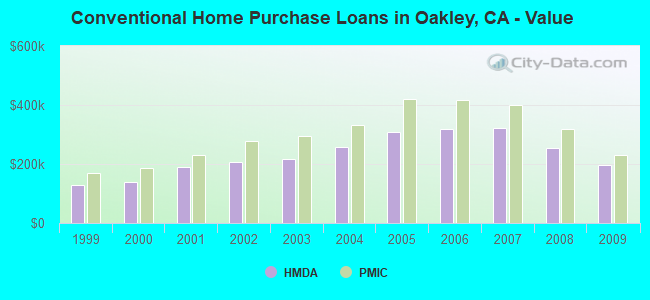
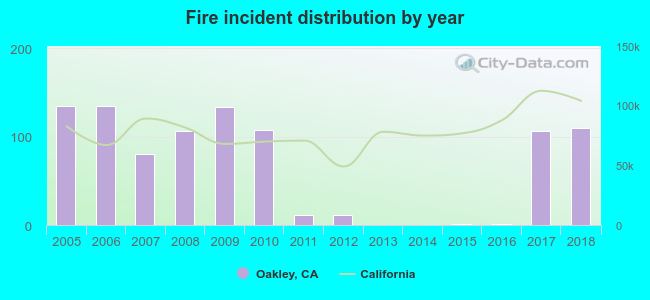 According to the data from the years 2005 - 2018 the average number of fires per year is 67. The highest number of fires - 135 took place in 2005, and the least - 0 in 2013. The data has a declining trend.
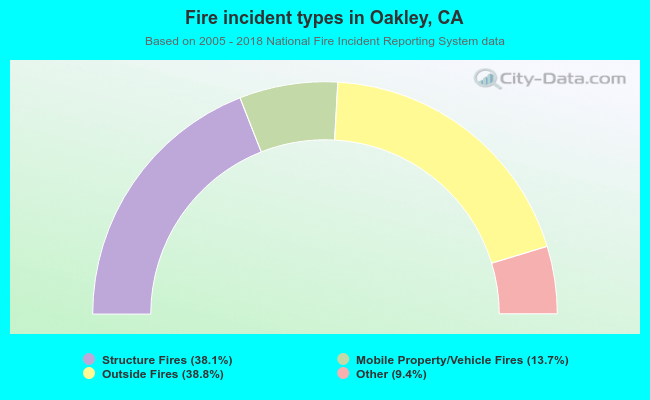 When looking into fire subcategories, the most reports belonged to: Outside Fires (38.8%), and Structure Fires (38.1%).