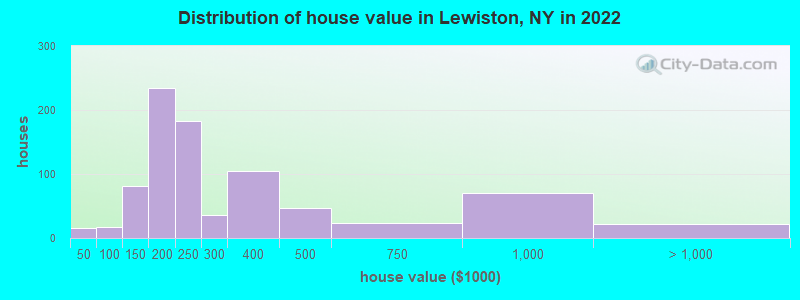
Estimated median house or condo value in 2022: $233,843 (it was $89,100 in 2000)
Lewiston:
$233,843
NY:
$400,400
Mean prices in 2022:all housing units: $305,854; detached houses: $303,488; townhouses or other attached units: $534,655; in 2-unit structures: $181,215; in 3-to-4-unit structures: $160,445; in 5-or-more-unit structures: over $1,000,000; mobile homes: $57,277
Median gross rent in 2022: $1,050.
March 2022 cost of living index in Lewiston: 102.0 (near average, U.S. average is 100)
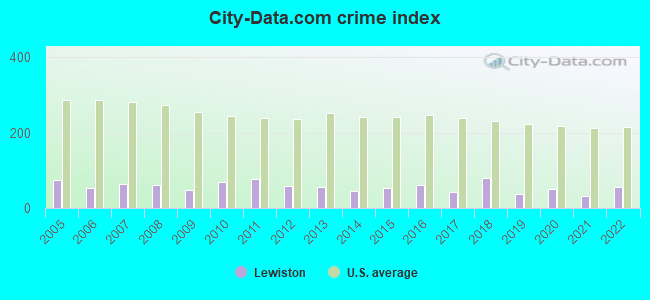
The City-Data.com crime index weighs serious crimes and violent crimes more heavily. Higher means more crime, U.S. average is 246.1. It adjusts for the number of visitors and daily workers commuting into cities.
Latest news from Lewiston, NY collected exclusively by city-data.com from local newspapers, TV, and radio stations
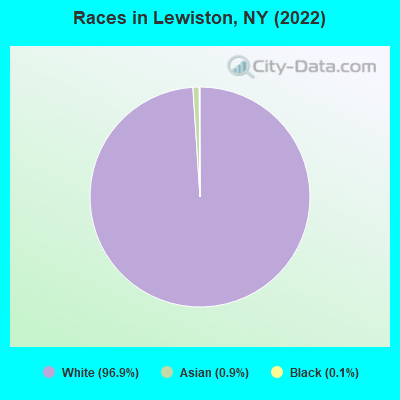
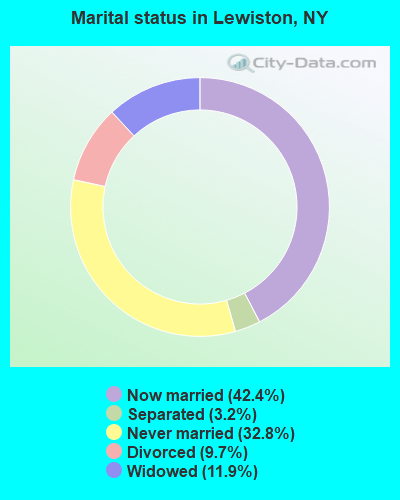
Ancestries: Italian (29.2%), German (21.0%), American (12.8%), English (9.8%), Polish (7.2%), Irish (6.4%).
Current Local Time: EST time zone
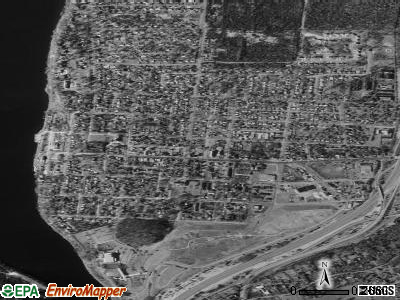
Land area: 1.07 square miles.
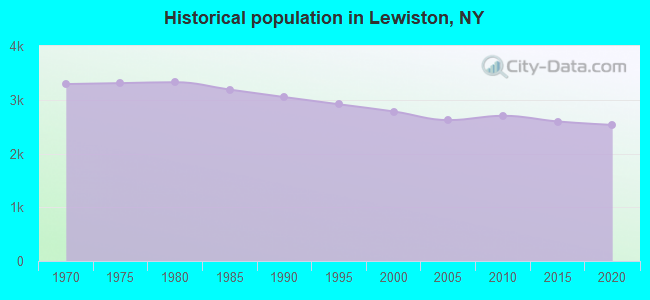
Population density: 2,369 people per square mile (low).
304 residents are foreign born (9.8% Europe, 1.4% North America).
This village:
12.0%
New York:
22.6%
Median real estate property taxes paid for housing units with mortgages in 2022: $4,994 (2.0%) Median real estate property taxes paid for housing units with no mortgage in 2022: $3,983 (1.8%)
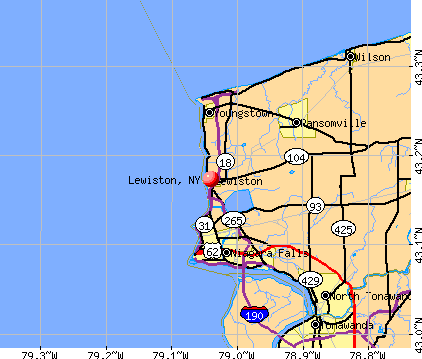
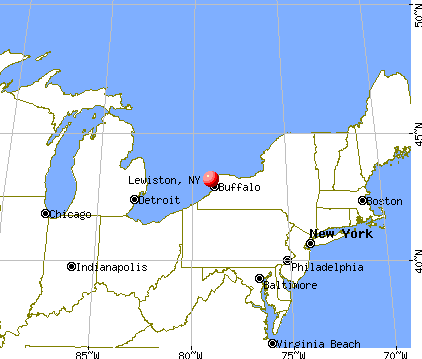
Nearest city with pop. 50,000+: Niagara Falls, NY (5.6 miles , pop. 55,593).
Nearest city with pop. 200,000+: Buffalo, NY (20.9 miles , pop. 292,648).
Nearest city with pop. 1,000,000+: Philadelphia, PA (298.0 miles , pop. 1,517,550).
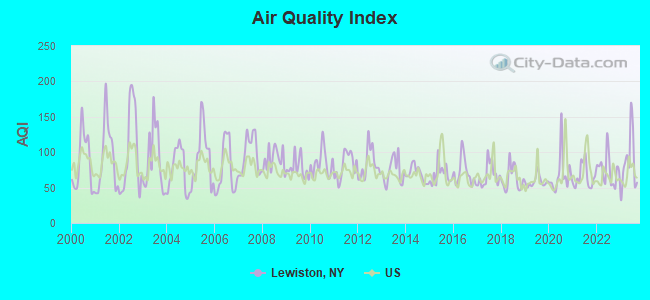
Air Quality Index (AQI) level in 2023 was 86.0. This is about average.
City:
86.0
U.S.:
72.6
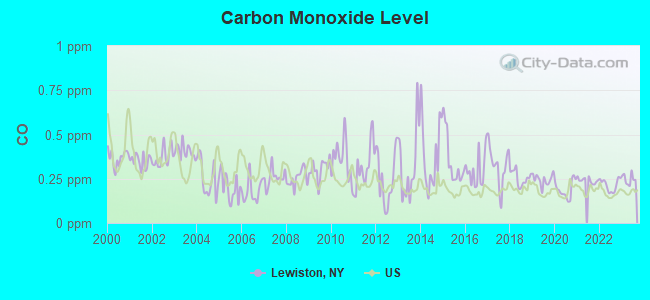
Carbon Monoxide (CO) [ppm] level in 2023 was 0.248. This is about average.Closest monitor was 6.4 miles away from the city center.
City:
0.248
U.S.:
0.251
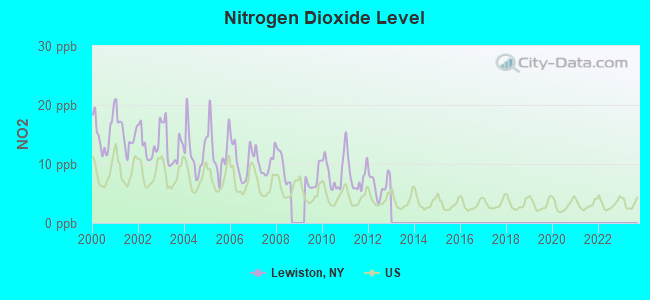
Nitrogen Dioxide (NO2) [ppb] level in 2012 was 6.43. This is worse than average.Closest monitor was 5.4 miles away from the city center.
City:
6.43
U.S.:
5.11
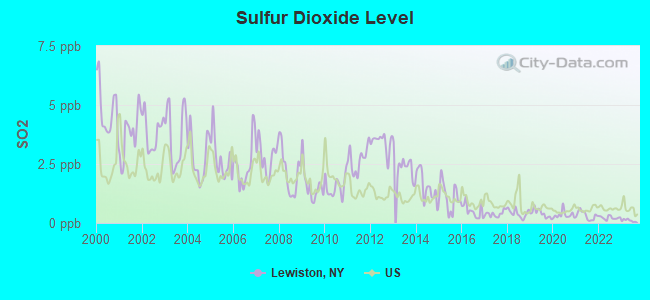
Sulfur Dioxide (SO2) [ppb] level in 2023 was 0.107. This is significantly better than average.Closest monitor was 0.1 miles away from the city center.
City:
0.107
U.S.:
1.515
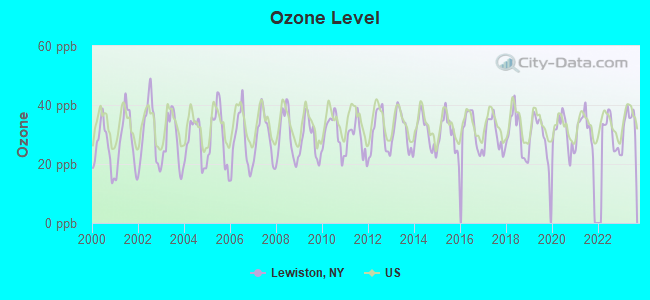
Ozone [ppb] level in 2023 was 33.8. This is about average.Closest monitor was 6.4 miles away from the city center.
City:
33.8
U.S.:
33.3
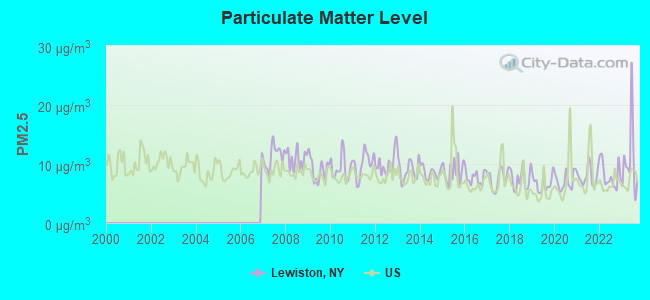
Particulate Matter (PM2.5) [µg/m3] level in 2023 was 10.6. This is worse than average.Closest monitor was 6.6 miles away from the city center.
City:
10.6
U.S.:
8.1
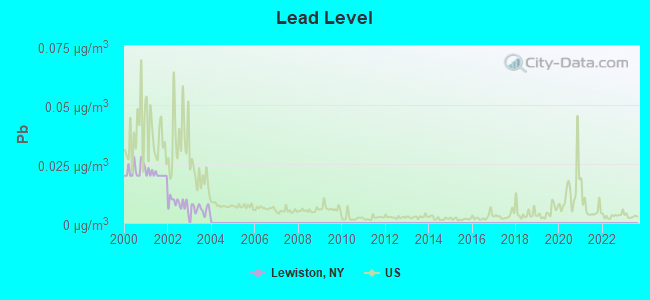
Lead (Pb) [µg/m3] level in 2003 was 0.00542. This is significantly better than average.Closest monitor was 5.4 miles away from the city center.
City:
0.00542
U.S.:
0.00931
Earthquake activity:
Lewiston-area historical earthquake activity is significantly above New York state average. It is 68% smaller than the overall U.S. average.
On 9/25/1998 at 19:52:52, a magnitude 5.2 (4.8 MB, 4.3 MS, 5.2 LG, 4.5 MW, Depth: 3.1 mi, Class: Moderate, Intensity: VI - VII) earthquake occurred 135.4 miles away from the city center On 1/31/1986 at 16:46:43, a magnitude 5.0 (5.0 MB) earthquake occurred 153.4 miles away from the city center On 10/7/1983 at 10:18:46, a magnitude 5.3 (5.1 MB, 5.3 LG, 5.1 ML) earthquake occurred 241.5 miles away from the city center On 8/23/2011 at 17:51:04, a magnitude 5.8 (5.8 MW, Depth: 3.7 mi) earthquake occurred 368.7 miles away from Lewiston center On 4/20/2002 at 10:50:47, a magnitude 5.3 (5.3 ML, Depth: 3.0 mi) earthquake occurred 282.1 miles away from the city center On 4/20/2002 at 10:50:47, a magnitude 5.2 (5.2 MB, 4.2 MS, 5.2 MW, 5.0 MW) earthquake occurred 280.6 miles away from Lewiston center Magnitude types: regional Lg-wave magnitude (LG), body-wave magnitude (MB), local magnitude (ML), surface-wave magnitude (MS), moment magnitude (MW)
Natural disasters:
The number of natural disasters in Niagara County (22) is greater than the US average (15). Major Disasters (Presidential) Declared: 11 Emergencies Declared: 10
Causes of natural disasters: Floods: 7, Storms: 6, Snowstorms: 4, Hurricanes: 2, Winds: 2, Winter Storms: 2, Blizzard: 1, Chemical Waste: 1, Power Outage: 1, Snow: 1, Tornado: 1, Other: 2 (Note: some incidents may be assigned to more than one category).
Hospitals and medical centers in Lewiston:
MOUNT ST MARY'S HOSPITAL AND HEALTH CENTER (Voluntary non-profit - Church, 5300 MILITARY ROAD)
FAIRCHILD MANOR NURSING HOME (765 FAIRCHILD PLACE)
OUR LADY OF PEACE NURSING CARE RESIDENCE (5285 LEWISTON ROAD)
Amtrak stations near Lewiston:
5 miles: NIAGARA FALLS (4267 BRIDGE ST.) . Services: ticket office, partially wheelchair accessible, public payphones, vending machines, free short-term parking, call for taxi service, intercity bus service.
5 miles: NIAGARA FALLS (27TH & LOCKPORT RD.) . Services: ticket office, partially wheelchair accessible, enclosed waiting area, public restrooms, public payphones, vending machines, free short-term parking, call for car rental service, call for taxi service.
10 miles: ST. CATHARINES (ST. CATHERINES, 5 GREAT WESTERN AVE.) . Services: ticket office, partially wheelchair accessible, enclosed waiting area, public restrooms, public payphones, snack bar, free short-term parking, call for car rental service, call for taxi service.
Colleges/universities with over 2000 students nearest to Lewiston:
LEWISTON PUBLIC LIBRARY (Operating income: $384,593; Location: 305 SOUTH EIGHTH STREET; 67,710 books; 3,539 audio materials; 1,597 video materials; 2 local licensed databases; 13 state licensed databases; 12 other licensed databases; 109 print serial subscriptions)
User-submitted facts and corrections:
NIAGARA UNIVERSITY IS LOCATED IN LEWISTON,NIAGARA FALLS MEM. HOSPT. IS LOCATED ONLY 6 MILES FROM LEWISTON
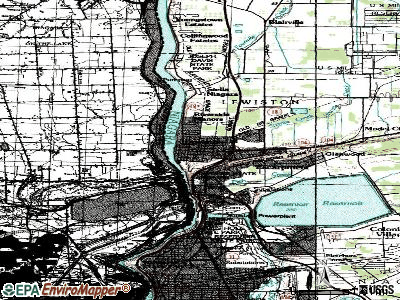
Notable locations in Lewiston: Lewiston Volunteer Fire Company 1 (A), Lewiston Public Library (B), Fairchild Manor Nursing Home (C). Display/hide their locations on the map
Churches in Lewiston include: Saint Peters Church (A), Saint Pauls Episcopal Church (B), The First Presbyterian Church of Lewiston (C), The Lutheran Church of the Messiah (D). Display/hide their locations on the map
Birthplace of: Mike Bell (first baseman) - Baseball player, Earl Seick - Football player.
Niagara County has a predicted average indoor radon screening level between 2 and 4 pCi/L (pico curies per liter) - Moderate Potential
Average household size:
This village:
2.0 people
New York:
2.6 people
Percentage of family households:
This village:
51.4%
Whole state:
63.5%
Percentage of households with unmarried partners:
This village:
5.3%
Whole state:
6.8%
Likely homosexual households (counted as self-reported same-sex unmarried-partner households)
Lesbian couples: 0.3% of all households
Gay men: 0.0% of all households
96 people in nursing facilities/skilled-nursing facilities in 2010
11 people in group homes intended for adults in 2010
100 people in nursing homes in 2000
11 people in homes or halfway houses for drug/alcohol abuse in 2000
Banks with branches in Lewiston (2011 data):
First Niagara Bank, National Association: Lewiston Branch at 500 Center Street, branch established on 2005/07/15. Info updated 2011/06/09: Bank assets: $32,750.6 mil, Deposits: $19,595.4 mil, headquarters in Buffalo, NY, positive income, Commercial Lending Specialization, 351 total offices, Holding Company: First Niagara Financial Group, Inc.
Bank of America, National Association: Lewiston Branch at 767 Cayuga Street, branch established on 1981/09/28. Info updated 2009/11/18: Bank assets: $1,451,969.3 mil, Deposits: $1,077,176.8 mil, headquarters in Charlotte, NC, positive income, 5782 total offices, Holding Company: Bank Of America Corporation
HSBC Bank USA, National Association: Lewiston Branch at 721 Center Street, branch established on 1953/03/11. Info updated 2010/11/30: Bank assets: $206,009.7 mil, Deposits: $149,026.8 mil, headquarters in Mc Lean, VA, positive income, 474 total offices, Holding Company: Hsbc Holdings Plc
KeyBank National Association: Lewiston Branch at 493 Center Street, branch established on 1978/01/01. Info updated 2008/03/03: Bank assets: $86,198.8 mil, Deposits: $64,214.8 mil, headquarters in Cleveland, OH, positive income, Commercial Lending Specialization, 1067 total offices, Holding Company: Keycorp
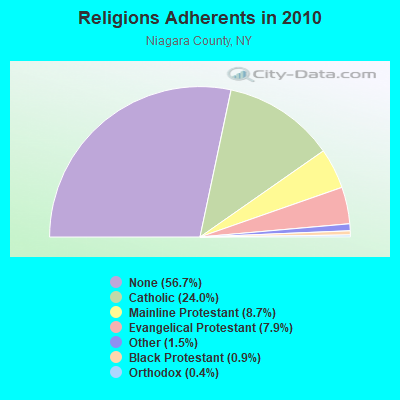
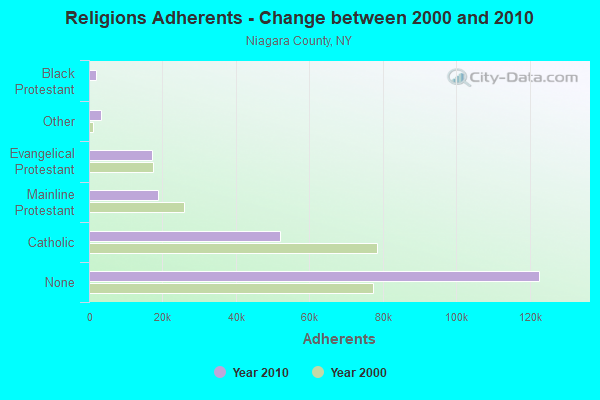
Religion statistics for Lewiston, NY (based on Niagara County data)
Religion
Adherents
Congregations
Catholic
51,948
30
Mainline Protestant
18,836
71
Evangelical Protestant
17,174
78
Other
3,157
17
Black Protestant
1,895
11
Orthodox
810
5
None
122,649
-
Source: Clifford Grammich, Kirk Hadaway, Richard Houseal, Dale E.Jones, Alexei Krindatch, Richie Stanley and Richard H.Taylor. 2012. 2010 U.S.Religion Census: Religious Congregations & Membership Study. Association of Statisticians of American Religious Bodies. Jones, Dale E., et al. 2002. Congregations and Membership in the United States 2000. Nashville, TN: Glenmary Research Center. Graphs represent county-level data
Aircraft: CESSNA 152 (Category: Land, Seats: 2, Weight: Up to 12,499 Pounds), Engine: LYCOMING 0-235 SERIES (115 HP) (4 Cycle) N-Number: 24364, N24364, N-24364, Serial Number: 15280236, Year manufactured: 1977, Airworthiness Date: 08/22/1977, Certificate Issue Date: 11/23/2020 Registrant (Individual): Carlos M Monsalve, 707 Mountain View Dr, Lewiston, NY 14092
Aircraft: CESSNA 182L (Category: Land, Seats: 4, Weight: Up to 12,499 Pounds, Speed: 119 mph), Engine: CONT MOTOR O-470 SERIES (230 HP) (Reciprocating) N-Number: 42234, N42234, N-42234, Serial Number: 18258916, Year manufactured: 1968, Airworthiness Date: 03/22/1968, Certificate Issue Date: 09/14/1989 Registrant (Individual): Joseph D Antonucci, 230 South First Street, Lewiston, NY 14092
Aircraft: CESSNA 150G (Category: Land, Seats: 2, Weight: Up to 12,499 Pounds, Speed: 90 mph), Engine: CONT MOTOR 0-200 SERIES (100 HP) (4 Cycle) N-Number: 8412J, N8412J, N-8412J, Serial Number: 15066312, Year manufactured: 1967, Airworthiness Date: 02/24/1967, Certificate Issue Date: 05/23/2019 Registrant (Individual): William F Iii Farnham, 543 Oak Run Dr, Lewiston, NY 14092
Aircraft: PIPER PA-32-300 (Category: Land, Seats: 6, Weight: Up to 12,499 Pounds, Speed: 126 mph), Engine: LYCOMING IO-540 SER (300 HP) (Reciprocating) N-Number: 825RD, N825RD, N-825RD, Serial Number: 32-7640063, Year manufactured: 1976, Airworthiness Date: 06/19/2000, Certificate Issue Date: 06/14/2000 Registrant (Individual): Ronald J Poland, 5082 Woodland Dr, Lewiston, NY 14092 Deregistered:Cancel Date: 10/31/2020
Home Mortgage Disclosure Act Aggregated Statistics For Year 2009 (Based on 1 full tract)
A) FHA, FSA/RHS & VA Home Purchase Loans
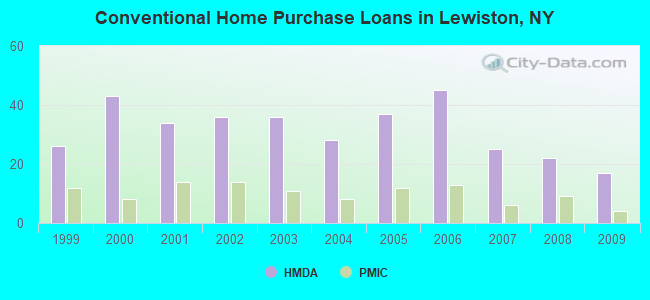
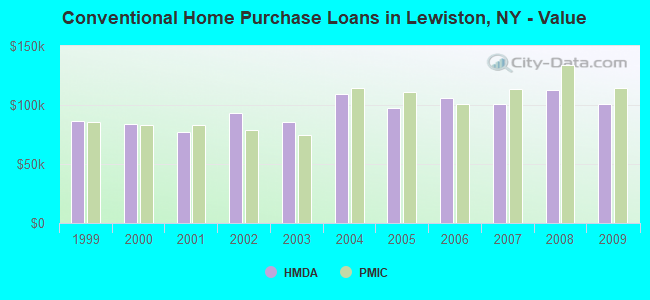
B) Conventional Home Purchase Loans
C) Refinancings
D) Home Improvement Loans
E) Loans on Dwellings For 5+ Families
F) Non-occupant Loans on < 5 Family Dwellings (A B C & D)
Number
Average Value
Number
Average Value
Number
Average Value
Number
Average Value
Number
Average Value
Number
Average Value
LOANS ORIGINATED
7
$125,857
17
$100,471
20
$108,050
3
$36,333
1
$4,500,000
2
$85,000
APPLICATIONS APPROVED, NOT ACCEPTED
0
$0
0
$0
1
$91,000
0
$0
0
$0
0
$0
APPLICATIONS DENIED
0
$0
0
$0
8
$123,875
2
$12,500
0
$0
1
$121,000
APPLICATIONS WITHDRAWN
0
$0
1
$175,000
8
$136,375
0
$0
0
$0
1
$141,000
FILES CLOSED FOR INCOMPLETENESS
0
$0
0
$0
2
$145,000
0
$0
0
$0
0
$0
Aggregated Statistics For Year 2008 (Based on 1 full tract)
A) FHA, FSA/RHS & VA Home Purchase Loans
B) Conventional Home Purchase Loans
C) Refinancings
D) Home Improvement Loans
F) Non-occupant Loans on < 5 Family Dwellings (A B C & D)
Number
Average Value
Number
Average Value
Number
Average Value
Number
Average Value
Number
Average Value
LOANS ORIGINATED
9
$119,222
22
$113,045
20
$106,250
5
$20,600
6
$86,500
APPLICATIONS APPROVED, NOT ACCEPTED
0
$0
3
$92,333
0
$0
0
$0
1
$75,000
APPLICATIONS DENIED
0
$0
4
$82,250
10
$104,300
10
$18,900
2
$59,000
APPLICATIONS WITHDRAWN
0
$0
0
$0
3
$92,000
1
$116,000
0
$0
FILES CLOSED FOR INCOMPLETENESS
0
$0
1
$148,000
0
$0
1
$20,000
0
$0
Aggregated Statistics For Year 2007 (Based on 1 full tract)
A) FHA, FSA/RHS & VA Home Purchase Loans
B) Conventional Home Purchase Loans
C) Refinancings
D) Home Improvement Loans
F) Non-occupant Loans on < 5 Family Dwellings (A B C & D)
G) Loans On Manufactured Home Dwelling (A B C & D)
Number
Average Value
Number
Average Value
Number
Average Value
Number
Average Value
Number
Average Value
Number
Average Value
LOANS ORIGINATED
4
$109,250
25
$100,720
16
$108,812
7
$25,714
5
$110,400
1
$54,000
APPLICATIONS APPROVED, NOT ACCEPTED
0
$0
5
$106,400
7
$160,143
5
$156,600
0
$0
0
$0
APPLICATIONS DENIED
0
$0
4
$133,000
10
$112,300
8
$43,375
2
$67,500
0
$0
APPLICATIONS WITHDRAWN
0
$0
1
$118,000
3
$118,667
1
$30,000
1
$118,000
0
$0
FILES CLOSED FOR INCOMPLETENESS
0
$0
0
$0
3
$136,667
0
$0
0
$0
0
$0
Aggregated Statistics For Year 2006 (Based on 1 full tract)
A) FHA, FSA/RHS & VA Home Purchase Loans
B) Conventional Home Purchase Loans
C) Refinancings
D) Home Improvement Loans
E) Loans on Dwellings For 5+ Families
F) Non-occupant Loans on < 5 Family Dwellings (A B C & D)
Number
Average Value
Number
Average Value
Number
Average Value
Number
Average Value
Number
Average Value
Number
Average Value
LOANS ORIGINATED
3
$116,333
45
$105,556
20
$91,300
12
$31,667
1
$150,000
9
$73,778
APPLICATIONS APPROVED, NOT ACCEPTED
0
$0
3
$51,000
6
$83,167
4
$30,250
0
$0
1
$12,000
APPLICATIONS DENIED
0
$0
2
$53,000
29
$97,276
6
$36,667
0
$0
1
$50,000
APPLICATIONS WITHDRAWN
0
$0
1
$60,000
12
$111,333
0
$0
0
$0
1
$170,000
FILES CLOSED FOR INCOMPLETENESS
0
$0
3
$76,333
5
$116,200
1
$40,000
0
$0
0
$0
Aggregated Statistics For Year 2005 (Based on 1 full tract)
A) FHA, FSA/RHS & VA Home Purchase Loans
B) Conventional Home Purchase Loans
C) Refinancings
D) Home Improvement Loans
F) Non-occupant Loans on < 5 Family Dwellings (A B C & D)
Number
Average Value
Number
Average Value
Number
Average Value
Number
Average Value
Number
Average Value
LOANS ORIGINATED
3
$127,333
37
$97,189
30
$102,633
9
$42,444
9
$85,556
APPLICATIONS APPROVED, NOT ACCEPTED
0
$0
3
$91,667
10
$101,800
3
$56,667
2
$111,500
APPLICATIONS DENIED
1
$89,000
5
$80,600
44
$109,068
11
$41,273
6
$96,667
APPLICATIONS WITHDRAWN
1
$120,000
3
$61,667
12
$97,417
2
$123,000
0
$0
FILES CLOSED FOR INCOMPLETENESS
0
$0
4
$66,500
6
$140,333
0
$0
1
$96,000
Aggregated Statistics For Year 2004 (Based on 1 full tract)
A) FHA, FSA/RHS & VA Home Purchase Loans
B) Conventional Home Purchase Loans
C) Refinancings
D) Home Improvement Loans
E) Loans on Dwellings For 5+ Families
F) Non-occupant Loans on < 5 Family Dwellings (A B C & D)
G) Loans On Manufactured Home Dwelling (A B C & D)
Number
Average Value
Number
Average Value
Number
Average Value
Number
Average Value
Number
Average Value
Number
Average Value
Number
Average Value
LOANS ORIGINATED
8
$95,625
28
$109,071
26
$80,538
9
$36,889
1
$720,000
3
$74,667
0
$0
APPLICATIONS APPROVED, NOT ACCEPTED
0
$0
2
$165,000
5
$107,400
2
$27,000
0
$0
1
$154,000
0
$0
APPLICATIONS DENIED
1
$120,000
5
$132,600
22
$101,909
8
$20,875
0
$0
1
$150,000
1
$115,000
APPLICATIONS WITHDRAWN
1
$87,000
1
$94,000
17
$81,353
5
$58,400
0
$0
0
$0
0
$0
FILES CLOSED FOR INCOMPLETENESS
0
$0
0
$0
6
$101,833
0
$0
0
$0
0
$0
0
$0
Aggregated Statistics For Year 2003 (Based on 1 full tract)
A) FHA, FSA/RHS & VA Home Purchase Loans
B) Conventional Home Purchase Loans
C) Refinancings
D) Home Improvement Loans
E) Loans on Dwellings For 5+ Families
F) Non-occupant Loans on < 5 Family Dwellings (A B C & D)
Number
Average Value
Number
Average Value
Number
Average Value
Number
Average Value
Number
Average Value
Number
Average Value
LOANS ORIGINATED
8
$94,625
36
$85,417
74
$93,446
3
$3,000
1
$780,000
7
$69,286
APPLICATIONS APPROVED, NOT ACCEPTED
0
$0
1
$42,000
11
$79,182
0
$0
0
$0
0
$0
APPLICATIONS DENIED
1
$86,000
1
$106,000
39
$94,051
3
$29,333
0
$0
3
$57,667
APPLICATIONS WITHDRAWN
0
$0
2
$128,000
20
$107,450
1
$14,000
0
$0
3
$101,000
FILES CLOSED FOR INCOMPLETENESS
0
$0
2
$46,500
5
$129,200
0
$0
0
$0
1
$63,000
Aggregated Statistics For Year 2002 (Based on 1 full tract)
A) FHA, FSA/RHS & VA Home Purchase Loans
B) Conventional Home Purchase Loans
C) Refinancings
D) Home Improvement Loans
E) Loans on Dwellings For 5+ Families
F) Non-occupant Loans on < 5 Family Dwellings (A B C & D)
Number
Average Value
Number
Average Value
Number
Average Value
Number
Average Value
Number
Average Value
Number
Average Value
LOANS ORIGINATED
8
$86,500
36
$93,583
41
$85,902
3
$26,000
0
$0
7
$127,143
APPLICATIONS APPROVED, NOT ACCEPTED
1
$64,000
1
$174,000
5
$127,400
2
$29,500
0
$0
1
$135,000
APPLICATIONS DENIED
0
$0
7
$53,714
17
$98,059
5
$15,000
1
$209,000
3
$60,000
APPLICATIONS WITHDRAWN
0
$0
0
$0
15
$92,467
0
$0
0
$0
0
$0
FILES CLOSED FOR INCOMPLETENESS
1
$105,000
0
$0
1
$99,000
0
$0
0
$0
0
$0
Aggregated Statistics For Year 2001 (Based on 1 full tract)
A) FHA, FSA/RHS & VA Home Purchase Loans
B) Conventional Home Purchase Loans
C) Refinancings
D) Home Improvement Loans
F) Non-occupant Loans on < 5 Family Dwellings (A B C & D)
Number
Average Value
Number
Average Value
Number
Average Value
Number
Average Value
Number
Average Value
LOANS ORIGINATED
9
$87,889
34
$76,794
45
$82,911
7
$19,857
5
$83,400
APPLICATIONS APPROVED, NOT ACCEPTED
0
$0
2
$44,500
3
$45,333
0
$0
0
$0
APPLICATIONS DENIED
0
$0
0
$0
18
$78,722
4
$23,000
1
$20,000
APPLICATIONS WITHDRAWN
1
$121,000
0
$0
15
$85,733
1
$15,000
0
$0
FILES CLOSED FOR INCOMPLETENESS
0
$0
1
$58,000
0
$0
1
$10,000
0
$0
Aggregated Statistics For Year 2000 (Based on 1 full tract)
A) FHA, FSA/RHS & VA Home Purchase Loans
B) Conventional Home Purchase Loans
C) Refinancings
D) Home Improvement Loans
F) Non-occupant Loans on < 5 Family Dwellings (A B C & D)
Number
Average Value
Number
Average Value
Number
Average Value
Number
Average Value
Number
Average Value
LOANS ORIGINATED
5
$101,400
43
$84,023
14
$84,643
4
$8,250
1
$192,000
APPLICATIONS APPROVED, NOT ACCEPTED
0
$0
3
$167,333
6
$95,333
3
$11,333
0
$0
APPLICATIONS DENIED
0
$0
2
$66,500
15
$65,200
4
$30,000
0
$0
APPLICATIONS WITHDRAWN
0
$0
5
$208,000
4
$65,500
1
$50,000
1
$27,000
FILES CLOSED FOR INCOMPLETENESS
0
$0
0
$0
2
$71,000
0
$0
0
$0
Aggregated Statistics For Year 1999 (Based on 1 full tract)
A) FHA, FSA/RHS & VA Home Purchase Loans
B) Conventional Home Purchase Loans
C) Refinancings
D) Home Improvement Loans
E) Loans on Dwellings For 5+ Families
F) Non-occupant Loans on < 5 Family Dwellings (A B C & D)
Detailed PMIC statistics for the following Tracts:0244.01
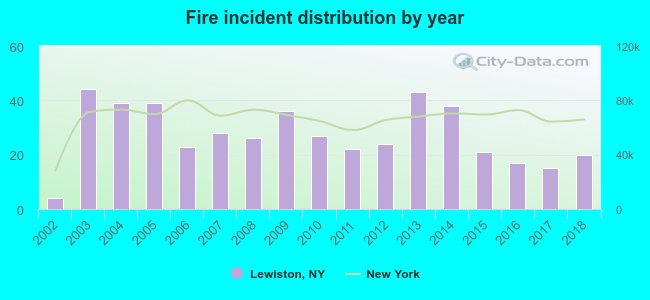
2002 - 2018 National Fire Incident Reporting System (NFIRS) incidents
According to the data from the years 2002 - 2018 the average number of fires per year is 27. The highest number of fires - 44 took place in 2003, and the least - 4 in 2002. The data has an increasing trend.
When looking into fire subcategories, the most reports belonged to: Structure Fires (50.0%), and Outside Fires (24.2%).
Fire incident types reported to NFIRS in Lewiston, NY


 Recent articles from our blog. Our writers, many of them Ph.D. graduates or candidates, create easy-to-read articles on a wide variety of topics.

 (5.6 miles

 According to the data from the years 2002 - 2018 the average number of fires per year is 27. The highest number of fires - 44 took place in 2003, and the least - 4 in 2002. The data has an increasing trend.
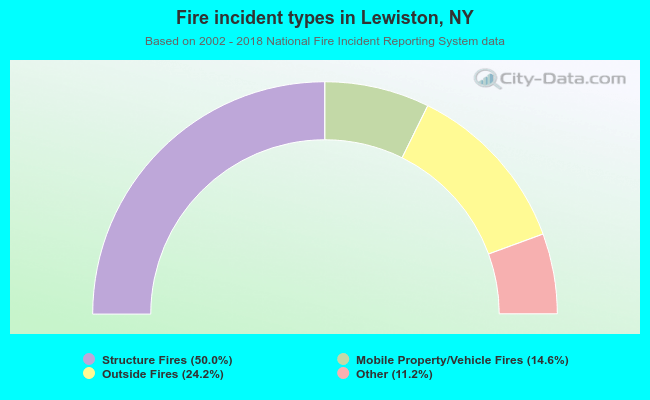 When looking into fire subcategories, the most reports belonged to: Structure Fires (50.0%), and Outside Fires (24.2%).