Percentage of residents living in poverty in 2022: 2.6%
(1.0% for White Non-Hispanic residents, 100.0% for Black residents, 45.5% for Hispanic or Latino residents, 47.9% for other race residents)
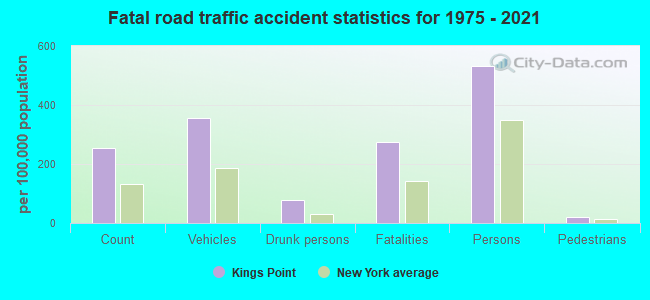
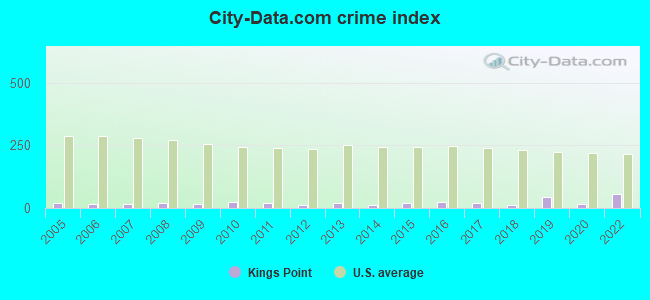
The City-Data.com crime index weighs serious crimes and violent crimes more heavily. Higher means more crime, U.S. average is 246.1. It adjusts for the number of visitors and daily workers commuting into cities.
Ancestries: Iranian (55.9%), Italian (7.1%), Russian (4.0%), American (2.9%), Irish (2.6%), European (1.8%).
Current Local Time: EST time zone
Elevation: 26 feet
Land area: 3.34 square miles.
Population density: 1,681 people per square mile (low).
1,387 residents are foreign born (20.0% Asia, 4.9% Europe).
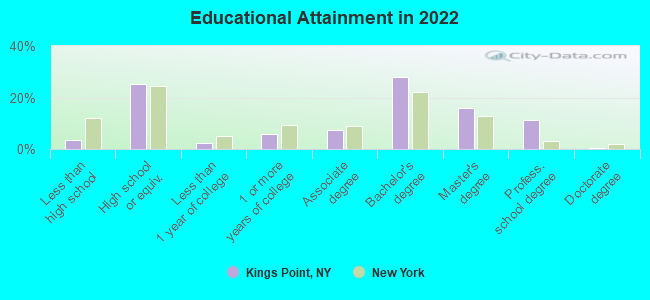
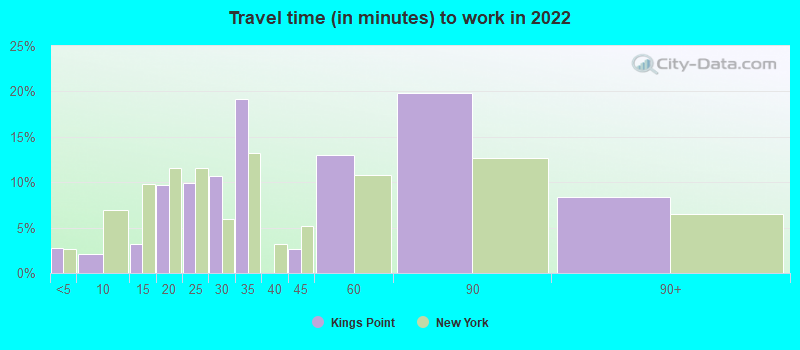
This village:
24.9%
New York:
22.6%
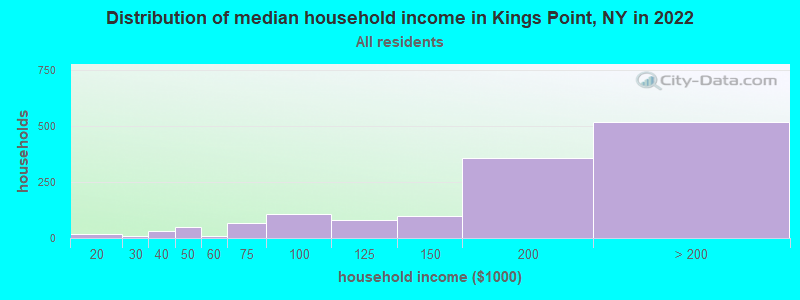
Median real estate property taxes paid for housing units with mortgages in 2022: $10,001 (0.5%) Median real estate property taxes paid for housing units with no mortgage in 2022: $10,001 (0.5%)
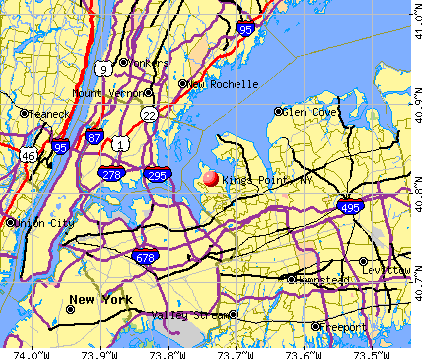
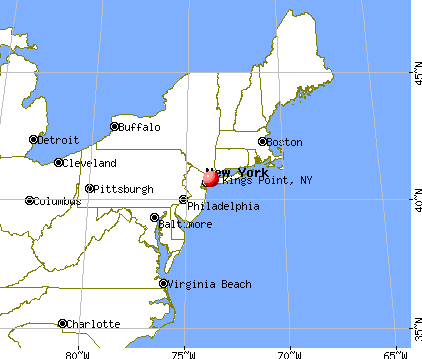
Nearest city with pop. 50,000+: North Hempstead, NY (4.6 miles , pop. 222,611).
Nearest city with pop. 1,000,000+: Bronx, NY (7.4 miles , pop. 1,332,650).
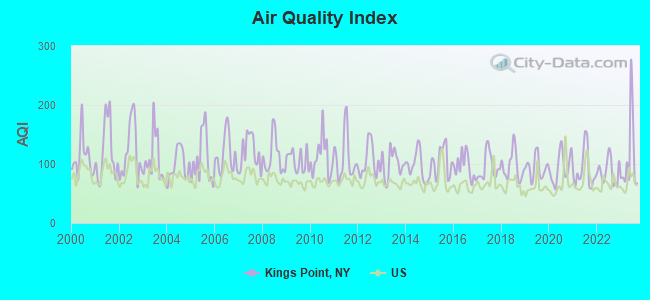
Air Quality Index (AQI) level in 2023 was 110. This is significantly worse than average.
City:
110
U.S.:
73
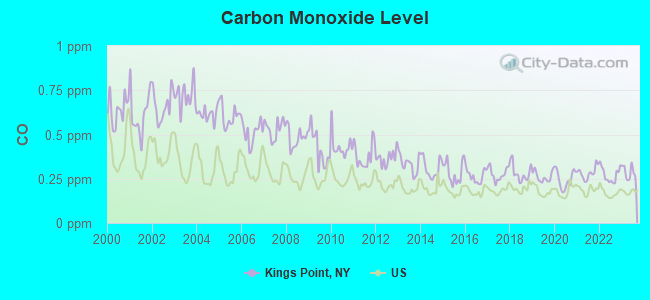
Carbon Monoxide (CO) [ppm] level in 2023 was 0.285. This is about average.Closest monitor was 4.3 miles away from the city center.
City:
0.285
U.S.:
0.251
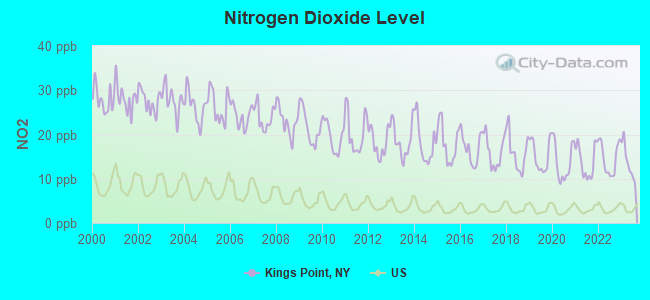
Nitrogen Dioxide (NO2) [ppb] level in 2023 was 13.7. This is significantly worse than average.Closest monitor was 4.3 miles away from the city center.
City:
13.7
U.S.:
5.1
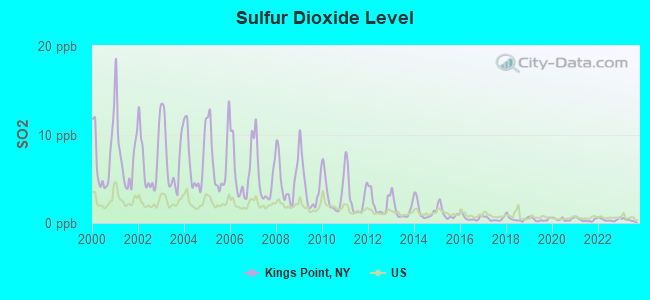
Sulfur Dioxide (SO2) [ppb] level in 2023 was 0.340. This is significantly better than average.Closest monitor was 1.2 miles away from the city center.
City:
0.340
U.S.:
1.515
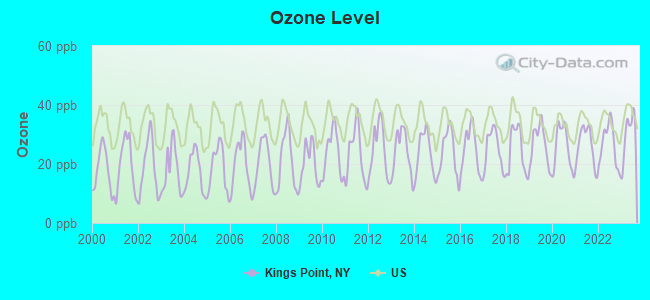
Ozone [ppb] level in 2023 was 30.2. This is about average.Closest monitor was 4.3 miles away from the city center.
City:
30.2
U.S.:
33.3
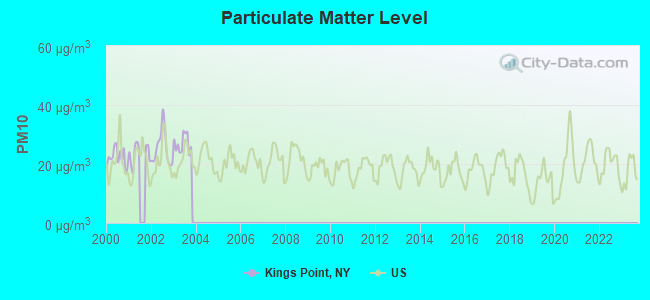
Particulate Matter (PM10) [µg/m3] level in 2003 was 26.9. This is worse than average.Closest monitor was 5.3 miles away from the city center.
City:
26.9
U.S.:
19.2
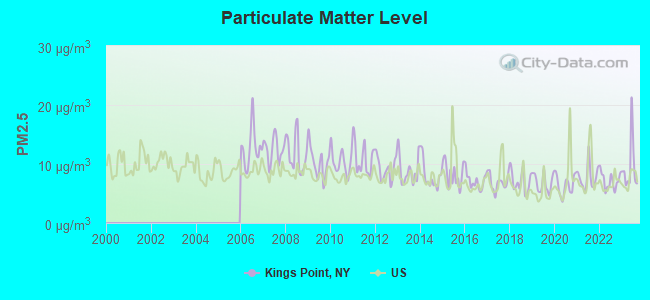
Particulate Matter (PM2.5) [µg/m3] level in 2023 was 9.43. This is about average.Closest monitor was 4.3 miles away from the city center.
City:
9.43
U.S.:
8.11
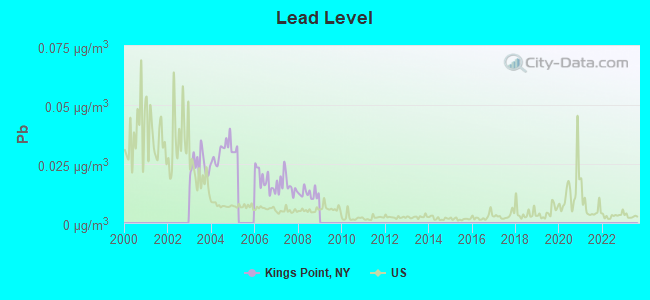
Lead (Pb) [µg/m3] level in 2008 was 0.0125. This is worse than average.Closest monitor was 6.4 miles away from the city center.
City:
0.0125
U.S.:
0.0093
Tornado activity:
Kings Point-area historical tornado activity is above New York state average. It is 45% smaller than the overall U.S. average.
On 7/10/1989, a category F4 (max. wind speeds 207-260 mph) tornado 55.1 miles away from the Kings Point village center injured 40 peopleand causedbetween $50,000,000 and $500,000,000 in damages.
On 5/28/1973, a category F3 (max. wind speeds 158-206 mph) tornado 39.9 miles away from the village center causedbetween $50,000 and $500,000 in damages.
Earthquake activity:
Kings Point-area historical earthquake activity is significantly above New York state average. It is 69% smaller than the overall U.S. average.
On 8/23/2011 at 17:51:04, a magnitude 5.8 (5.8 MW, Depth: 3.7 mi, Class: Moderate, Intensity: VI - VII) earthquake occurred 301.3 miles away from Kings Point center On 10/7/1983 at 10:18:46, a magnitude 5.3 (5.1 MB, 5.3 LG, 5.1 ML) earthquake occurred 219.2 miles away from the city center On 4/20/2002 at 10:50:47, a magnitude 5.3 (5.3 ML, Depth: 3.0 mi) earthquake occurred 255.7 miles away from the city center On 1/16/1994 at 01:49:16, a magnitude 4.6 (4.6 MB, 4.6 LG, Depth: 3.1 mi, Class: Light, Intensity: IV - V) earthquake occurred 125.4 miles away from the city center On 4/20/2002 at 10:50:47, a magnitude 5.2 (5.2 MB, 4.2 MS, 5.2 MW, 5.0 MW) earthquake occurred 253.9 miles away from Kings Point center On 8/22/1992 at 12:20:32, a magnitude 4.8 (4.8 MB, 3.8 MS, 4.7 LG, Depth: 6.2 mi) earthquake occurred 216.4 miles away from Kings Point center Magnitude types: regional Lg-wave magnitude (LG), body-wave magnitude (MB), local magnitude (ML), surface-wave magnitude (MS), moment magnitude (MW)
Natural disasters:
The number of natural disasters in Nassau County (25) is a lot greater than the US average (15). Major Disasters (Presidential) Declared: 17 Emergencies Declared: 7
Causes of natural disasters: Hurricanes: 8, Storms: 7, Floods: 6, Blizzards: 2, Snowstorms: 2, Heavy Rain: 1, Power Outage: 1, Tropical Depression: 1, Tropical Storm: 1, Water Shortage: 1, Winter Storm: 1, Other: 3 (Note: some incidents may be assigned to more than one category).
Hospitals and medical centers near Kings Point:
GRACE PLAZA NURSING AND REHABILITATION CENTER (Nursing Home, about 2 miles away; GREAT NECK, NY)
THE AMSTERDAM AT HARBORSIDE (Nursing Home, about 3 miles away; PORT WASHINGTON, NY)
PSCH (Hospital, about 3 miles away; BAYSIDE, NY)
NORTH SHORE UNIVERSITY HOSPITAL (Dialysis Facility, about 4 miles away; GREAT NECK, NY)
HIGHFIELD GARDENS CARE CENTER OF GREAT NECK (Nursing Home, about 4 miles away; GREAT NECK, NY)
SANDS POINT CENTER FOR H AND R (Nursing Home, about 4 miles away; PORT WASHINGTON, NY)
NORTH SHORE UNIVERSITY HOSPITAL Acute Care Hospitals (about 4 miles away; MANHASSET, NY)
Amtrak stations near Kings Point:
8 miles: NEW ROCHELLE (DEPOT PLAZA NORTH) . Services: enclosed waiting area, public restrooms, public payphones, paid short-term parking, paid long-term parking, call for car rental service, taxi stand, public transit connection.
8 miles: LA GUARDIA AIRPORT (QUEENS, ) - Bus Station . Services: enclosed waiting area, public restrooms, public payphones, snack bar and vending machines, ATM, paid short-term parking, paid long-term parking, car rental agency, taxi stand.
13 miles: YONKERS (FOOT OF DOCK ST. & WELLS AVE.) . Services: fully wheelchair accessible, enclosed waiting area, public restrooms, public payphones, snack bar, paid short-term parking, paid long-term parking, call for car rental service, taxi stand, public transit connection.
College/University in Kings Point:
United States Merchant Marine Academy (Full-time enrollment: 1,434; Location: 300 Steamboat Rd; Public; Website: WWW.USMMA.EDU; Offers Master's degree)
Colleges/universities with over 2000 students nearest to Kings Point:
Notable locations in Kings Point: Brooks Stadium (A), Broadlawn Harbor Yacht Club (B), Shelter Harbor Marina (C), Furuseth Hall (D), O'Hara Hall (E). Display/hide their locations on the map
Parks in Kings Point include: Kings Point Park (1), Stepping Stones Park (2), Lower Roosevelt Field (3), Tomb Memorial Field (4), Upper Roosevelt Field (5). Display/hide their locations on the map
Birthplace of: Barrie Chase - Dancer.
Nassau County has a predicted average indoor radon screening level less than 2 pCi/L (pico curies per liter) - Low Potential
Average household size:
This village:
3.3 people
New York:
2.6 people
Percentage of family households:
This village:
88.2%
Whole state:
63.5%
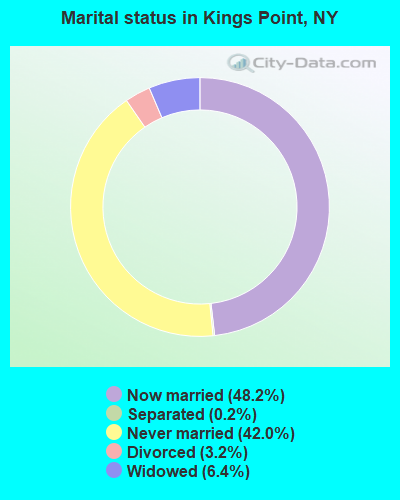
Percentage of households with unmarried partners:
This village:
1.2%
Whole state:
6.8%
Likely homosexual households (counted as self-reported same-sex unmarried-partner households)
Lesbian couples: 0.2% of all households
Gay men: 0.3% of all households
684 people in college/university student housing in 2010
13 people in group homes intended for adults in 2010
661 people in college dormitories (includes college quarters off campus) in 2000
13 people in other noninstitutional group quarters in 2000
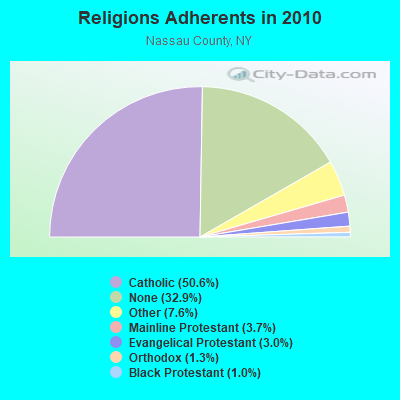
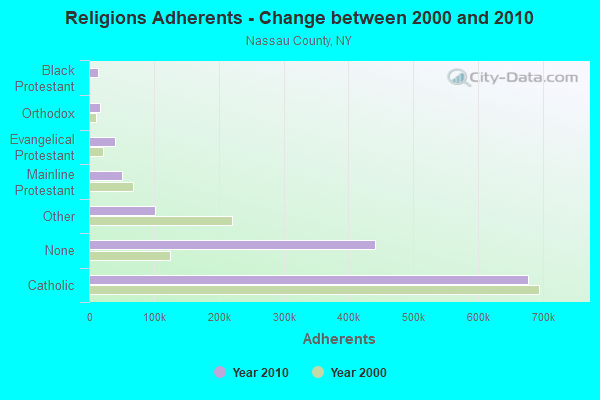
Religion statistics for Kings Point, NY (based on Nassau County data)
Religion
Adherents
Congregations
Catholic
677,149
73
Other
102,012
168
Mainline Protestant
50,181
184
Evangelical Protestant
39,923
251
Orthodox
16,758
22
Black Protestant
13,189
45
None
440,320
-
Source: Clifford Grammich, Kirk Hadaway, Richard Houseal, Dale E.Jones, Alexei Krindatch, Richie Stanley and Richard H.Taylor. 2012. 2010 U.S.Religion Census: Religious Congregations & Membership Study. Association of Statisticians of American Religious Bodies. Jones, Dale E., et al. 2002. Congregations and Membership in the United States 2000. Nashville, TN: Glenmary Research Center. Graphs represent county-level data
Call Sign: KB2UBN, Grant Date: 03/29/1995, Expiration Date: 03/29/2005, Cancellation Date: 03/30/2007, Registrant: Gregory M Burns, Box 973 Usmma, Kings Point, NY 11024
Call Sign: N2BNG, Licensee ID: L00698943, Grant Date: 03/08/1995, Expiration Date: 03/08/2005, Cancellation Date: 03/09/2007, Registrant: David S Rabinowitz, 14 Twin Ponds, Kings Point, NY 11024
Call Sign: WA2CFD, Grant Date: 04/29/1998, Expiration Date: 04/29/2008, Cancellation Date: 04/30/2010, Registrant: Morton M Bass, 47 Deer Park Rd, Kings Point, NY 11024
Call Sign: WA2EUN, Grant Date: 03/04/1997, Expiration Date: 03/04/2007, Cancellation Date: 03/05/2009, Registrant: Ronald Brecher, 21 Rogers Rd, Kings Point, NY 11024
Call Sign: WF2Q, Licensee ID: L01332954, Grant Date: 11/03/2017, Expiration Date: 01/14/2028, Certifier: Howard Krimko, Registrant: Howard Krimko, 435 E Shore Rd, Kings Point, NY 11024-2135
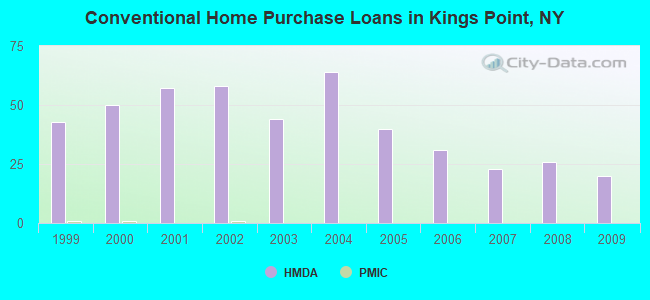
Home Mortgage Disclosure Act Aggregated Statistics For Year 2009 (Based on 1 full tract)
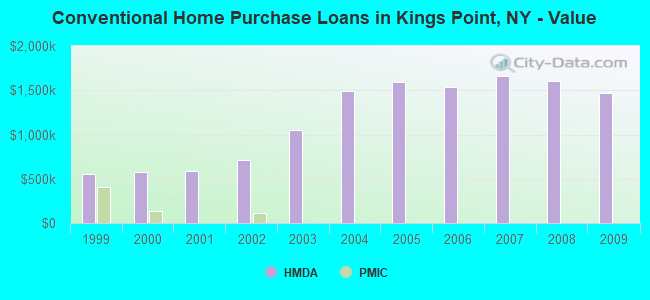
B) Conventional Home Purchase Loans
C) Refinancings
D) Home Improvement Loans
F) Non-occupant Loans on < 5 Family Dwellings (A B C & D)
Number
Average Value
Number
Average Value
Number
Average Value
Number
Average Value
LOANS ORIGINATED
20
$1,466,100
28
$1,188,857
2
$975,000
0
$0
APPLICATIONS APPROVED, NOT ACCEPTED
4
$1,079,000
7
$1,900,714
1
$80,000
0
$0
APPLICATIONS DENIED
7
$1,484,571
30
$1,275,933
1
$1,300,000
2
$496,500
APPLICATIONS WITHDRAWN
4
$943,750
8
$1,368,125
0
$0
1
$1,500,000
FILES CLOSED FOR INCOMPLETENESS
4
$1,153,750
9
$1,681,667
0
$0
0
$0
Aggregated Statistics For Year 2008 (Based on 1 full tract)
B) Conventional Home Purchase Loans
C) Refinancings
D) Home Improvement Loans
F) Non-occupant Loans on < 5 Family Dwellings (A B C & D)
G) Loans On Manufactured Home Dwelling (A B C & D)
Number
Average Value
Number
Average Value
Number
Average Value
Number
Average Value
Number
Average Value
LOANS ORIGINATED
26
$1,603,692
15
$1,500,133
3
$927,333
2
$2,175,000
1
$2,350,000
APPLICATIONS APPROVED, NOT ACCEPTED
3
$1,520,333
3
$1,015,000
0
$0
1
$861,000
0
$0
APPLICATIONS DENIED
10
$2,007,500
13
$1,877,154
2
$212,500
0
$0
0
$0
APPLICATIONS WITHDRAWN
5
$1,626,000
7
$2,127,714
0
$0
0
$0
0
$0
FILES CLOSED FOR INCOMPLETENESS
7
$1,677,714
3
$2,681,667
1
$500,000
0
$0
0
$0
Aggregated Statistics For Year 2007 (Based on 1 full tract)
B) Conventional Home Purchase Loans
C) Refinancings
D) Home Improvement Loans
F) Non-occupant Loans on < 5 Family Dwellings (A B C & D)
Number
Average Value
Number
Average Value
Number
Average Value
Number
Average Value
LOANS ORIGINATED
23
$1,659,783
53
$1,272,717
3
$420,000
3
$1,375,000
APPLICATIONS APPROVED, NOT ACCEPTED
2
$2,100,000
9
$1,150,333
0
$0
0
$0
APPLICATIONS DENIED
13
$1,628,923
32
$1,741,656
3
$1,358,333
4
$3,675,000
APPLICATIONS WITHDRAWN
5
$1,464,200
8
$1,193,000
2
$350,000
2
$2,349,500
FILES CLOSED FOR INCOMPLETENESS
4
$1,587,250
3
$1,483,333
0
$0
1
$861,000
Aggregated Statistics For Year 2006 (Based on 1 full tract)
B) Conventional Home Purchase Loans
C) Refinancings
D) Home Improvement Loans
F) Non-occupant Loans on < 5 Family Dwellings (A B C & D)
Number
Average Value
Number
Average Value
Number
Average Value
Number
Average Value
LOANS ORIGINATED
31
$1,540,935
39
$1,445,692
9
$1,297,111
3
$1,853,333
APPLICATIONS APPROVED, NOT ACCEPTED
4
$1,940,750
11
$991,091
2
$1,290,000
1
$2,500,000
APPLICATIONS DENIED
14
$1,561,286
25
$1,469,560
1
$4,000,000
0
$0
APPLICATIONS WITHDRAWN
6
$1,873,167
13
$1,028,615
1
$400,000
1
$950,000
FILES CLOSED FOR INCOMPLETENESS
5
$1,200,000
3
$1,600,000
0
$0
0
$0
Aggregated Statistics For Year 2005 (Based on 1 full tract)
B) Conventional Home Purchase Loans
C) Refinancings
D) Home Improvement Loans
F) Non-occupant Loans on < 5 Family Dwellings (A B C & D)
Number
Average Value
Number
Average Value
Number
Average Value
Number
Average Value
LOANS ORIGINATED
40
$1,589,925
55
$1,115,473
5
$752,000
5
$1,631,600
APPLICATIONS APPROVED, NOT ACCEPTED
13
$1,387,846
8
$828,000
2
$1,650,000
0
$0
APPLICATIONS DENIED
12
$2,386,500
25
$1,507,720
3
$2,113,333
2
$2,250,000
APPLICATIONS WITHDRAWN
11
$2,158,727
13
$1,382,692
0
$0
1
$135,000
FILES CLOSED FOR INCOMPLETENESS
2
$4,350,000
9
$564,778
1
$1,250,000
1
$1,250,000
Aggregated Statistics For Year 2004 (Based on 1 full tract)
B) Conventional Home Purchase Loans
C) Refinancings
D) Home Improvement Loans
F) Non-occupant Loans on < 5 Family Dwellings (A B C & D)
G) Loans On Manufactured Home Dwelling (A B C & D)
Number
Average Value
Number
Average Value
Number
Average Value
Number
Average Value
Number
Average Value
LOANS ORIGINATED
64
$1,496,891
59
$1,034,000
4
$477,500
5
$783,600
1
$66,000
APPLICATIONS APPROVED, NOT ACCEPTED
16
$672,500
19
$863,421
0
$0
3
$550,000
5
$56,600
APPLICATIONS DENIED
13
$1,951,308
28
$874,214
7
$487,857
3
$820,667
1
$55,000
APPLICATIONS WITHDRAWN
8
$2,353,125
12
$847,917
2
$350,000
1
$1,825,000
0
$0
FILES CLOSED FOR INCOMPLETENESS
1
$2,340,000
7
$854,857
0
$0
0
$0
0
$0
Aggregated Statistics For Year 2003 (Based on 1 full tract)
B) Conventional Home Purchase Loans
C) Refinancings
D) Home Improvement Loans
F) Non-occupant Loans on < 5 Family Dwellings (A B C & D)
Number
Average Value
Number
Average Value
Number
Average Value
Number
Average Value
LOANS ORIGINATED
44
$1,045,432
166
$687,861
0
$0
4
$554,500
APPLICATIONS APPROVED, NOT ACCEPTED
9
$1,181,889
33
$642,788
0
$0
0
$0
APPLICATIONS DENIED
14
$1,720,000
33
$987,485
1
$6,000
0
$0
APPLICATIONS WITHDRAWN
8
$1,514,625
27
$669,704
0
$0
1
$1,001,000
FILES CLOSED FOR INCOMPLETENESS
2
$825,000
10
$479,200
0
$0
0
$0
Aggregated Statistics For Year 2002 (Based on 1 full tract)
A) FHA, FSA/RHS & VA Home Purchase Loans
B) Conventional Home Purchase Loans
C) Refinancings
D) Home Improvement Loans
F) Non-occupant Loans on < 5 Family Dwellings (A B C & D)
Number
Average Value
Number
Average Value
Number
Average Value
Number
Average Value
Number
Average Value
LOANS ORIGINATED
0
$0
58
$708,241
108
$634,824
1
$500,000
1
$500,000
APPLICATIONS APPROVED, NOT ACCEPTED
1
$219,000
10
$601,000
16
$586,875
0
$0
0
$0
APPLICATIONS DENIED
0
$0
7
$1,173,571
27
$609,148
2
$10,500
2
$550,000
APPLICATIONS WITHDRAWN
0
$0
8
$930,125
30
$593,333
3
$21,333
1
$232,000
FILES CLOSED FOR INCOMPLETENESS
0
$0
4
$1,112,500
18
$370,222
0
$0
0
$0
Aggregated Statistics For Year 2001 (Based on 1 full tract)
B) Conventional Home Purchase Loans
C) Refinancings
D) Home Improvement Loans
F) Non-occupant Loans on < 5 Family Dwellings (A B C & D)
Number
Average Value
Number
Average Value
Number
Average Value
Number
Average Value
LOANS ORIGINATED
57
$587,000
59
$615,102
3
$416,667
4
$448,750
APPLICATIONS APPROVED, NOT ACCEPTED
11
$667,000
17
$580,235
2
$205,000
0
$0
APPLICATIONS DENIED
9
$838,222
23
$642,957
6
$102,500
0
$0
APPLICATIONS WITHDRAWN
9
$745,556
13
$483,538
8
$233,750
0
$0
FILES CLOSED FOR INCOMPLETENESS
0
$0
7
$571,429
0
$0
0
$0
Aggregated Statistics For Year 2000 (Based on 1 full tract)
A) FHA, FSA/RHS & VA Home Purchase Loans
B) Conventional Home Purchase Loans
C) Refinancings
D) Home Improvement Loans
E) Loans on Dwellings For 5+ Families
F) Non-occupant Loans on < 5 Family Dwellings (A B C & D)
Number
Average Value
Number
Average Value
Number
Average Value
Number
Average Value
Number
Average Value
Number
Average Value
LOANS ORIGINATED
2
$197,500
50
$577,640
24
$598,333
7
$246,000
1
$1,500,000
0
$0
APPLICATIONS APPROVED, NOT ACCEPTED
0
$0
7
$655,714
7
$348,429
3
$200,000
0
$0
1
$130,000
APPLICATIONS DENIED
0
$0
11
$940,455
13
$504,000
3
$221,000
0
$0
0
$0
APPLICATIONS WITHDRAWN
0
$0
7
$619,143
7
$252,429
1
$10,000
0
$0
1
$10,000
FILES CLOSED FOR INCOMPLETENESS
0
$0
1
$375,000
7
$527,714
2
$70,000
0
$0
1
$10,000
Aggregated Statistics For Year 1999 (Based on 2 partial tracts)
B) Conventional Home Purchase Loans
C) Refinancings
D) Home Improvement Loans
E) Loans on Dwellings For 5+ Families
F) Non-occupant Loans on < 5 Family Dwellings (A B C & D)
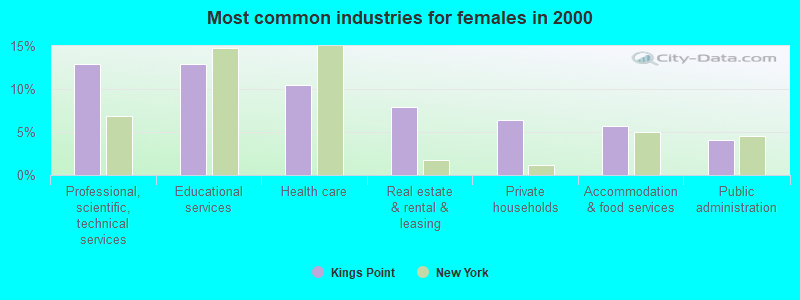
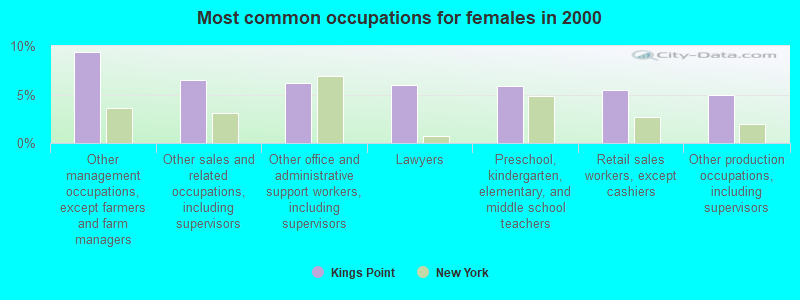
#2 on the list of "Top 101 cities with largest percentage of females in industries: wholesale trade (population 5,000+)"
#2 on the list of "Top 101 cities with the most residents born in Iran (population 500+)"
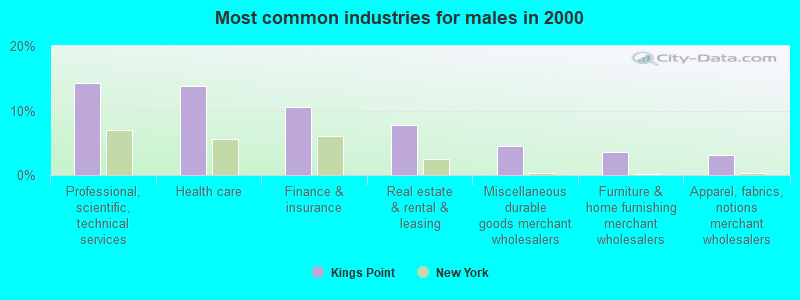
#3 on the list of "Top 101 cities with largest percentage of males in industries: wholesale trade (population 5,000+)"
#3 on the list of "Top 101 cities with the most people taking railroad to work (population 5,000+)"
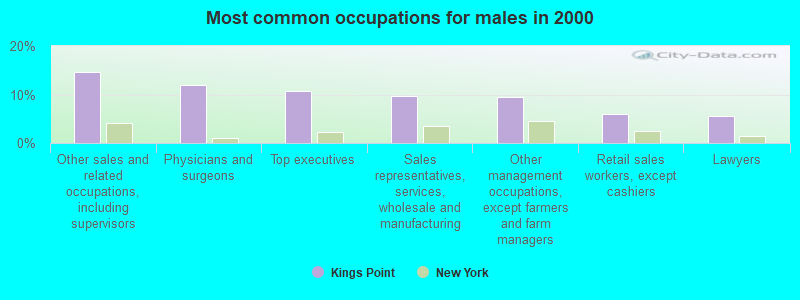
#5 on the list of "Top 101 cities with largest percentage of males in occupations: sales and related occupations (population 5,000+)"
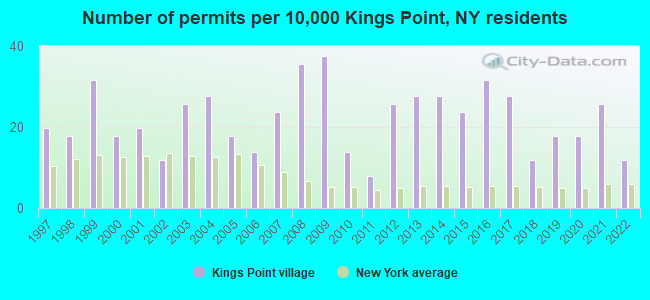
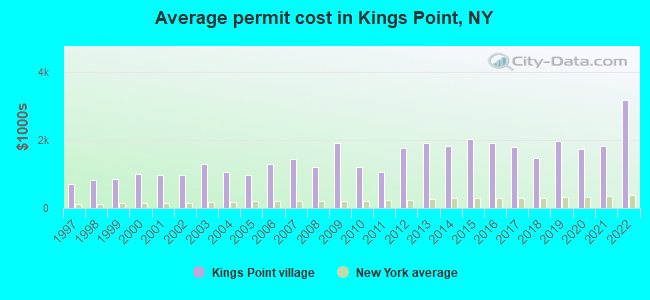
#5 on the list of "Top 101 cities with the highest cost per building permit(population 5,000+)"
#6 on the list of "Top 101 cities with largest percentage of males in industries: real estate and rental and leasing (population 5,000+)"
#8 on the list of "Top 101 cities with the largest city-data.com crime index increase from 2002 to 2012 (population 5,000+)"
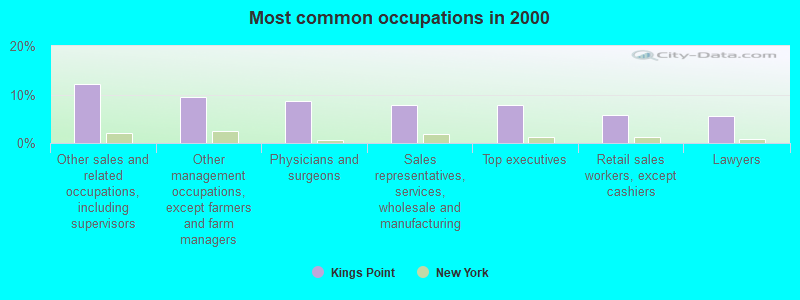
#9 on the list of "Top 101 cities with largest percentage of females in occupations: sales and related occupations (population 5,000+)"
#9 on the list of "Top 101 cities with the most residents born in South Central Asia (population 500+)"
#14 on the list of "Top 101 cities with the smallest percentage of divorced people (15+ years)(population 5,000+)"
#17 on the list of "Top 100 cities with highest median household income and median resident age less than 35"
#19 on the list of "Top 101 cities with the lowest number of thefts per 100,000 residents (population 5,000+)"
#23 on the list of "Top 101 cities with the lowest city-data.com crime index (population 5,000+)"
#29 on the list of "Top 101 cities with the most residents born in Israel (population 500+)"
#31 on the list of "Top 100 safest cities (lowest city-data.com crime index) (pop. 5,000+)"
#35 on the list of "Top 101 cities with largest percentage of females in industries: real estate and rental and leasing (population 5,000+)"
#36 on the list of "Top 101 cities with the lowest number of burglaries per 100,000 residents (population 5,000+)"
#47 on the list of "Top 100 cities with biggest houses (pop. 5,000+)"
#53 on the list of "Top 101 cities with largest percentage of females in occupations: life, physical, and social science occupations (population 5,000+)"
#1 (11024) on the list of "Top 101 zip codes with the largest percentage of taxpayers using paid preparers for 2012 taxes (pop 5,000+)"
#34 (11024) on the list of "Top 101 zip codes with the highest 2012 average taxable interest for individuals (pop 5,000+)"
#57 (11024) on the list of "Top 101 zip codes with the largest percentage of Russian first ancestries (pop 5,000+)"
#62 (11024) on the list of "Top 101 zip codes with the highest 2012 average reported profit/loss from business (pop 5,000+)"
#64 (11024) on the list of "Top 101 zip codes with the highest 2012 average Adjusted Gross Income (AGI) for individuals (pop 5,000+)"
#85 (11024) on the list of "Top 101 zip codes with the highest 2012 average net capital gain/loss (pop 5,000+)"
#8 on the list of "Top 101 counties with the most Orthodox adherents"
#9 on the list of "Top 101 counties with the most Catholic adherents"
#11 on the list of "Top 101 counties with the lowest percentage of residents that keep firearms around their homes"
#13 on the list of "Top 101 counties with the highest ground withdrawal of fresh water for public supply"
#13 on the list of "Top 101 counties with the most Orthodox congregations"
There are 24 pilots and no other airmen in this city.


 Recent articles from our blog. Our writers, many of them Ph.D. graduates or candidates, create easy-to-read articles on a wide variety of topics.

 (4.6 miles