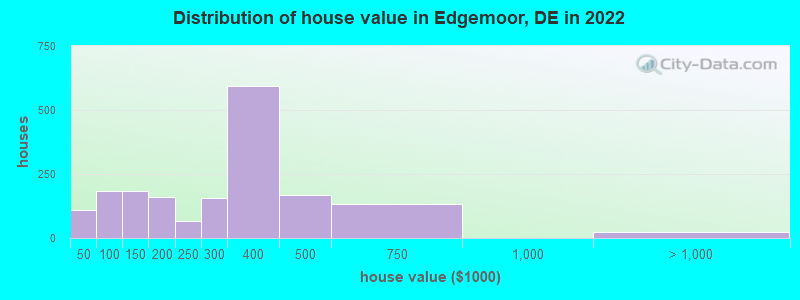
Estimated median house or condo value in 2022: $304,492 (it was $118,400 in 2000)
Edgemoor:
$304,492
DE:
$337,200
Mean prices in 2022:all housing units: $377,702; detached houses: $422,634; townhouses or other attached units: $276,374; in 2-unit structures: $193,032; in 3-to-4-unit structures: $559,065; in 5-or-more-unit structures: $187,236; mobile homes: $63,843; occupied boats, rvs, vans, etc.: $129,840
Median gross rent in 2022: $1,267.
March 2022 cost of living index in Edgemoor: 103.2 (near average, U.S. average is 100)
Percentage of residents living in poverty in 2022: 23.5%
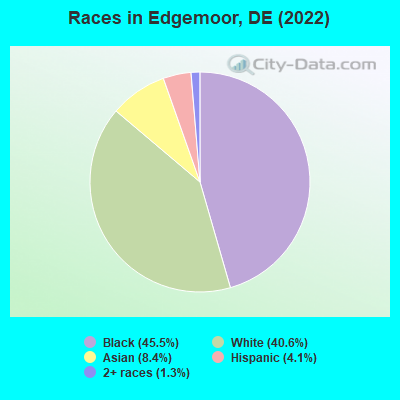
(10.1% for White Non-Hispanic residents, 28.2% for Black residents, 23.8% for two or more races residents)
Latest news from Edgemoor, DE collected exclusively by city-data.com from local newspapers, TV, and radio stations
Ancestries: Italian (12.2%), Irish (5.4%), English (3.1%), German (2.8%), American (1.7%), British (1.5%).
Current Local Time: EST time zone
Elevation: 60 feet
Land area: 1.82 square miles.
Population density: 3,115 people per square mile (average).
835 residents are foreign born (8.3% Asia, 3.0% Latin America, 1.3% Europe).
This place:
12.8%
Delaware:
9.8%
Median real estate property taxes paid for housing units with mortgages in 2022: $1,402 (0.4%) Median real estate property taxes paid for housing units with no mortgage in 2022: $2,151 (0.8%)
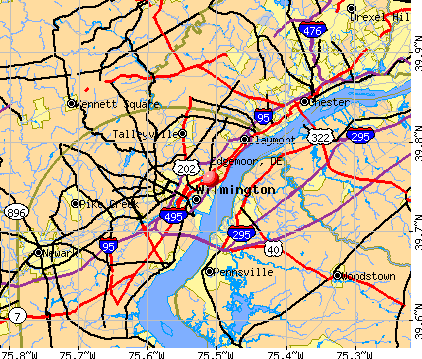
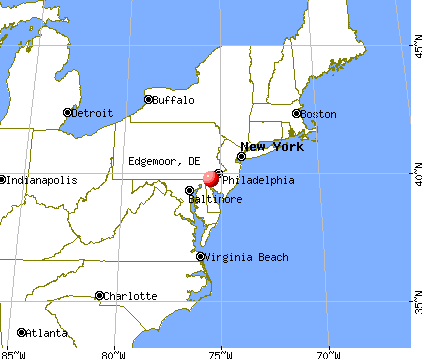
Nearest city with pop. 50,000+: Wilmington, DE (2.4 miles , pop. 72,664).
Nearest city with pop. 200,000+: Philadelphia, PA (25.5 miles , pop. 1,517,550).
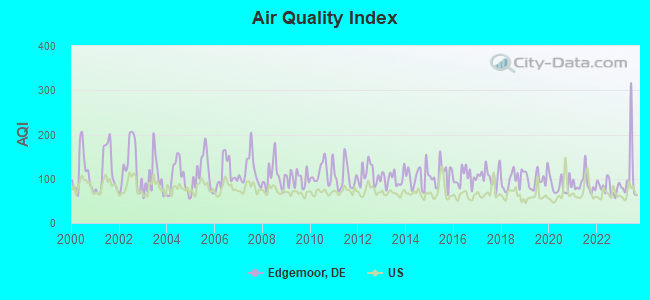
Air Quality Index (AQI) level in 2023 was 106. This is significantly worse than average.
City:
106
U.S.:
73
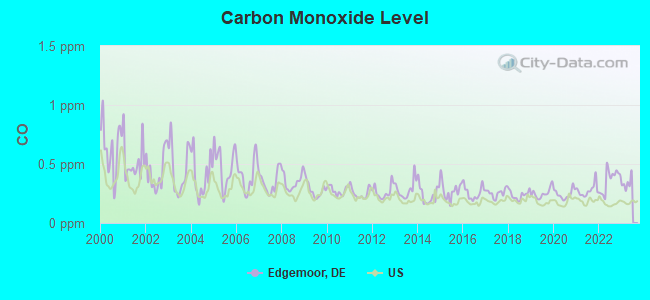
Carbon Monoxide (CO) [ppm] level in 2022 was 0.364. This is significantly worse than average.Closest monitor was 2.0 miles away from the city center.
City:
0.364
U.S.:
0.251
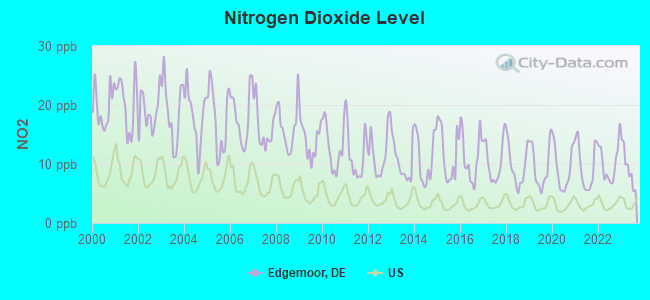
Nitrogen Dioxide (NO2) [ppb] level in 2023 was 9.38. This is significantly worse than average.Closest monitor was 0.9 miles away from the city center.
City:
9.38
U.S.:
5.11
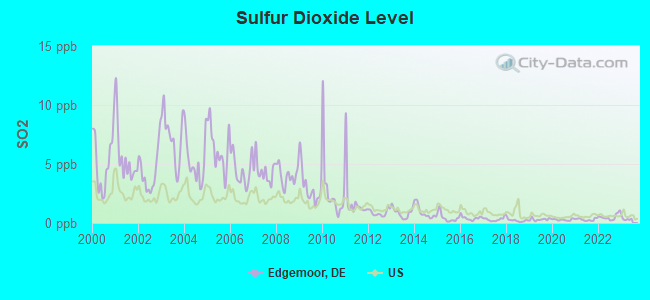
Sulfur Dioxide (SO2) [ppb] level in 2022 was 0.516. This is significantly better than average.Closest monitor was 0.9 miles away from the city center.
City:
0.516
U.S.:
1.515
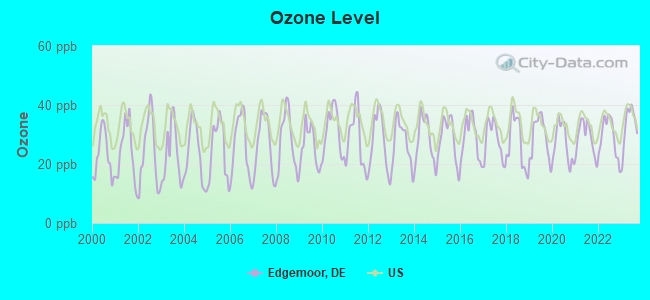
Ozone [ppb] level in 2023 was 33.0. This is about average.Closest monitor was 0.9 miles away from the city center.
City:
33.0
U.S.:
33.3
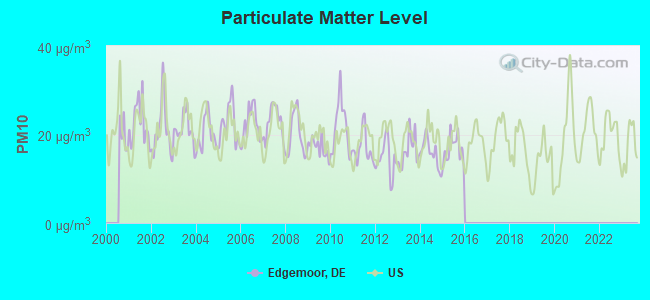
Particulate Matter (PM10) [µg/m3] level in 2015 was 16.7. This is about average.Closest monitor was 0.9 miles away from the city center.
City:
16.7
U.S.:
19.2
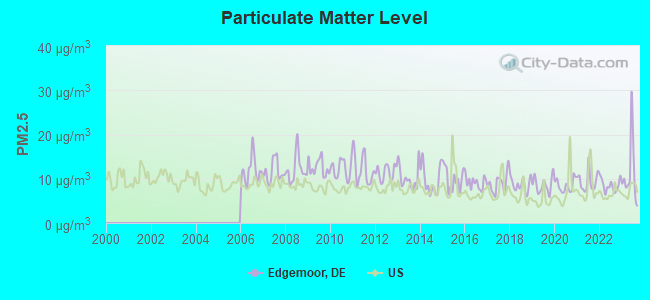
Particulate Matter (PM2.5) [µg/m3] level in 2023 was 11.2. This is worse than average.Closest monitor was 0.9 miles away from the city center.
City:
11.2
U.S.:
8.1
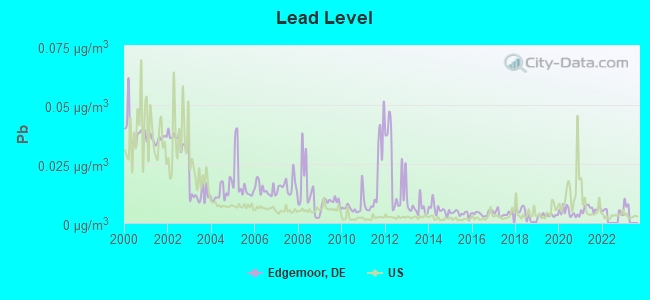
Lead (Pb) [µg/m3] level in 2021 was 0.00611. This is significantly better than average.Closest monitor was 2.0 miles away from the city center.
City:
0.00611
U.S.:
0.00931
Tornado activity:
Edgemoor-area historical tornado activity is slightly above Delaware state average. It is 6% greater than the overall U.S. average.
On 4/28/1961, a category F3 (max. wind speeds 158-206 mph) tornado 6.9 miles away from the Edgemoor place center causedbetween $5000 and $50,000 in damages.
On 7/27/1994, a category F3 tornado 13.2 miles away from the place center injured 11 peopleand causedbetween $500,000 and $5,000,000 in damages.
Earthquake activity:
Edgemoor-area historical earthquake activity is significantly above Delaware state average. It is 64% smaller than the overall U.S. average.
On 8/23/2011 at 17:51:04, a magnitude 5.8 (5.8 MW, Depth: 3.7 mi, Class: Moderate, Intensity: VI - VII) earthquake occurred 182.9 miles away from the city center On 1/16/1994 at 01:49:16, a magnitude 4.6 (4.6 MB, 4.6 LG, Depth: 3.1 mi, Class: Light, Intensity: IV - V) earthquake occurred 48.5 miles away from Edgemoor center On 1/16/1994 at 00:42:43, a magnitude 4.2 (4.2 MB, 4.0 LG, Depth: 3.1 mi) earthquake occurred 47.4 miles away from the city center On 11/30/2017 at 21:47:31, a magnitude 4.1 (4.1 MW, Depth: 6.1 mi) earthquake occurred 39.0 miles away from the city center On 10/7/1983 at 10:18:46, a magnitude 5.3 (5.1 MB, 5.3 LG, 5.1 ML) earthquake occurred 296.3 miles away from Edgemoor center On 9/25/1998 at 19:52:52, a magnitude 5.2 (4.8 MB, 4.3 MS, 5.2 LG, 4.5 MW, Depth: 3.1 mi) earthquake occurred 283.1 miles away from the city center Magnitude types: regional Lg-wave magnitude (LG), body-wave magnitude (MB), local magnitude (ML), surface-wave magnitude (MS), moment magnitude (MW)
Natural disasters:
The number of natural disasters in New Castle County (15) is near the US average (15). Major Disasters (Presidential) Declared: 9 Emergencies Declared: 5
Causes of natural disasters: Hurricanes: 7, Snowstorms: 2, Tropical Storms: 2, Winter Storms: 2, Blizzard: 1, Flood: 1, Snowfall: 1, Storm: 1, Tornado: 1, Water Shortage: 1, Other: 1 (Note: some incidents may be assigned to more than one category).
Hospitals and medical centers near Edgemoor:
MILTON AND HATTIE KUTZ HOME (Nursing Home, about 1 miles away; WILMINGTON, DE)
FRESENIUS MEDICAL CARE NORTH WILMINGTON (Dialysis Facility, about 1 miles away; WILMINGTON, DE)
MARY CAMPBELL CENTER (Hospital, about 2 miles away; WILMINGTON, DE)
MANORCARE HEALTH SERVICES - WILMINGTON (Nursing Home, about 3 miles away; WILMINGTON, DE)
ASTON HOME HEALTH, INC (Home Health Center, about 3 miles away; WILMINGTON, DE)
GILPIN HALL (Nursing Home, about 3 miles away; WILMINGTON, DE)
LIBERTY DIALYSIS - WILMINGTON (Dialysis Facility, about 3 miles away; WILMINGTON, DE)
Amtrak stations near Edgemoor:
3 miles: WILMINGTON (M. L. KING BLVD, & FRENCH ST.) . Services: ticket office, partially wheelchair accessible, enclosed waiting area, public restrooms, public payphones, snack bar, ATM, paid short-term parking, paid long-term parking, car rental agency, taxi stand, intercity bus service, public transit connection.
15 miles: NEWARK (429 S. COLLEGE AVE.) . Services: public payphones, free short-term parking, call for car rental service, call for taxi service, public transit connection.
20 miles: EXTON (CREST AVE. OFF RTE. 100) . Services: partially wheelchair accessible, public payphones, paid short-term parking, call for car rental service, public transit connection.
Operable nuclear power plants near Edgemoor:
14 miles: Salem 2 in Salem, NJ.
14 miles: Hope Creek in Salem, NJ.
14 miles: Salem 1 in Salem, NJ.
Colleges/universities with over 2000 students nearest to Edgemoor:
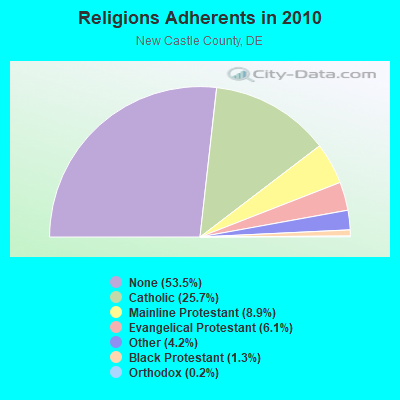
Churches in Edgemoor include: Calvary Episcopal Church (A), Grace Baptist Church (B), Saint Helenas Catholic Church (C), Hillcrest-Bellefont Methodist Church (D). Display/hide their locations on the map
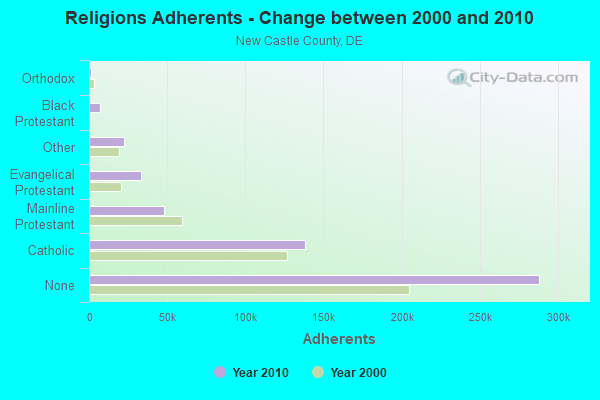
Religion statistics for Edgemoor, DE (based on New Castle County data)
Religion
Adherents
Congregations
Catholic
138,172
33
Mainline Protestant
48,124
125
Evangelical Protestant
32,993
169
Other
22,672
45
Black Protestant
7,212
36
Orthodox
1,166
5
None
288,140
-
Source: Clifford Grammich, Kirk Hadaway, Richard Houseal, Dale E.Jones, Alexei Krindatch, Richie Stanley and Richard H.Taylor. 2012. 2010 U.S.Religion Census: Religious Congregations & Membership Study. Association of Statisticians of American Religious Bodies. Jones, Dale E., et al. 2002. Congregations and Membership in the United States 2000. Nashville, TN: Glenmary Research Center. Graphs represent county-level data
STATION, W Side Of Delaware River 1.1 Mi S Of (Lat: 39.739000 Lon: -75.503250), Structure height: 52.7 m, Call Sign: WJI79, Assigned Frequencies: 19265.0 MHz, Grant Date: 03/08/1999, Expiration Date: 04/14/2009, Cancellation Date: 02/24/2003, Phone: (302) 224-7106
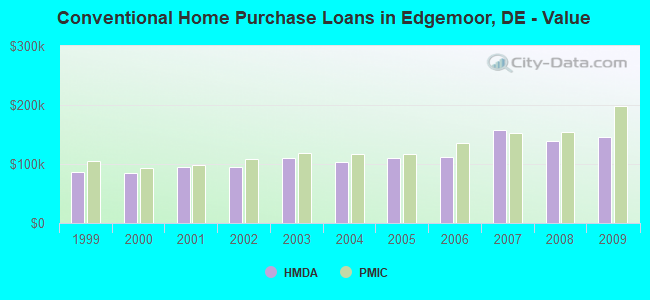
Home Mortgage Disclosure Act Aggregated Statistics For Year 2009 (Based on 1 partial tract)
A) FHA, FSA/RHS & VA Home Purchase Loans
B) Conventional Home Purchase Loans
C) Refinancings
D) Home Improvement Loans
F) Non-occupant Loans on < 5 Family Dwellings (A B C & D)
Number
Average Value
Number
Average Value
Number
Average Value
Number
Average Value
Number
Average Value
LOANS ORIGINATED
18
$178,196
18
$145,507
53
$155,236
9
$45,841
5
$120,420
APPLICATIONS APPROVED, NOT ACCEPTED
1
$194,310
2
$148,130
5
$181,586
3
$8,440
1
$162,160
APPLICATIONS DENIED
2
$122,470
2
$123,500
25
$145,899
10
$27,710
3
$82,103
APPLICATIONS WITHDRAWN
3
$165,120
2
$119,395
15
$141,857
2
$114,945
1
$148,470
FILES CLOSED FOR INCOMPLETENESS
1
$210,050
0
$0
3
$114,033
0
$0
0
$0
Aggregated Statistics For Year 2008 (Based on 1 partial tract)
A) FHA, FSA/RHS & VA Home Purchase Loans
B) Conventional Home Purchase Loans
C) Refinancings
D) Home Improvement Loans
E) Loans on Dwellings For 5+ Families
F) Non-occupant Loans on < 5 Family Dwellings (A B C & D)
G) Loans On Manufactured Home Dwelling (A B C & D)
Number
Average Value
Number
Average Value
Number
Average Value
Number
Average Value
Number
Average Value
Number
Average Value
Number
Average Value
LOANS ORIGINATED
11
$169,060
42
$139,349
37
$143,368
11
$47,707
1
$458,410
14
$82,104
0
$0
APPLICATIONS APPROVED, NOT ACCEPTED
1
$180,630
1
$65,680
10
$100,304
3
$43,103
0
$0
1
$113,580
0
$0
APPLICATIONS DENIED
1
$248,360
5
$120,146
53
$134,090
18
$66,557
0
$0
5
$134,924
1
$19,160
APPLICATIONS WITHDRAWN
1
$251,100
3
$193,173
17
$140,382
0
$0
0
$0
1
$156,000
0
$0
FILES CLOSED FOR INCOMPLETENESS
0
$0
0
$0
3
$180,630
1
$123,160
0
$0
0
$0
0
$0
Aggregated Statistics For Year 2007 (Based on 1 partial tract)
A) FHA, FSA/RHS & VA Home Purchase Loans
B) Conventional Home Purchase Loans
C) Refinancings
D) Home Improvement Loans
E) Loans on Dwellings For 5+ Families
F) Non-occupant Loans on < 5 Family Dwellings (A B C & D)
G) Loans On Manufactured Home Dwelling (A B C & D)
Number
Average Value
Number
Average Value
Number
Average Value
Number
Average Value
Number
Average Value
Number
Average Value
Number
Average Value
LOANS ORIGINATED
4
$166,260
72
$157,537
57
$127,417
18
$53,634
1
$251,790
22
$153,416
0
$0
APPLICATIONS APPROVED, NOT ACCEPTED
0
$0
6
$100,920
14
$152,772
7
$36,947
0
$0
3
$52,910
2
$60,550
APPLICATIONS DENIED
0
$0
8
$91,084
64
$136,915
35
$107,009
0
$0
5
$93,462
1
$11,630
APPLICATIONS WITHDRAWN
1
$294,890
7
$141,239
31
$168,159
5
$90,588
0
$0
0
$0
0
$0
FILES CLOSED FOR INCOMPLETENESS
0
$0
2
$131,710
8
$139,919
3
$69,103
0
$0
0
$0
0
$0
Aggregated Statistics For Year 2006 (Based on 1 partial tract)
A) FHA, FSA/RHS & VA Home Purchase Loans
B) Conventional Home Purchase Loans
C) Refinancings
D) Home Improvement Loans
F) Non-occupant Loans on < 5 Family Dwellings (A B C & D)
G) Loans On Manufactured Home Dwelling (A B C & D)
Number
Average Value
Number
Average Value
Number
Average Value
Number
Average Value
Number
Average Value
Number
Average Value
LOANS ORIGINATED
3
$168,313
104
$112,064
88
$117,659
26
$51,262
42
$75,995
1
$3,420
APPLICATIONS APPROVED, NOT ACCEPTED
1
$125,890
12
$106,792
14
$137,720
8
$18,901
3
$61,577
0
$0
APPLICATIONS DENIED
0
$0
16
$104,511
42
$132,653
27
$46,475
13
$73,104
1
$60,890
APPLICATIONS WITHDRAWN
2
$226,130
8
$138,038
34
$130,058
5
$144,366
3
$56,103
0
$0
FILES CLOSED FOR INCOMPLETENESS
0
$0
3
$113,577
21
$163,817
0
$0
1
$46,530
0
$0
Aggregated Statistics For Year 2005 (Based on 1 partial tract)
A) FHA, FSA/RHS & VA Home Purchase Loans
B) Conventional Home Purchase Loans
C) Refinancings
D) Home Improvement Loans
F) Non-occupant Loans on < 5 Family Dwellings (A B C & D)
G) Loans On Manufactured Home Dwelling (A B C & D)
Number
Average Value
Number
Average Value
Number
Average Value
Number
Average Value
Number
Average Value
Number
Average Value
LOANS ORIGINATED
2
$166,605
103
$110,913
104
$132,274
14
$41,589
34
$73,411
0
$0
APPLICATIONS APPROVED, NOT ACCEPTED
0
$0
10
$104,683
21
$101,131
3
$42,650
3
$55,647
0
$0
APPLICATIONS DENIED
0
$0
14
$101,409
48
$127,717
17
$49,262
5
$74,168
2
$42,080
APPLICATIONS WITHDRAWN
0
$0
14
$83,521
36
$110,175
6
$112,893
4
$58,840
0
$0
FILES CLOSED FOR INCOMPLETENESS
0
$0
1
$20,530
21
$137,003
1
$15,740
1
$74,580
0
$0
Aggregated Statistics For Year 2004 (Based on 1 partial tract)
A) FHA, FSA/RHS & VA Home Purchase Loans
B) Conventional Home Purchase Loans
C) Refinancings
D) Home Improvement Loans
F) Non-occupant Loans on < 5 Family Dwellings (A B C & D)
Number
Average Value
Number
Average Value
Number
Average Value
Number
Average Value
Number
Average Value
LOANS ORIGINATED
1
$191,580
104
$103,623
109
$109,340
16
$41,309
37
$71,286
APPLICATIONS APPROVED, NOT ACCEPTED
0
$0
6
$92,253
30
$97,749
7
$53,367
5
$64,862
APPLICATIONS DENIED
1
$58,840
9
$95,940
78
$107,656
23
$49,203
8
$81,932
APPLICATIONS WITHDRAWN
0
$0
5
$115,492
38
$104,719
6
$46,298
5
$62,810
FILES CLOSED FOR INCOMPLETENESS
0
$0
1
$80,050
19
$129,530
0
$0
1
$41,050
Aggregated Statistics For Year 2003 (Based on 1 partial tract)
A) FHA, FSA/RHS & VA Home Purchase Loans
B) Conventional Home Purchase Loans
C) Refinancings
D) Home Improvement Loans
F) Non-occupant Loans on < 5 Family Dwellings (A B C & D)
Number
Average Value
Number
Average Value
Number
Average Value
Number
Average Value
Number
Average Value
LOANS ORIGINATED
8
$150,096
93
$110,355
149
$111,042
10
$44,131
34
$76,630
APPLICATIONS APPROVED, NOT ACCEPTED
1
$71,160
7
$115,630
35
$112,737
5
$53,914
3
$72,980
APPLICATIONS DENIED
1
$79,370
16
$87,108
84
$115,516
8
$20,868
10
$57,473
APPLICATIONS WITHDRAWN
1
$179,940
3
$141,173
44
$126,966
5
$56,788
1
$49,260
FILES CLOSED FOR INCOMPLETENESS
0
$0
0
$0
7
$103,217
1
$32,840
1
$45,160
Aggregated Statistics For Year 2002 (Based on 1 partial tract)
A) FHA, FSA/RHS & VA Home Purchase Loans
B) Conventional Home Purchase Loans
C) Refinancings
D) Home Improvement Loans
E) Loans on Dwellings For 5+ Families
F) Non-occupant Loans on < 5 Family Dwellings (A B C & D)
Number
Average Value
Number
Average Value
Number
Average Value
Number
Average Value
Number
Average Value
Number
Average Value
LOANS ORIGINATED
12
$129,485
79
$94,324
88
$108,220
13
$23,210
0
$0
21
$61,448
APPLICATIONS APPROVED, NOT ACCEPTED
0
$0
7
$109,374
27
$77,010
5
$19,568
0
$0
3
$65,227
APPLICATIONS DENIED
1
$87,580
5
$83,882
64
$76,235
10
$13,273
1
$17,110
6
$62,718
APPLICATIONS WITHDRAWN
1
$41,050
8
$85,354
29
$90,975
1
$17,110
0
$0
1
$36,950
FILES CLOSED FOR INCOMPLETENESS
0
$0
2
$123,840
13
$82,683
1
$13,680
0
$0
1
$88,260
Aggregated Statistics For Year 2001 (Based on 1 partial tract)
A) FHA, FSA/RHS & VA Home Purchase Loans
B) Conventional Home Purchase Loans
C) Refinancings
D) Home Improvement Loans
F) Non-occupant Loans on < 5 Family Dwellings (A B C & D)
Number
Average Value
Number
Average Value
Number
Average Value
Number
Average Value
Number
Average Value
LOANS ORIGINATED
17
$116,756
82
$94,970
62
$92,036
15
$22,259
12
$57,472
APPLICATIONS APPROVED, NOT ACCEPTED
0
$0
5
$120,692
10
$78,341
3
$35,580
1
$95,790
APPLICATIONS DENIED
1
$116,310
12
$80,678
31
$60,254
13
$20,210
2
$39,340
APPLICATIONS WITHDRAWN
1
$199,790
3
$90,770
25
$87,687
3
$37,630
0
$0
FILES CLOSED FOR INCOMPLETENESS
0
$0
0
$0
4
$121,958
0
$0
0
$0
Aggregated Statistics For Year 2000 (Based on 1 partial tract)
A) FHA, FSA/RHS & VA Home Purchase Loans
B) Conventional Home Purchase Loans
C) Refinancings
D) Home Improvement Loans
F) Non-occupant Loans on < 5 Family Dwellings (A B C & D)
Number
Average Value
Number
Average Value
Number
Average Value
Number
Average Value
Number
Average Value
LOANS ORIGINATED
8
$89,374
75
$85,379
23
$60,864
15
$16,421
12
$61,635
APPLICATIONS APPROVED, NOT ACCEPTED
1
$55,420
3
$49,947
8
$65,085
1
$91,680
1
$24,630
APPLICATIONS DENIED
1
$80,050
17
$71,358
25
$52,054
11
$16,670
1
$32,160
APPLICATIONS WITHDRAWN
0
$0
8
$105,965
11
$76,693
0
$0
1
$58,160
FILES CLOSED FOR INCOMPLETENESS
0
$0
1
$13,000
0
$0
0
$0
0
$0
Aggregated Statistics For Year 1999 (Based on 2 partial tracts)
A) FHA, FSA/RHS & VA Home Purchase Loans
B) Conventional Home Purchase Loans
C) Refinancings
D) Home Improvement Loans
F) Non-occupant Loans on < 5 Family Dwellings (A B C & D)
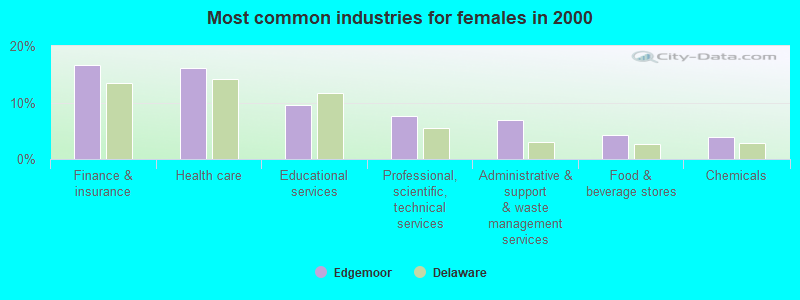
#14 on the list of "Top 101 cities with largest percentage of females in industries: management of companies and enterprises (population 5,000+)"
#37 on the list of "Top 101 cities with the most residents born in United Kingdom (population 500+)"
#37 on the list of "Top 101 cities with the most residents born in Yugoslavia (population 500+)"
#37 on the list of "Top 101 cities with the most residents born in Asia, n.e.c. (population 500+)"
#37 on the list of "Top 101 cities with the most residents born in Melanesia (population 500+)"
#37 on the list of "Top 101 cities with the most residents born in Micronesia (population 500+)"
#37 on the list of "Top 101 cities with the most residents born in Polynesia (population 500+)"
#43 on the list of "Top 101 cities with the smallest racial income disparities between White and Black householders (with at least 200 householders)"
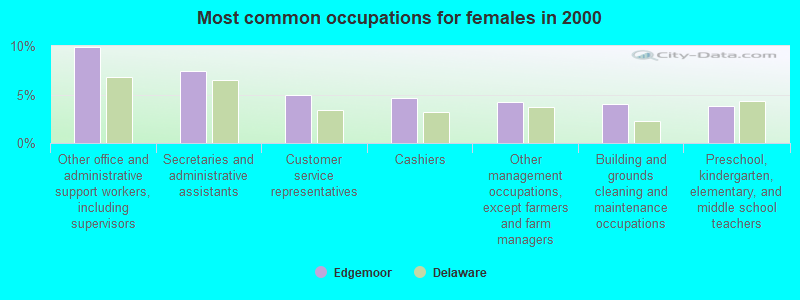
#56 on the list of "Top 101 cities with largest percentage of females in occupations: community and social service occupations (population 5,000+)"
#59 on the list of "Top 101 cities with the most residents born in Other South Eastern Asia (population 500+)"
#65 on the list of "Top 101 cities with the largest percentage of likely homosexual households (counted as self-reported same-sex unmarried-partner households) (population 5,000+)"
#65 on the list of "Top 101 cities with the largest percentage of likely gay men couples (counted as self-reported male-male unmarried-partner households) (population 5,000+)"
#65 on the list of "Top 101 cities with largest percentage of females in industries: transportation and warehousing (population 5,000+)"
#65 on the list of "Top 101 cities with the most residents born in Born at sea (population 500+)"
#70 on the list of "Top 101 cities with the most residents born in Italy (population 500+)"
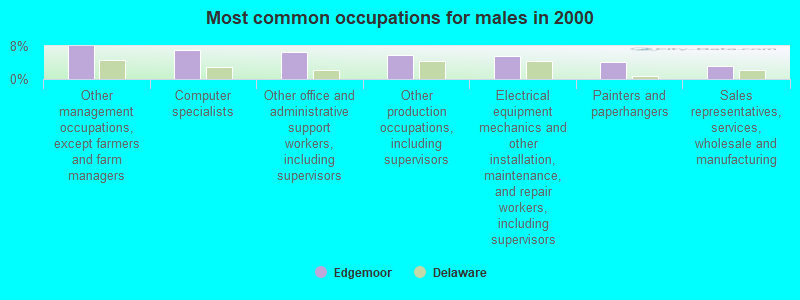
#78 on the list of "Top 101 cities with largest percentage of males in industries: information (population 5,000+)"
#17 on the list of "Top 101 counties with the highest number of infant deaths per 1000 residents 2007-2013 (pop. 50,000+)"
#35 on the list of "Top 101 counties with the highest percentage of residents that visited a dentist within the past year"
#51 on the list of "Top 101 counties with the highest carbon monoxide air pollution readings in 2012 (ppm)"
#53 on the list of "Top 101 counties with the highest average weight of females"
#55 on the list of "Top 101 counties with the highest Nitrogen Dioxide air pollution readings in 2012 (ppm)"


 Recent articles from our blog. Our writers, many of them Ph.D. graduates or candidates, create easy-to-read articles on a wide variety of topics.

 (2.4 miles