Percentage of residents living in poverty in 2022: 11.3%
(11.8% for White Non-Hispanic residents, 5.6% for Hispanic or Latino residents, 14.3% for two or more races residents)
According to our research of Delaware and other state lists, there were 2 registered sex offenders living in Delaware City, Delaware as of May 04, 2024. The ratio of all residents to sex offenders in Delaware City is 944 to 1. The ratio of registered sex offenders to all residents in this city is much lower than the state average.
Crime rates in Delaware City by year
Type
2009
2010
2011
2012
2013
2014
2015
2016
2017
2018
2019
2020
2021
2022
Murders (per 100,000)
0 (0.0)
0 (0.0)
0 (0.0)
0 (0.0)
0 (0.0)
0 (0.0)
0 (0.0)
0 (0.0)
0 (0.0)
0 (0.0)
0 (0.0)
0 (0.0)
0 (0.0)
0 (0.0)
Rapes (per 100,000)
1 (65.7)
0 (0.0)
0 (0.0)
0 (0.0)
1 (58.2)
0 (0.0)
3 (172.4)
2 (114.3)
2 (114.3)
1 (54.5)
1 (54.6)
0 (0.0)
1 (54.0)
0 (0.0)
Robberies (per 100,000)
1 (65.7)
0 (0.0)
1 (58.4)
2 (115.9)
1 (58.2)
1 (57.7)
1 (57.5)
1 (57.1)
1 (57.1)
0 (0.0)
0 (0.0)
1 (54.2)
2 (108.0)
0 (0.0)
Assaults (per 100,000)
3 (197.0)
2 (118.0)
5 (292.1)
2 (115.9)
3 (174.5)
4 (230.9)
6 (344.8)
1 (57.1)
6 (342.9)
9 (490.5)
10 (546.4)
10 (542.3)
4 (216.0)
2 (106.3)
Burglaries (per 100,000)
11 (722.3)
10 (590.0)
5 (292.1)
11 (637.7)
20 (1,163)
30 (1,732)
10 (574.7)
18 (1,029)
11 (628.6)
3 (163.5)
11 (601.1)
8 (433.8)
4 (216.0)
2 (106.3)
Thefts (per 100,000)
17 (1,116)
22 (1,298)
21 (1,227)
27 (1,565)
37 (2,152)
28 (1,617)
28 (1,609)
63 (3,600)
40 (2,286)
27 (1,471)
41 (2,240)
23 (1,247)
21 (1,134)
16 (850.6)
Auto thefts (per 100,000)
1 (65.7)
3 (177.0)
1 (58.4)
0 (0.0)
3 (174.5)
2 (115.5)
0 (0.0)
3 (171.4)
3 (171.4)
0 (0.0)
0 (0.0)
1 (54.2)
1 (54.0)
0 (0.0)
Arson (per 100,000)
1 (65.7)
1 (59.0)
0 (0.0)
0 (0.0)
0 (0.0)
1 (57.7)
0 (0.0)
0 (0.0)
0 (0.0)
0 (0.0)
0 (0.0)
0 (0.0)
1 (54.0)
0 (0.0)
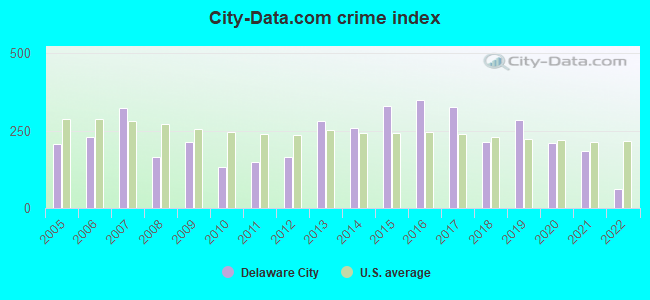
City-Data.com crime index
212.1
131.0
150.1
165.2
280.4
258.7
328.7
349.7
326.3
212.0
284.7
209.3
183.6
62.7
The City-Data.com crime index weighs serious crimes and violent crimes more heavily. Higher means more crime, U.S. average is 246.1. It adjusts for the number of visitors and daily workers commuting into cities.
Latest news from Delaware City, DE collected exclusively by city-data.com from local newspapers, TV, and radio stations
Ancestries: Irish (11.6%), German (11.0%), English (7.8%), Polish (7.2%), Italian (6.0%), American (3.5%).
Current Local Time: EST time zone
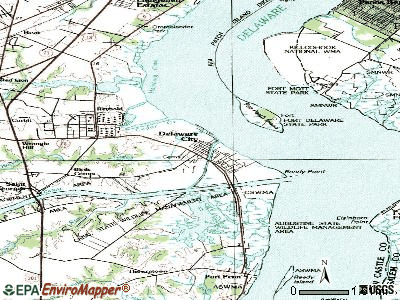
Elevation: 9 feet
Land area: 1.26 square miles.
Population density: 1,507 people per square mile (low).
20 residents are foreign born
This city:
1.0%
Delaware:
9.8%
Median real estate property taxes paid for housing units with mortgages in 2022: $1,700 (0.7%) Median real estate property taxes paid for housing units with no mortgage in 2022: $885 (0.4%)
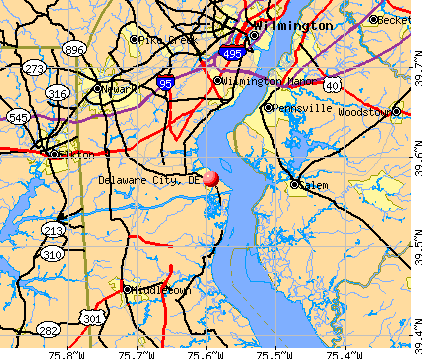
Nearest city with pop. 50,000+: Greater Newark, DE (10.8 miles , pop. 67,114).
Nearest city with pop. 200,000+: Philadelphia, PA (37.8 miles , pop. 1,517,550).
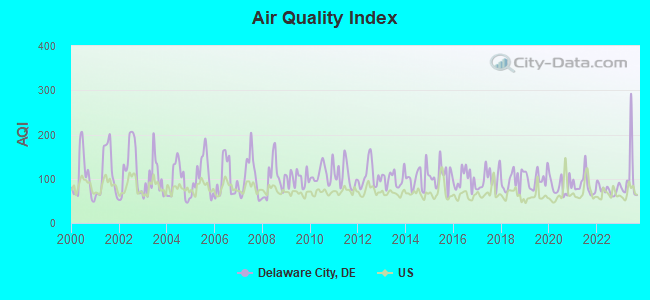
Air Quality Index (AQI) level in 2023 was 103. This is significantly worse than average.
City:
103
U.S.:
73
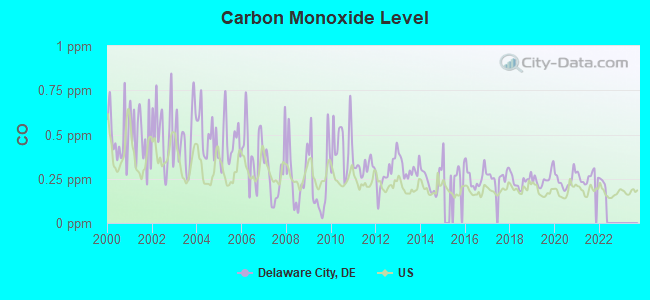
Carbon Monoxide (CO) [ppm] level in 2021 was 0.259. This is about average.Closest monitor was 0.6 miles away from the city center.
City:
0.259
U.S.:
0.251
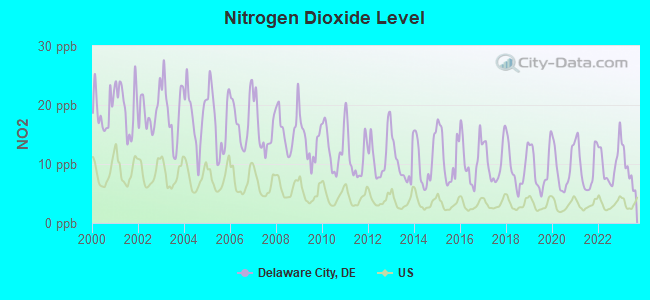
Nitrogen Dioxide (NO2) [ppb] level in 2023 was 8.99. This is significantly worse than average.Closest monitor was 5.7 miles away from the city center.
City:
8.99
U.S.:
5.11
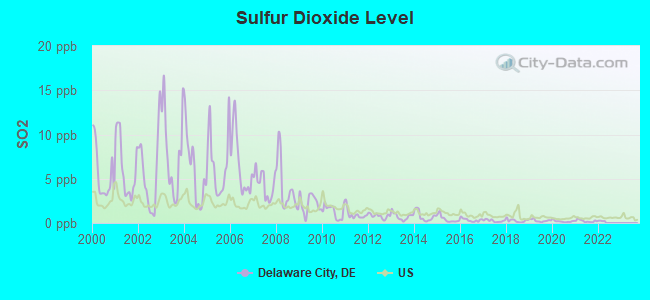
Sulfur Dioxide (SO2) [ppb] level in 2021 was 0.227. This is significantly better than average.Closest monitor was 0.6 miles away from the city center.
City:
0.227
U.S.:
1.515
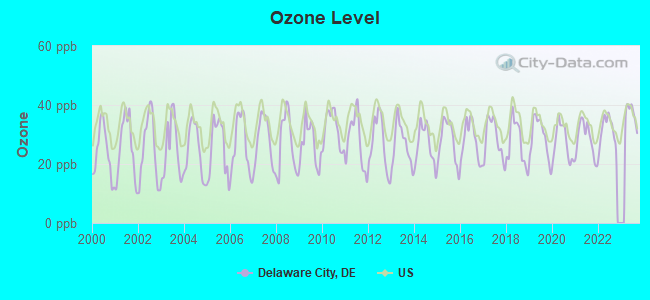
Ozone [ppb] level in 2023 was 36.9. This is about average.Closest monitor was 5.7 miles away from the city center.
City:
36.9
U.S.:
33.3
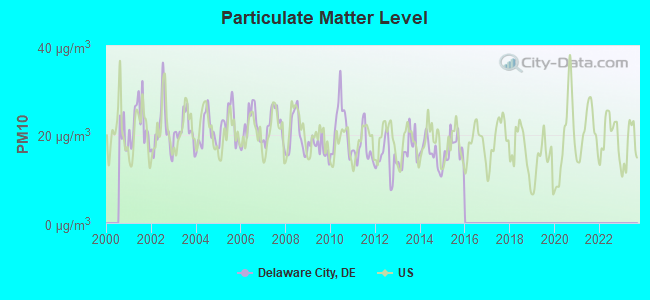
Particulate Matter (PM10) [µg/m3] level in 2015 was 16.7. This is about average.Closest monitor was 8.7 miles away from the city center.
City:
16.7
U.S.:
19.2
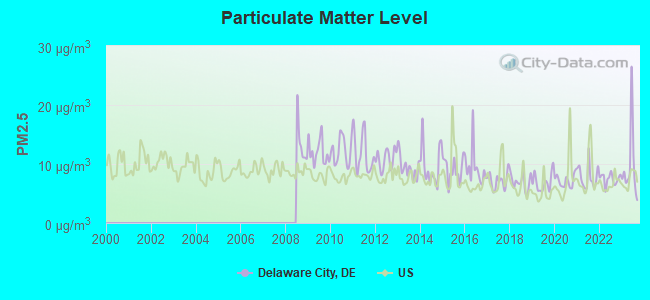
Particulate Matter (PM2.5) [µg/m3] level in 2023 was 9.59. This is about average.Closest monitor was 0.6 miles away from the city center.
City:
9.59
U.S.:
8.11
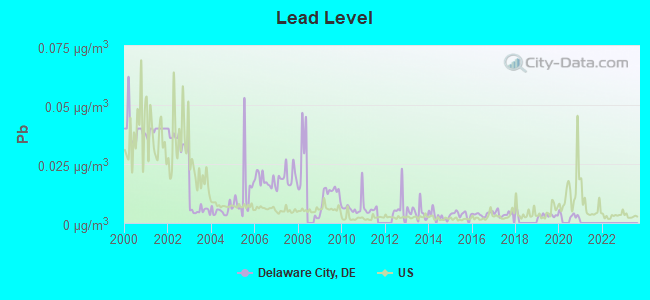
Lead (Pb) [µg/m3] level in 2020 was 0.00328. This is significantly better than average.Closest monitor was 0.6 miles away from the city center.
City:
0.00328
U.S.:
0.00931
Tornado activity:
Delaware City-area historical tornado activity is slightly above Delaware state average. It is 2% greater than the overall U.S. average.
On 4/28/1961, a category F3 (max. wind speeds 158-206 mph) tornado 6.7 miles away from the Delaware City city center causedbetween $5000 and $50,000 in damages.
On 7/27/1994, a category F3 tornado 14.6 miles away from the city center injured 11 peopleand causedbetween $500,000 and $5,000,000 in damages.
Earthquake activity:
Delaware City-area historical earthquake activity is significantly above Delaware state average. It is 64% smaller than the overall U.S. average.
On 8/23/2011 at 17:51:04, a magnitude 5.8 (5.8 MW, Depth: 3.7 mi, Class: Moderate, Intensity: VI - VII) earthquake occurred 171.0 miles away from the city center On 1/16/1994 at 01:49:16, a magnitude 4.6 (4.6 MB, 4.6 LG, Depth: 3.1 mi, Class: Light, Intensity: IV - V) earthquake occurred 57.3 miles away from Delaware City center On 11/30/2017 at 21:47:31, a magnitude 4.1 (4.1 MW, Depth: 6.1 mi) earthquake occurred 27.5 miles away from the city center On 1/16/1994 at 00:42:43, a magnitude 4.2 (4.2 MB, 4.0 LG, Depth: 3.1 mi) earthquake occurred 56.5 miles away from the city center On 9/25/1998 at 19:52:52, a magnitude 5.2 (4.8 MB, 4.3 MS, 5.2 LG, 4.5 MW, Depth: 3.1 mi) earthquake occurred 285.1 miles away from Delaware City center On 10/7/1983 at 10:18:46, a magnitude 5.3 (5.1 MB, 5.3 LG, 5.1 ML) earthquake occurred 309.6 miles away from the city center Magnitude types: regional Lg-wave magnitude (LG), body-wave magnitude (MB), local magnitude (ML), surface-wave magnitude (MS), moment magnitude (MW)
Natural disasters:
The number of natural disasters in New Castle County (15) is near the US average (15). Major Disasters (Presidential) Declared: 9 Emergencies Declared: 5
Causes of natural disasters: Hurricanes: 7, Snowstorms: 2, Tropical Storms: 2, Winter Storms: 2, Blizzard: 1, Flood: 1, Snowfall: 1, Storm: 1, Tornado: 1, Water Shortage: 1, Other: 1 (Note: some incidents may be assigned to more than one category).
Hospitals and medical centers in Delaware City:
GOVERNOR BACON HEALTH CENTER (P.O. BOX 559)
Other hospitals and medical centers near Delaware City:
ARBORS AT NEW CASTLE (Nursing Home, about 5 miles away; NEW CASTLE, DE)
MEADOWWOOD BEHAVIORAL HEALTH SYSTEM (Hospital, about 6 miles away; NEW CASTLE, DE)
FRESENIUS MEDICAL CARE FOX RUN (Dialysis Facility, about 7 miles away; BEAR, DE)
HEARTLAND HOME HEALTH CARE AND HOSPICE (Home Health Center, about 8 miles away; NEWARK, DE)
INTERIM HEALTHCARE (Home Health Center, about 8 miles away; NEW CASTLE, DE)
VITAS HEALTHCARE CORPORATION ATLANTIC (Hospital, about 9 miles away; NEWARK, DE)
JEANNE JUGAN RESIDENCE (Nursing Home, about 9 miles away; NEWARK, DE)
Amtrak stations near Delaware City:
11 miles: NEWARK (429 S. COLLEGE AVE.) . Services: public payphones, free short-term parking, call for car rental service, call for taxi service, public transit connection.
12 miles: WILMINGTON (M. L. KING BLVD, & FRENCH ST.) . Services: ticket office, partially wheelchair accessible, enclosed waiting area, public restrooms, public payphones, snack bar, ATM, paid short-term parking, paid long-term parking, car rental agency, taxi stand, intercity bus service, public transit connection.
Operable nuclear power plants near Delaware City:
7 miles: Salem 2 in Salem, NJ.
7 miles: Hope Creek in Salem, NJ.
7 miles: Salem 1 in Salem, NJ.
Colleges/universities with over 2000 students nearest to Delaware City:
Wilmington University (about 8 miles; New Castle, DE; Full-time enrollment: 10,072)
University of Delaware (about 12 miles; Newark, DE; FT enrollment: 20,078)
Delaware Technical Community College-Stanton/Wilmington (about 12 miles; Wilmington, DE; FT enrollment: 4,972)
Neumann University (about 23 miles; Aston, PA; FT enrollment: 2,622)
Lincoln University of Pennsylvania (about 25 miles; Lincoln University, PA; FT enrollment: 2,042)
West Chester University of Pennsylvania (about 26 miles; West Chester, PA; FT enrollment: 14,492)
Library in Delaware City:
DELAWARE CITY PUBLIC LIBRARY (Operating income: $252,093; Location: 250 FIFTH STREET; 23,844 books; 1,101 audio materials; 1,976 video materials; 33 state licensed databases; 5 other licensed databases; 72 print serial subscriptions; 1 electronic serial subscriptions)
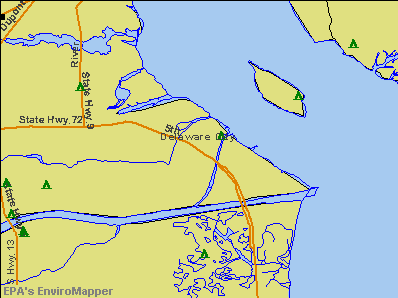
Notable locations in Delaware City: Delaware City Town Hall (A), Delaware City Police Department (B), Delaware City Library (C), Delaware City Fire Company (D). Display/hide their locations on the map
Churches in Delaware City include: Ebenezer United Methodist Church (A), Mount Salem Union American Methodist Episcopal Church (B), Mount Salem United African Methodist Episcopal Church (C), Saint Pauls Catholic Church (D), Christ Church (E), Delaware City Presbyterian Church (F). Display/hide their locations on the map
Birthplace of: Eugene Reybold - General, John E. Rickards - Politician.
New Castle County has a predicted average indoor radon screening level between 2 and 4 pCi/L (pico curies per liter) - Moderate Potential
Drinking water stations with addresses in Delaware City and their reported violations in the past:
FORT DELAWARE STATE PARK (Population served: 700, Groundwater):
Past health violations:
MCL, Monthly (TCR) - Between JUL-2012 and SEP-2012, Contaminant: Coliform. Follow-up actions: St Public Notif requested (AUG-02-2012), St Formal NOV issued (AUG-02-2012), St Public Notif received (AUG-16-2012)
MCL, Monthly (TCR) - Between APR-2012 and JUN-2012, Contaminant: Coliform. Follow-up actions: St Public Notif requested (JUN-19-2012), St Formal NOV issued (JUN-19-2012), St Public Notif received (JUN-27-2012)
GOVERNOR BACON HEALTH CENTER (Address: Route 9 - Engineer Road , Population served: 525, Groundwater):
Past health violations:
MCL, Monthly (TCR) - In OCT-2005, Contaminant: Coliform. Follow-up actions: St Formal NOV issued (OCT-25-2005), St Public Notif issued (OCT-25-2005), St Compliance achieved (MAR-01-2006)
Past monitoring violations:
Follow-up Or Routine LCR Tap M/R - In OCT-01-2009, Contaminant: Lead and Copper Rule. Follow-up actions: St Public Notif requested (DEC-03-2009), St Formal NOV issued (DEC-03-2009), St Intentional no-action (DEC-07-2009), St Variance/Exemption issued (DEC-07-2009)
Water Quality Parameter M/R - Between JUL-2006 and DEC-2006, Contaminant: Lead and Copper Rule. Follow-up actions: St Public Notif issued (JAN-10-2007), St Compliance achieved (MAR-21-2007)
Water Quality Parameter M/R - Between JAN-2006 and JUN-2006, Contaminant: Lead and Copper Rule. Follow-up actions: St Public Notif issued (AUG-02-2006), St Compliance achieved (MAR-21-2007)
Water Quality Parameter M/R - Between JUL-2005 and DEC-2005, Contaminant: Lead and Copper Rule. Follow-up actions: St Public Notif issued (JAN-10-2006), St Compliance achieved (MAR-21-2007)
Water Quality Parameter M/R - Between JAN-2005 and JUN-2005, Contaminant: Lead and Copper Rule. Follow-up actions: St Public Notif issued (JUL-18-2005), St Compliance achieved (MAR-21-2007)
Drinking water stations with addresses in Delaware City that have no violations reported:
DELAWARE CITY WATER DEPARTMENT (Population served: 2,220,Primary Water Source Type: Groundwater)
CRABBY DICKS (Population served: 200,Primary Water Source Type: Groundwater)
Average household size:
This city:
2.6 people
Delaware:
2.5 people
Percentage of family households:
This city:
70.6%
Whole state:
67.4%
Percentage of households with unmarried partners:
This city:
7.7%
Whole state:
7.3%
Likely homosexual households (counted as self-reported same-sex unmarried-partner households)
Lesbian couples: 0.5% of all households
Gay men: 0.5% of all households
8 people in homes or halfway houses for drug/alcohol abuse in 2000
Banks with branches in Delaware City (2011 data):
Wilmington Savings Fund Society, FSB: Delaware City Bank Branch at 145 Clinton Street, branch established on 1888/01/01. Info updated 2011/07/21: Bank assets: $4,281.1 mil, Deposits: $3,150.2 mil, headquarters in Wilmington, DE, positive income, Commercial Lending Specialization, 43 total offices
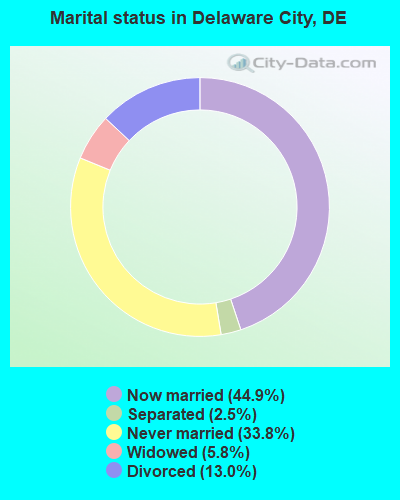
For population 15 years and over in Delaware City:
Never married: 33.8%
Now married: 44.9%
Separated: 2.5%
Widowed: 5.8%
Divorced: 13.0%
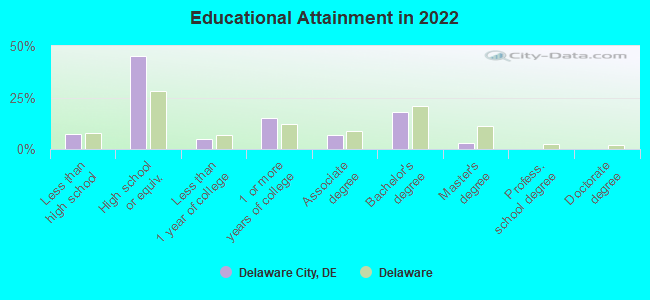
For population 25 years and over in Delaware City:
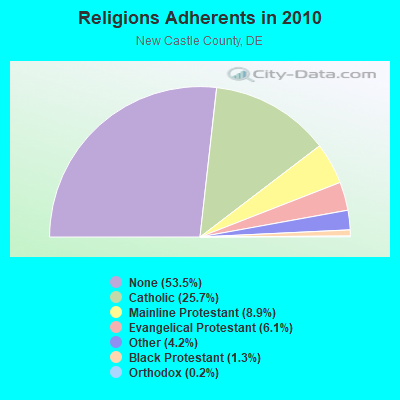
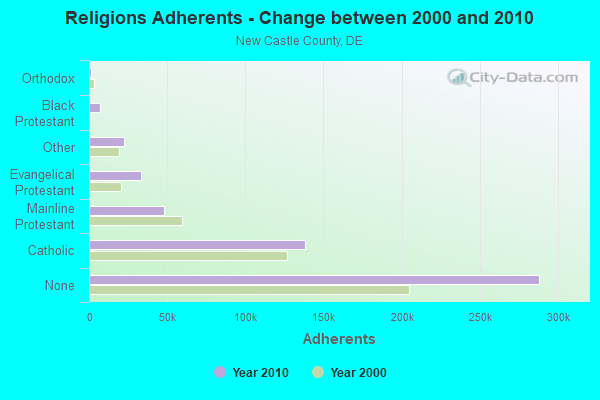
Religion statistics for Delaware City, DE (based on New Castle County data)
Religion
Adherents
Congregations
Catholic
138,172
33
Mainline Protestant
48,124
125
Evangelical Protestant
32,993
169
Other
22,672
45
Black Protestant
7,212
36
Orthodox
1,166
5
None
288,140
-
Source: Clifford Grammich, Kirk Hadaway, Richard Houseal, Dale E.Jones, Alexei Krindatch, Richie Stanley and Richard H.Taylor. 2012. 2010 U.S.Religion Census: Religious Congregations & Membership Study. Association of Statisticians of American Religious Bodies. Jones, Dale E., et al. 2002. Congregations and Membership in the United States 2000. Nashville, TN: Glenmary Research Center. Graphs represent county-level data
8,011Total future (year 2037) average daily traffic
FCC Registered Amateur Radio Licenses:
5
Call Sign: N3OGZ, Licensee ID: L00596459, Grant Date: 02/14/2024, Expiration Date: 02/14/2034, Certifier: John F Hughto, Registrant: John F Hughto, 110 Clark Cir, Delaware City, DE 19706
Call Sign: KB3LLJ, Licensee ID: L00910700, Grant Date: 08/26/2004, Expiration Date: 08/26/2014, Cancellation Date: 08/27/2016, Certifier: Daryl C Phipps, Registrant: Daryl C Phipps, Delaware City, DE 19706
Call Sign: KD8PMP, Licensee ID: L01236560, Grant Date: 12/15/2020, Expiration Date: 02/14/2031, Certifier: David A Turley, Registrant: David Turley, 201 Clinton Street, Delaware City, DE 19706
Call Sign: KC3BAC, Licensee ID: L01803123, Grant Date: 07/23/2013, Expiration Date: 07/23/2023, Certifier: David S Beck, Registrant: David S Beck, Delaware City, DE 19706
Call Sign: K1YHF, Previous Call Sign: KC1CZK, Licensee ID: L01911572, Grant Date: 12/11/2018, Expiration Date: 12/11/2028, Cancellation Date: 10/08/2019, Certifier: Henry Mcgovern, Registrant: Henry Mcgovern, 1308a Officers Row, Delaware City, DE 19706
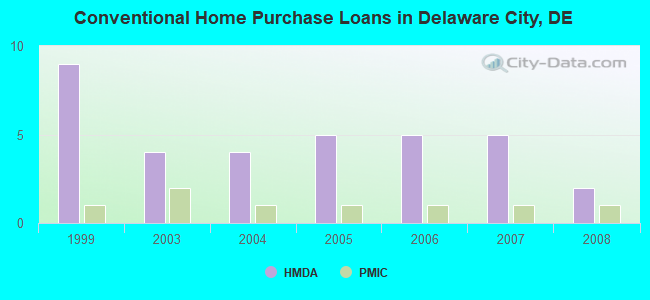
Home Mortgage Disclosure Act Aggregated Statistics For Year 2009 (Based on 1 partial tract)
A) FHA, FSA/RHS & VA Home Purchase Loans
C) Refinancings
D) Home Improvement Loans
Number
Average Value
Number
Average Value
Number
Average Value
LOANS ORIGINATED
1
$157,170
7
$204,307
0
$0
APPLICATIONS APPROVED, NOT ACCEPTED
0
$0
1
$128,690
0
$0
APPLICATIONS DENIED
0
$0
4
$166,462
1
$18,580
APPLICATIONS WITHDRAWN
0
$0
2
$133,955
0
$0
FILES CLOSED FOR INCOMPLETENESS
0
$0
0
$0
0
$0
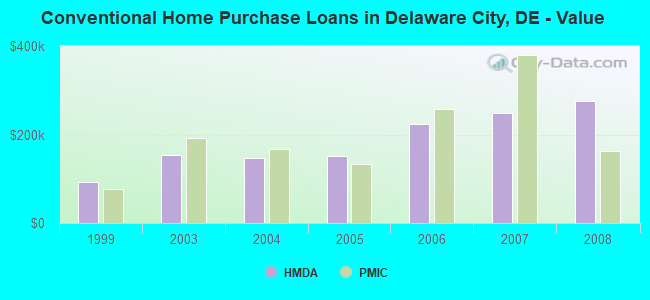
Aggregated Statistics For Year 2008 (Based on 1 partial tract)
B) Conventional Home Purchase Loans
C) Refinancings
D) Home Improvement Loans
Number
Average Value
Number
Average Value
Number
Average Value
LOANS ORIGINATED
2
$275,390
4
$201,370
1
$51,910
APPLICATIONS APPROVED, NOT ACCEPTED
0
$0
2
$160,375
0
$0
APPLICATIONS DENIED
1
$148,300
5
$220,126
2
$103,920
APPLICATIONS WITHDRAWN
0
$0
2
$205,935
1
$108,460
FILES CLOSED FOR INCOMPLETENESS
0
$0
1
$120,950
0
$0
Aggregated Statistics For Year 2007 (Based on 1 partial tract)
B) Conventional Home Purchase Loans
C) Refinancings
D) Home Improvement Loans
F) Non-occupant Loans on < 5 Family Dwellings (A B C & D)
Number
Average Value
Number
Average Value
Number
Average Value
Number
Average Value
LOANS ORIGINATED
5
$247,494
7
$182,221
2
$65,015
1
$149,950
APPLICATIONS APPROVED, NOT ACCEPTED
1
$78,230
2
$153,355
1
$37,460
0
$0
APPLICATIONS DENIED
2
$174,565
4
$194,092
1
$40,450
0
$0
APPLICATIONS WITHDRAWN
1
$117,850
1
$254,390
0
$0
0
$0
FILES CLOSED FOR INCOMPLETENESS
1
$118,370
0
$0
0
$0
0
$0
Aggregated Statistics For Year 2006 (Based on 1 partial tract)
B) Conventional Home Purchase Loans
C) Refinancings
D) Home Improvement Loans
F) Non-occupant Loans on < 5 Family Dwellings (A B C & D)
Number
Average Value
Number
Average Value
Number
Average Value
Number
Average Value
LOANS ORIGINATED
5
$222,684
8
$178,639
3
$50,670
1
$75,230
APPLICATIONS APPROVED, NOT ACCEPTED
1
$94,020
2
$127,040
1
$28,790
0
$0
APPLICATIONS DENIED
1
$283,080
5
$189,206
2
$99,590
0
$0
APPLICATIONS WITHDRAWN
1
$129,720
3
$175,233
0
$0
0
$0
FILES CLOSED FOR INCOMPLETENESS
0
$0
2
$124,820
0
$0
0
$0
Aggregated Statistics For Year 2005 (Based on 1 partial tract)
A) FHA, FSA/RHS & VA Home Purchase Loans
B) Conventional Home Purchase Loans
C) Refinancings
D) Home Improvement Loans
F) Non-occupant Loans on < 5 Family Dwellings (A B C & D)
Number
Average Value
Number
Average Value
Number
Average Value
Number
Average Value
Number
Average Value
LOANS ORIGINATED
1
$75,750
5
$150,342
8
$157,186
3
$47,817
1
$155,630
APPLICATIONS APPROVED, NOT ACCEPTED
0
$0
0
$0
2
$98,660
0
$0
0
$0
APPLICATIONS DENIED
0
$0
1
$150,570
6
$147,920
2
$75,335
1
$46,230
APPLICATIONS WITHDRAWN
0
$0
1
$96,700
2
$181,375
1
$120,540
0
$0
FILES CLOSED FOR INCOMPLETENESS
0
$0
0
$0
1
$241,690
0
$0
0
$0
Aggregated Statistics For Year 2004 (Based on 1 partial tract)
A) FHA, FSA/RHS & VA Home Purchase Loans
B) Conventional Home Purchase Loans
C) Refinancings
D) Home Improvement Loans
F) Non-occupant Loans on < 5 Family Dwellings (A B C & D)
Number
Average Value
Number
Average Value
Number
Average Value
Number
Average Value
Number
Average Value
LOANS ORIGINATED
1
$129,210
4
$147,318
9
$141,029
2
$90,505
1
$94,320
APPLICATIONS APPROVED, NOT ACCEPTED
0
$0
0
$0
2
$131,890
1
$46,440
0
$0
APPLICATIONS DENIED
0
$0
1
$128,900
4
$133,800
1
$50,770
1
$33,850
APPLICATIONS WITHDRAWN
0
$0
0
$0
3
$143,277
1
$21,780
0
$0
FILES CLOSED FOR INCOMPLETENESS
0
$0
0
$0
2
$179,515
0
$0
0
$0
Aggregated Statistics For Year 2003 (Based on 1 partial tract)
B) Conventional Home Purchase Loans
C) Refinancings
D) Home Improvement Loans
F) Non-occupant Loans on < 5 Family Dwellings (A B C & D)
Number
Average Value
Number
Average Value
Number
Average Value
Number
Average Value
LOANS ORIGINATED
4
$153,072
13
$134,715
2
$22,550
1
$88,960
APPLICATIONS APPROVED, NOT ACCEPTED
1
$65,020
3
$98,007
1
$28,590
0
$0
APPLICATIONS DENIED
0
$0
6
$115,997
1
$4,330
0
$0
APPLICATIONS WITHDRAWN
0
$0
2
$150,570
0
$0
0
$0
FILES CLOSED FOR INCOMPLETENESS
0
$0
1
$47,370
0
$0
0
$0
Aggregated Statistics For Year 1999 (Based on 1 partial tract)
A) FHA, FSA/RHS & VA Home Purchase Loans
B) Conventional Home Purchase Loans
C) Refinancings
D) Home Improvement Loans
F) Non-occupant Loans on < 5 Family Dwellings (A B C & D)
Detailed PMIC statistics for the following Tracts:0164.02
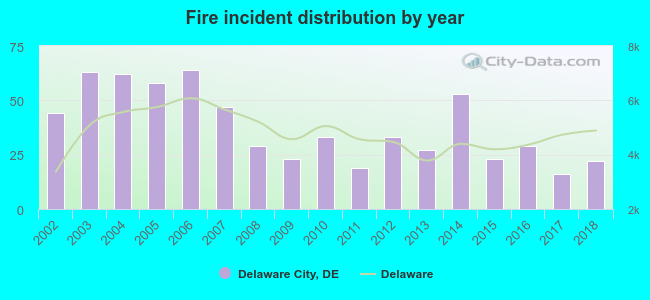
2002 - 2018 National Fire Incident Reporting System (NFIRS) incidents
According to the data from the years 2002 - 2018 the average number of fires per year is 38. The highest number of fires - 64 took place in 2006, and the least - 16 in 2017. The data has a decreasing trend.
When looking into fire subcategories, the most reports belonged to: Structure Fires (52.1%), and Outside Fires (21.2%).
Fire incident types reported to NFIRS in Delaware City, DE


 Recent articles from our blog. Our writers, many of them Ph.D. graduates or candidates, create easy-to-read articles on a wide variety of topics.

 , pop. 67,114).

 According to the data from the years 2002 - 2018 the average number of fires per year is 38. The highest number of fires - 64 took place in 2006, and the least - 16 in 2017. The data has a decreasing trend.
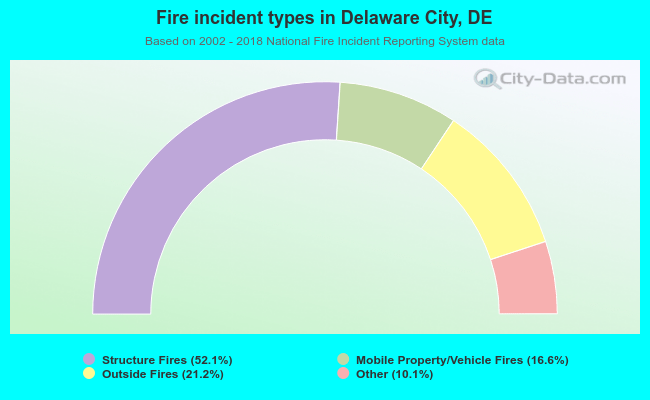 When looking into fire subcategories, the most reports belonged to: Structure Fires (52.1%), and Outside Fires (21.2%).