Clifton Heights, Pennsylvania Submit your own pictures of this borough and show them to the world
OSM Map
General Map
Google Map
MSN Map
OSM Map
General Map
Google Map
MSN Map
OSM Map
General Map
Google Map
MSN Map
OSM Map
General Map
Google Map
MSN Map
Please wait while loading the map...
Population in 2022: 6,794 (100% urban, 0% rural). Population change since 2000: +0.2%Males: 3,048 Females: 3,746
March 2022 cost of living index in Clifton Heights: 102.6 (near average, U.S. average is 100) Percentage of residents living in poverty in 2022: 16.7%for White Non-Hispanic residents , 28.3% for Black residents , 8.0% for two or more races residents )
Profiles of local businesses
Business Search - 14 Million verified businesses
Data:
Median household income ($)
Median household income (% change since 2000)
Household income diversity
Ratio of average income to average house value (%)
Ratio of average income to average rent
Median household income ($) - White
Median household income ($) - Black or African American
Median household income ($) - Asian
Median household income ($) - Hispanic or Latino
Median household income ($) - American Indian and Alaska Native
Median household income ($) - Multirace
Median household income ($) - Other Race
Median household income for houses/condos with a mortgage ($)
Median household income for apartments without a mortgage ($)
Races - White alone (%)
Races - White alone (% change since 2000)
Races - Black alone (%)
Races - Black alone (% change since 2000)
Races - American Indian alone (%)
Races - American Indian alone (% change since 2000)
Races - Asian alone (%)
Races - Asian alone (% change since 2000)
Races - Hispanic (%)
Races - Hispanic (% change since 2000)
Races - Native Hawaiian and Other Pacific Islander alone (%)
Races - Native Hawaiian and Other Pacific Islander alone (% change since 2000)
Races - Two or more races (%)
Races - Two or more races (% change since 2000)
Races - Other race alone (%)
Races - Other race alone (% change since 2000)
Racial diversity
Unemployment (%)
Unemployment (% change since 2000)
Unemployment (%) - White
Unemployment (%) - Black or African American
Unemployment (%) - Asian
Unemployment (%) - Hispanic or Latino
Unemployment (%) - American Indian and Alaska Native
Unemployment (%) - Multirace
Unemployment (%) - Other Race
Population density (people per square mile)
Population - Males (%)
Population - Females (%)
Population - Males (%) - White
Population - Males (%) - Black or African American
Population - Males (%) - Asian
Population - Males (%) - Hispanic or Latino
Population - Males (%) - American Indian and Alaska Native
Population - Males (%) - Multirace
Population - Males (%) - Other Race
Population - Females (%) - White
Population - Females (%) - Black or African American
Population - Females (%) - Asian
Population - Females (%) - Hispanic or Latino
Population - Females (%) - American Indian and Alaska Native
Population - Females (%) - Multirace
Population - Females (%) - Other Race
Coronavirus confirmed cases (May 25, 2024)
Deaths caused by coronavirus (May 25, 2024)
Coronavirus confirmed cases (per 100k population) (May 25, 2024)
Deaths caused by coronavirus (per 100k population) (May 25, 2024)
Daily increase in number of cases (May 25, 2024)
Weekly increase in number of cases (May 25, 2024)
Cases doubled (in days) (May 25, 2024)
Hospitalized patients (Apr 18, 2022)
Negative test results (Apr 18, 2022)
Total test results (Apr 18, 2022)
COVID Vaccine doses distributed (per 100k population) (Sep 19, 2023)
COVID Vaccine doses administered (per 100k population) (Sep 19, 2023)
COVID Vaccine doses distributed (Sep 19, 2023)
COVID Vaccine doses administered (Sep 19, 2023)
Likely homosexual households (%)
Likely homosexual households (% change since 2000)
Likely homosexual households - Lesbian couples (%)
Likely homosexual households - Lesbian couples (% change since 2000)
Likely homosexual households - Gay men (%)
Likely homosexual households - Gay men (% change since 2000)
Cost of living index
Median gross rent ($)
Median contract rent ($)
Median monthly housing costs ($)
Median house or condo value ($)
Median house or condo value ($ change since 2000)
Mean house or condo value by units in structure - 1, detached ($)
Mean house or condo value by units in structure - 1, attached ($)
Mean house or condo value by units in structure - 2 ($)
Mean house or condo value by units in structure by units in structure - 3 or 4 ($)
Mean house or condo value by units in structure - 5 or more ($)
Mean house or condo value by units in structure - Boat, RV, van, etc. ($)
Mean house or condo value by units in structure - Mobile home ($)
Median house or condo value ($) - White
Median house or condo value ($) - Black or African American
Median house or condo value ($) - Asian
Median house or condo value ($) - Hispanic or Latino
Median house or condo value ($) - American Indian and Alaska Native
Median house or condo value ($) - Multirace
Median house or condo value ($) - Other Race
Median resident age
Resident age diversity
Median resident age - Males
Median resident age - Females
Median resident age - White
Median resident age - Black or African American
Median resident age - Asian
Median resident age - Hispanic or Latino
Median resident age - American Indian and Alaska Native
Median resident age - Multirace
Median resident age - Other Race
Median resident age - Males - White
Median resident age - Males - Black or African American
Median resident age - Males - Asian
Median resident age - Males - Hispanic or Latino
Median resident age - Males - American Indian and Alaska Native
Median resident age - Males - Multirace
Median resident age - Males - Other Race
Median resident age - Females - White
Median resident age - Females - Black or African American
Median resident age - Females - Asian
Median resident age - Females - Hispanic or Latino
Median resident age - Females - American Indian and Alaska Native
Median resident age - Females - Multirace
Median resident age - Females - Other Race
Commute - mean travel time to work (minutes)
Travel time to work - Less than 5 minutes (%)
Travel time to work - Less than 5 minutes (% change since 2000)
Travel time to work - 5 to 9 minutes (%)
Travel time to work - 5 to 9 minutes (% change since 2000)
Travel time to work - 10 to 19 minutes (%)
Travel time to work - 10 to 19 minutes (% change since 2000)
Travel time to work - 20 to 29 minutes (%)
Travel time to work - 20 to 29 minutes (% change since 2000)
Travel time to work - 30 to 39 minutes (%)
Travel time to work - 30 to 39 minutes (% change since 2000)
Travel time to work - 40 to 59 minutes (%)
Travel time to work - 40 to 59 minutes (% change since 2000)
Travel time to work - 60 to 89 minutes (%)
Travel time to work - 60 to 89 minutes (% change since 2000)
Travel time to work - 90 or more minutes (%)
Travel time to work - 90 or more minutes (% change since 2000)
Marital status - Never married (%)
Marital status - Now married (%)
Marital status - Separated (%)
Marital status - Widowed (%)
Marital status - Divorced (%)
Median family income ($)
Median family income (% change since 2000)
Median non-family income ($)
Median non-family income (% change since 2000)
Median per capita income ($)
Median per capita income (% change since 2000)
Median family income ($) - White
Median family income ($) - Black or African American
Median family income ($) - Asian
Median family income ($) - Hispanic or Latino
Median family income ($) - American Indian and Alaska Native
Median family income ($) - Multirace
Median family income ($) - Other Race
Median year house/condo built
Median year apartment built
Year house built - Built 2005 or later (%)
Year house built - Built 2000 to 2004 (%)
Year house built - Built 1990 to 1999 (%)
Year house built - Built 1980 to 1989 (%)
Year house built - Built 1970 to 1979 (%)
Year house built - Built 1960 to 1969 (%)
Year house built - Built 1950 to 1959 (%)
Year house built - Built 1940 to 1949 (%)
Year house built - Built 1939 or earlier (%)
Average household size
Household density (households per square mile)
Average household size - White
Average household size - Black or African American
Average household size - Asian
Average household size - Hispanic or Latino
Average household size - American Indian and Alaska Native
Average household size - Multirace
Average household size - Other Race
Occupied housing units (%)
Vacant housing units (%)
Owner occupied housing units (%)
Renter occupied housing units (%)
Vacancy status - For rent (%)
Vacancy status - For sale only (%)
Vacancy status - Rented or sold, not occupied (%)
Vacancy status - For seasonal, recreational, or occasional use (%)
Vacancy status - For migrant workers (%)
Vacancy status - Other vacant (%)
Residents with income below the poverty level (%)
Residents with income below 50% of the poverty level (%)
Children below poverty level (%)
Poor families by family type - Married-couple family (%)
Poor families by family type - Male, no wife present (%)
Poor families by family type - Female, no husband present (%)
Poverty status for native-born residents (%)
Poverty status for foreign-born residents (%)
Poverty among high school graduates not in families (%)
Poverty among people who did not graduate high school not in families (%)
Residents with income below the poverty level (%) - White
Residents with income below the poverty level (%) - Black or African American
Residents with income below the poverty level (%) - Asian
Residents with income below the poverty level (%) - Hispanic or Latino
Residents with income below the poverty level (%) - American Indian and Alaska Native
Residents with income below the poverty level (%) - Multirace
Residents with income below the poverty level (%) - Other Race
Air pollution - Air Quality Index (AQI)
Air pollution - CO
Air pollution - NO2
Air pollution - SO2
Air pollution - Ozone
Air pollution - PM10
Air pollution - PM25
Air pollution - Pb
Crime - Murders per 100,000 population
Crime - Rapes per 100,000 population
Crime - Robberies per 100,000 population
Crime - Assaults per 100,000 population
Crime - Burglaries per 100,000 population
Crime - Thefts per 100,000 population
Crime - Auto thefts per 100,000 population
Crime - Arson per 100,000 population
Crime - City-data.com crime index
Crime - Violent crime index
Crime - Property crime index
Crime - Murders per 100,000 population (5 year average)
Crime - Rapes per 100,000 population (5 year average)
Crime - Robberies per 100,000 population (5 year average)
Crime - Assaults per 100,000 population (5 year average)
Crime - Burglaries per 100,000 population (5 year average)
Crime - Thefts per 100,000 population (5 year average)
Crime - Auto thefts per 100,000 population (5 year average)
Crime - Arson per 100,000 population (5 year average)
Crime - City-data.com crime index (5 year average)
Crime - Violent crime index (5 year average)
Crime - Property crime index (5 year average)
1996 Presidential Elections Results (%) - Democratic Party (Clinton)
1996 Presidential Elections Results (%) - Republican Party (Dole)
1996 Presidential Elections Results (%) - Other
2000 Presidential Elections Results (%) - Democratic Party (Gore)
2000 Presidential Elections Results (%) - Republican Party (Bush)
2000 Presidential Elections Results (%) - Other
2004 Presidential Elections Results (%) - Democratic Party (Kerry)
2004 Presidential Elections Results (%) - Republican Party (Bush)
2004 Presidential Elections Results (%) - Other
2008 Presidential Elections Results (%) - Democratic Party (Obama)
2008 Presidential Elections Results (%) - Republican Party (McCain)
2008 Presidential Elections Results (%) - Other
2012 Presidential Elections Results (%) - Democratic Party (Obama)
2012 Presidential Elections Results (%) - Republican Party (Romney)
2012 Presidential Elections Results (%) - Other
2016 Presidential Elections Results (%) - Democratic Party (Clinton)
2016 Presidential Elections Results (%) - Republican Party (Trump)
2016 Presidential Elections Results (%) - Other
2020 Presidential Elections Results (%) - Democratic Party (Biden)
2020 Presidential Elections Results (%) - Republican Party (Trump)
2020 Presidential Elections Results (%) - Other
Ancestries Reported - Arab (%)
Ancestries Reported - Czech (%)
Ancestries Reported - Danish (%)
Ancestries Reported - Dutch (%)
Ancestries Reported - English (%)
Ancestries Reported - French (%)
Ancestries Reported - French Canadian (%)
Ancestries Reported - German (%)
Ancestries Reported - Greek (%)
Ancestries Reported - Hungarian (%)
Ancestries Reported - Irish (%)
Ancestries Reported - Italian (%)
Ancestries Reported - Lithuanian (%)
Ancestries Reported - Norwegian (%)
Ancestries Reported - Polish (%)
Ancestries Reported - Portuguese (%)
Ancestries Reported - Russian (%)
Ancestries Reported - Scotch-Irish (%)
Ancestries Reported - Scottish (%)
Ancestries Reported - Slovak (%)
Ancestries Reported - Subsaharan African (%)
Ancestries Reported - Swedish (%)
Ancestries Reported - Swiss (%)
Ancestries Reported - Ukrainian (%)
Ancestries Reported - United States (%)
Ancestries Reported - Welsh (%)
Ancestries Reported - West Indian (%)
Ancestries Reported - Other (%)
Educational Attainment - No schooling completed (%)
Educational Attainment - Less than high school (%)
Educational Attainment - High school or equivalent (%)
Educational Attainment - Less than 1 year of college (%)
Educational Attainment - 1 or more years of college (%)
Educational Attainment - Associate degree (%)
Educational Attainment - Bachelor's degree (%)
Educational Attainment - Master's degree (%)
Educational Attainment - Professional school degree (%)
Educational Attainment - Doctorate degree (%)
School Enrollment - Nursery, preschool (%)
School Enrollment - Kindergarten (%)
School Enrollment - Grade 1 to 4 (%)
School Enrollment - Grade 5 to 8 (%)
School Enrollment - Grade 9 to 12 (%)
School Enrollment - College undergrad (%)
School Enrollment - Graduate or professional (%)
School Enrollment - Not enrolled in school (%)
School enrollment - Public schools (%)
School enrollment - Private schools (%)
School enrollment - Not enrolled (%)
Median number of rooms in houses and condos
Median number of rooms in apartments
Housing units lacking complete plumbing facilities (%)
Housing units lacking complete kitchen facilities (%)
Density of houses
Urban houses (%)
Rural houses (%)
Households with people 60 years and over (%)
Households with people 65 years and over (%)
Households with people 75 years and over (%)
Households with one or more nonrelatives (%)
Households with no nonrelatives (%)
Population in households (%)
Family households (%)
Nonfamily households (%)
Population in families (%)
Family households with own children (%)
Median number of bedrooms in owner occupied houses
Mean number of bedrooms in owner occupied houses
Median number of bedrooms in renter occupied houses
Mean number of bedrooms in renter occupied houses
Median number of vehichles in owner occupied houses
Mean number of vehichles in owner occupied houses
Median number of vehichles in renter occupied houses
Mean number of vehichles in renter occupied houses
Mortgage status - with mortgage (%)
Mortgage status - with second mortgage (%)
Mortgage status - with home equity loan (%)
Mortgage status - with both second mortgage and home equity loan (%)
Mortgage status - without a mortgage (%)
Average family size
Average family size - White
Average family size - Black or African American
Average family size - Asian
Average family size - Hispanic or Latino
Average family size - American Indian and Alaska Native
Average family size - Multirace
Average family size - Other Race
Geographical mobility - Same house 1 year ago (%)
Geographical mobility - Moved within same county (%)
Geographical mobility - Moved from different county within same state (%)
Geographical mobility - Moved from different state (%)
Geographical mobility - Moved from abroad (%)
Place of birth - Born in state of residence (%)
Place of birth - Born in other state (%)
Place of birth - Native, outside of US (%)
Place of birth - Foreign born (%)
Housing units in structures - 1, detached (%)
Housing units in structures - 1, attached (%)
Housing units in structures - 2 (%)
Housing units in structures - 3 or 4 (%)
Housing units in structures - 5 to 9 (%)
Housing units in structures - 10 to 19 (%)
Housing units in structures - 20 to 49 (%)
Housing units in structures - 50 or more (%)
Housing units in structures - Mobile home (%)
Housing units in structures - Boat, RV, van, etc. (%)
House/condo owner moved in on average (years ago)
Renter moved in on average (years ago)
Year householder moved into unit - Moved in 1999 to March 2000 (%)
Year householder moved into unit - Moved in 1995 to 1998 (%)
Year householder moved into unit - Moved in 1990 to 1994 (%)
Year householder moved into unit - Moved in 1980 to 1989 (%)
Year householder moved into unit - Moved in 1970 to 1979 (%)
Year householder moved into unit - Moved in 1969 or earlier (%)
Means of transportation to work - Drove car alone (%)
Means of transportation to work - Carpooled (%)
Means of transportation to work - Public transportation (%)
Means of transportation to work - Bus or trolley bus (%)
Means of transportation to work - Streetcar or trolley car (%)
Means of transportation to work - Subway or elevated (%)
Means of transportation to work - Railroad (%)
Means of transportation to work - Ferryboat (%)
Means of transportation to work - Taxicab (%)
Means of transportation to work - Motorcycle (%)
Means of transportation to work - Bicycle (%)
Means of transportation to work - Walked (%)
Means of transportation to work - Other means (%)
Working at home (%)
Industry diversity
Most Common Industries - Agriculture, forestry, fishing and hunting, and mining (%)
Most Common Industries - Agriculture, forestry, fishing and hunting (%)
Most Common Industries - Mining, quarrying, and oil and gas extraction (%)
Most Common Industries - Construction (%)
Most Common Industries - Manufacturing (%)
Most Common Industries - Wholesale trade (%)
Most Common Industries - Retail trade (%)
Most Common Industries - Transportation and warehousing, and utilities (%)
Most Common Industries - Transportation and warehousing (%)
Most Common Industries - Utilities (%)
Most Common Industries - Information (%)
Most Common Industries - Finance and insurance, and real estate and rental and leasing (%)
Most Common Industries - Finance and insurance (%)
Most Common Industries - Real estate and rental and leasing (%)
Most Common Industries - Professional, scientific, and management, and administrative and waste management services (%)
Most Common Industries - Professional, scientific, and technical services (%)
Most Common Industries - Management of companies and enterprises (%)
Most Common Industries - Administrative and support and waste management services (%)
Most Common Industries - Educational services, and health care and social assistance (%)
Most Common Industries - Educational services (%)
Most Common Industries - Health care and social assistance (%)
Most Common Industries - Arts, entertainment, and recreation, and accommodation and food services (%)
Most Common Industries - Arts, entertainment, and recreation (%)
Most Common Industries - Accommodation and food services (%)
Most Common Industries - Other services, except public administration (%)
Most Common Industries - Public administration (%)
Occupation diversity
Most Common Occupations - Management, business, science, and arts occupations (%)
Most Common Occupations - Management, business, and financial occupations (%)
Most Common Occupations - Management occupations (%)
Most Common Occupations - Business and financial operations occupations (%)
Most Common Occupations - Computer, engineering, and science occupations (%)
Most Common Occupations - Computer and mathematical occupations (%)
Most Common Occupations - Architecture and engineering occupations (%)
Most Common Occupations - Life, physical, and social science occupations (%)
Most Common Occupations - Education, legal, community service, arts, and media occupations (%)
Most Common Occupations - Community and social service occupations (%)
Most Common Occupations - Legal occupations (%)
Most Common Occupations - Education, training, and library occupations (%)
Most Common Occupations - Arts, design, entertainment, sports, and media occupations (%)
Most Common Occupations - Healthcare practitioners and technical occupations (%)
Most Common Occupations - Health diagnosing and treating practitioners and other technical occupations (%)
Most Common Occupations - Health technologists and technicians (%)
Most Common Occupations - Service occupations (%)
Most Common Occupations - Healthcare support occupations (%)
Most Common Occupations - Protective service occupations (%)
Most Common Occupations - Fire fighting and prevention, and other protective service workers including supervisors (%)
Most Common Occupations - Law enforcement workers including supervisors (%)
Most Common Occupations - Food preparation and serving related occupations (%)
Most Common Occupations - Building and grounds cleaning and maintenance occupations (%)
Most Common Occupations - Personal care and service occupations (%)
Most Common Occupations - Sales and office occupations (%)
Most Common Occupations - Sales and related occupations (%)
Most Common Occupations - Office and administrative support occupations (%)
Most Common Occupations - Natural resources, construction, and maintenance occupations (%)
Most Common Occupations - Farming, fishing, and forestry occupations (%)
Most Common Occupations - Construction and extraction occupations (%)
Most Common Occupations - Installation, maintenance, and repair occupations (%)
Most Common Occupations - Production, transportation, and material moving occupations (%)
Most Common Occupations - Production occupations (%)
Most Common Occupations - Transportation occupations (%)
Most Common Occupations - Material moving occupations (%)
People in Group quarters - Institutionalized population (%)
People in Group quarters - Correctional institutions (%)
People in Group quarters - Federal prisons and detention centers (%)
People in Group quarters - Halfway houses (%)
People in Group quarters - Local jails and other confinement facilities (including police lockups) (%)
People in Group quarters - Military disciplinary barracks (%)
People in Group quarters - State prisons (%)
People in Group quarters - Other types of correctional institutions (%)
People in Group quarters - Nursing homes (%)
People in Group quarters - Hospitals/wards, hospices, and schools for the handicapped (%)
People in Group quarters - Hospitals/wards and hospices for chronically ill (%)
People in Group quarters - Hospices or homes for chronically ill (%)
People in Group quarters - Military hospitals or wards for chronically ill (%)
People in Group quarters - Other hospitals or wards for chronically ill (%)
People in Group quarters - Hospitals or wards for drug/alcohol abuse (%)
People in Group quarters - Mental (Psychiatric) hospitals or wards (%)
People in Group quarters - Schools, hospitals, or wards for the mentally retarded (%)
People in Group quarters - Schools, hospitals, or wards for the physically handicapped (%)
People in Group quarters - Institutions for the deaf (%)
People in Group quarters - Institutions for the blind (%)
People in Group quarters - Orthopedic wards and institutions for the physically handicapped (%)
People in Group quarters - Wards in general hospitals for patients who have no usual home elsewhere (%)
People in Group quarters - Wards in military hospitals for patients who have no usual home elsewhere (%)
People in Group quarters - Juvenile institutions (%)
People in Group quarters - Long-term care (%)
People in Group quarters - Homes for abused, dependent, and neglected children (%)
People in Group quarters - Residential treatment centers for emotionally disturbed children (%)
People in Group quarters - Training schools for juvenile delinquents (%)
People in Group quarters - Short-term care, detention or diagnostic centers for delinquent children (%)
People in Group quarters - Type of juvenile institution unknown (%)
People in Group quarters - Noninstitutionalized population (%)
People in Group quarters - College dormitories (includes college quarters off campus) (%)
People in Group quarters - Military quarters (%)
People in Group quarters - On base (%)
People in Group quarters - Barracks, unaccompanied personnel housing (UPH), (Enlisted/Officer), ;and similar group living quarters for military personnel (%)
People in Group quarters - Transient quarters for temporary residents (%)
People in Group quarters - Military ships (%)
People in Group quarters - Group homes (%)
People in Group quarters - Homes or halfway houses for drug/alcohol abuse (%)
People in Group quarters - Homes for the mentally ill (%)
People in Group quarters - Homes for the mentally retarded (%)
People in Group quarters - Homes for the physically handicapped (%)
People in Group quarters - Other group homes (%)
People in Group quarters - Religious group quarters (%)
People in Group quarters - Dormitories (%)
People in Group quarters - Agriculture workers' dormitories on farms (%)
People in Group quarters - Job Corps and vocational training facilities (%)
People in Group quarters - Other workers' dormitories (%)
People in Group quarters - Crews of maritime vessels (%)
People in Group quarters - Other nonhousehold living situations (%)
People in Group quarters - Other noninstitutional group quarters (%)
Residents speaking English at home (%)
Residents speaking English at home - Born in the United States (%)
Residents speaking English at home - Native, born elsewhere (%)
Residents speaking English at home - Foreign born (%)
Residents speaking Spanish at home (%)
Residents speaking Spanish at home - Born in the United States (%)
Residents speaking Spanish at home - Native, born elsewhere (%)
Residents speaking Spanish at home - Foreign born (%)
Residents speaking other language at home (%)
Residents speaking other language at home - Born in the United States (%)
Residents speaking other language at home - Native, born elsewhere (%)
Residents speaking other language at home - Foreign born (%)
Class of Workers - Employee of private company (%)
Class of Workers - Self-employed in own incorporated business (%)
Class of Workers - Private not-for-profit wage and salary workers (%)
Class of Workers - Local government workers (%)
Class of Workers - State government workers (%)
Class of Workers - Federal government workers (%)
Class of Workers - Self-employed workers in own not incorporated business and Unpaid family workers (%)
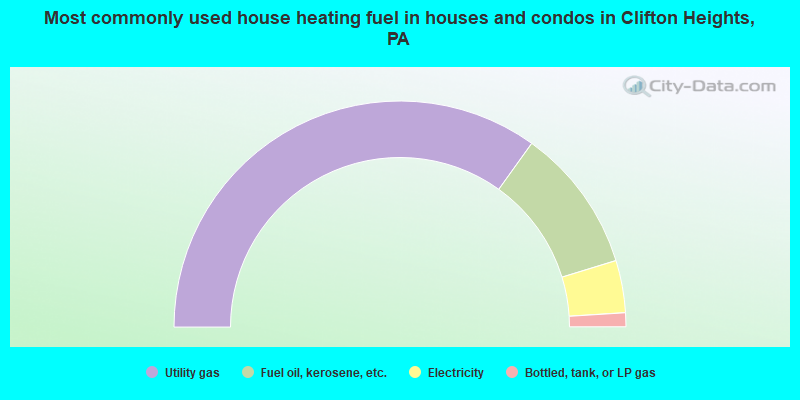
House heating fuel used in houses and condos - Utility gas (%)
House heating fuel used in houses and condos - Bottled, tank, or LP gas (%)
House heating fuel used in houses and condos - Electricity (%)
House heating fuel used in houses and condos - Fuel oil, kerosene, etc. (%)
House heating fuel used in houses and condos - Coal or coke (%)
House heating fuel used in houses and condos - Wood (%)
House heating fuel used in houses and condos - Solar energy (%)
House heating fuel used in houses and condos - Other fuel (%)
House heating fuel used in houses and condos - No fuel used (%)
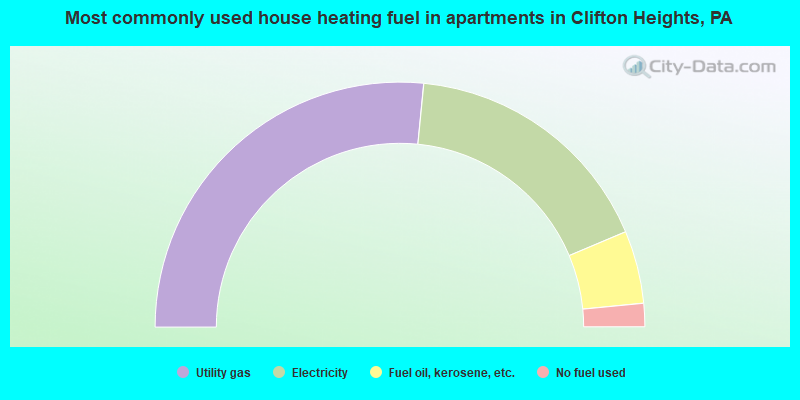
House heating fuel used in apartments - Utility gas (%)
House heating fuel used in apartments - Bottled, tank, or LP gas (%)
House heating fuel used in apartments - Electricity (%)
House heating fuel used in apartments - Fuel oil, kerosene, etc. (%)
House heating fuel used in apartments - Coal or coke (%)
House heating fuel used in apartments - Wood (%)
House heating fuel used in apartments - Solar energy (%)
House heating fuel used in apartments - Other fuel (%)
House heating fuel used in apartments - No fuel used (%)
Armed forces status - In Armed Forces (%)
Armed forces status - Civilian (%)
Armed forces status - Civilian - Veteran (%)
Armed forces status - Civilian - Nonveteran (%)
Fatal accidents locations in years 2005-2021
Fatal accidents locations in 2005
Fatal accidents locations in 2006
Fatal accidents locations in 2007
Fatal accidents locations in 2008
Fatal accidents locations in 2009
Fatal accidents locations in 2010
Fatal accidents locations in 2011
Fatal accidents locations in 2012
Fatal accidents locations in 2013
Fatal accidents locations in 2014
Fatal accidents locations in 2015
Fatal accidents locations in 2016
Fatal accidents locations in 2017
Fatal accidents locations in 2018
Fatal accidents locations in 2019
Fatal accidents locations in 2020
Fatal accidents locations in 2021
Alcohol use - People drinking some alcohol every month (%)
Alcohol use - People not drinking at all (%)
Alcohol use - Average days/month drinking alcohol
Alcohol use - Average drinks/week
Alcohol use - Average days/year people drink much
Audiometry - Average condition of hearing (%)
Audiometry - People that can hear a whisper from across a quiet room (%)
Audiometry - People that can hear normal voice from across a quiet room (%)
Audiometry - Ears ringing, roaring, buzzing (%)
Audiometry - Had a job exposure to loud noise (%)
Audiometry - Had off-work exposure to loud noise (%)
Blood Pressure & Cholesterol - Has high blood pressure (%)
Blood Pressure & Cholesterol - Checking blood pressure at home (%)
Blood Pressure & Cholesterol - Frequently checking blood cholesterol (%)
Blood Pressure & Cholesterol - Has high cholesterol level (%)
Consumer Behavior - Money monthly spent on food at supermarket/grocery store
Consumer Behavior - Money monthly spent on food at other stores
Consumer Behavior - Money monthly spent on eating out
Consumer Behavior - Money monthly spent on carryout/delivered foods
Consumer Behavior - Income spent on food at supermarket/grocery store (%)
Consumer Behavior - Income spent on food at other stores (%)
Consumer Behavior - Income spent on eating out (%)
Consumer Behavior - Income spent on carryout/delivered foods (%)
Current Health Status - General health condition (%)
Current Health Status - Blood donors (%)
Current Health Status - Has blood ever tested for HIV virus (%)
Current Health Status - Left-handed people (%)
Dermatology - People using sunscreen (%)
Diabetes - Diabetics (%)
Diabetes - Had a blood test for high blood sugar (%)
Diabetes - People taking insulin (%)
Diet Behavior & Nutrition - Diet health (%)
Diet Behavior & Nutrition - Milk product consumption (# of products/month)
Diet Behavior & Nutrition - Meals not home prepared (#/week)
Diet Behavior & Nutrition - Meals from fast food or pizza place (#/week)
Diet Behavior & Nutrition - Ready-to-eat foods (#/month)
Diet Behavior & Nutrition - Frozen meals/pizza (#/month)
Drug Use - People that ever used marijuana or hashish (%)
Drug Use - Ever used hard drugs (%)
Drug Use - Ever used any form of cocaine (%)
Drug Use - Ever used heroin (%)
Drug Use - Ever used methamphetamine (%)
Health Insurance - People covered by health insurance (%)
Kidney Conditions-Urology - Avg. # of times urinating at night
Medical Conditions - People with asthma (%)
Medical Conditions - People with anemia (%)
Medical Conditions - People with psoriasis (%)
Medical Conditions - People with overweight (%)
Medical Conditions - Elderly people having difficulties in thinking or remembering (%)
Medical Conditions - People who ever received blood transfusion (%)
Medical Conditions - People having trouble seeing even with glass/contacts (%)
Medical Conditions - People with arthritis (%)
Medical Conditions - People with gout (%)
Medical Conditions - People with congestive heart failure (%)
Medical Conditions - People with coronary heart disease (%)
Medical Conditions - People with angina pectoris (%)
Medical Conditions - People who ever had heart attack (%)
Medical Conditions - People who ever had stroke (%)
Medical Conditions - People with emphysema (%)
Medical Conditions - People with thyroid problem (%)
Medical Conditions - People with chronic bronchitis (%)
Medical Conditions - People with any liver condition (%)
Medical Conditions - People who ever had cancer or malignancy (%)
Mental Health - People who have little interest in doing things (%)
Mental Health - People feeling down, depressed, or hopeless (%)
Mental Health - People who have trouble sleeping or sleeping too much (%)
Mental Health - People feeling tired or having little energy (%)
Mental Health - People with poor appetite or overeating (%)
Mental Health - People feeling bad about themself (%)
Mental Health - People who have trouble concentrating on things (%)
Mental Health - People moving or speaking slowly or too fast (%)
Mental Health - People having thoughts they would be better off dead (%)
Oral Health - Average years since last visit a dentist
Oral Health - People embarrassed because of mouth (%)
Oral Health - People with gum disease (%)
Oral Health - General health of teeth and gums (%)
Oral Health - Average days a week using dental floss/device
Oral Health - Average days a week using mouthwash for dental problem
Oral Health - Average number of teeth
Pesticide Use - Households using pesticides to control insects (%)
Pesticide Use - Households using pesticides to kill weeds (%)
Physical Activity - People doing vigorous-intensity work activities (%)
Physical Activity - People doing moderate-intensity work activities (%)
Physical Activity - People walking or bicycling (%)
Physical Activity - People doing vigorous-intensity recreational activities (%)
Physical Activity - People doing moderate-intensity recreational activities (%)
Physical Activity - Average hours a day doing sedentary activities
Physical Activity - Average hours a day watching TV or videos
Physical Activity - Average hours a day using computer
Physical Functioning - People having limitations keeping them from working (%)
Physical Functioning - People limited in amount of work they can do (%)
Physical Functioning - People that need special equipment to walk (%)
Physical Functioning - People experiencing confusion/memory problems (%)
Physical Functioning - People requiring special healthcare equipment (%)
Prescription Medications - Average number of prescription medicines taking
Preventive Aspirin Use - Adults 40+ taking low-dose aspirin (%)
Reproductive Health - Vaginal deliveries (%)
Reproductive Health - Cesarean deliveries (%)
Reproductive Health - Deliveries resulted in a live birth (%)
Reproductive Health - Pregnancies resulted in a delivery (%)
Reproductive Health - Women breastfeeding newborns (%)
Reproductive Health - Women that had a hysterectomy (%)
Reproductive Health - Women that had both ovaries removed (%)
Reproductive Health - Women that have ever taken birth control pills (%)
Reproductive Health - Women taking birth control pills (%)
Reproductive Health - Women that have ever used Depo-Provera or injectables (%)
Reproductive Health - Women that have ever used female hormones (%)
Sexual Behavior - People 18+ that ever had sex (vaginal, anal, or oral) (%)
Sexual Behavior - Males 18+ that ever had vaginal sex with a woman (%)
Sexual Behavior - Males 18+ that ever performed oral sex on a woman (%)
Sexual Behavior - Males 18+ that ever had anal sex with a woman (%)
Sexual Behavior - Males 18+ that ever had any sex with a man (%)
Sexual Behavior - Females 18+ that ever had vaginal sex with a man (%)
Sexual Behavior - Females 18+ that ever performed oral sex on a man (%)
Sexual Behavior - Females 18+ that ever had anal sex with a man (%)
Sexual Behavior - Females 18+ that ever had any kind of sex with a woman (%)
Sexual Behavior - Average age people first had sex
Sexual Behavior - Average number of female sex partners in lifetime (males 18+)
Sexual Behavior - Average number of female vaginal sex partners in lifetime (males 18+)
Sexual Behavior - Average age people first performed oral sex on a woman (18+)
Sexual Behavior - Average number of woman performed oral sex on in lifetime (18+)
Sexual Behavior - Average number of male sex partners in lifetime (males 18+)
Sexual Behavior - Average number of male anal sex partners in lifetime (males 18+)
Sexual Behavior - Average age people first performed oral sex on a man (18+)
Sexual Behavior - Average number of male oral sex partners in lifetime (18+)
Sexual Behavior - People using protection when performing oral sex (%)
Sexual Behavior - Average number of times people have vaginal or anal sex a year
Sexual Behavior - People having sex without condom (%)
Sexual Behavior - Average number of male sex partners in lifetime (females 18+)
Sexual Behavior - Average number of male vaginal sex partners in lifetime (females 18+)
Sexual Behavior - Average number of female sex partners in lifetime (females 18+)
Sexual Behavior - Circumcised males 18+ (%)
Sleep Disorders - Average hours sleeping at night
Sleep Disorders - People that has trouble sleeping (%)
Smoking-Cigarette Use - People smoking cigarettes (%)
Taste & Smell - People 40+ having problems with smell (%)
Taste & Smell - People 40+ having problems with taste (%)
Taste & Smell - People 40+ that ever had wisdom teeth removed (%)
Taste & Smell - People 40+ that ever had tonsils teeth removed (%)
Taste & Smell - People 40+ that ever had a loss of consciousness because of a head injury (%)
Taste & Smell - People 40+ that ever had a broken nose or other serious injury to face or skull (%)
Taste & Smell - People 40+ that ever had two or more sinus infections (%)
Weight - Average height (inches)
Weight - Average weight (pounds)
Weight - Average BMI
Weight - People that are obese (%)
Weight - People that ever were obese (%)
Weight - People trying to lose weight (%)
Officers per 1,000 residents here:
1.64Pennsylvania average:
2.55
Latest news from Clifton Heights, PA collected exclusively by city-data.com from local newspapers, TV, and radio stations
Ancestries: American (18.0%), Italian (12.7%), European (9.3%), African (5.3%), Irish (3.4%), Palestinian (2.7%).
Current Local Time:
Incorporated on 06/01/1885
Land area: 0.62 square miles.
Population density: 10,907 people per square mile (high).
649 residents are foreign born (3.5% Africa , 2.6% Asia , 1.9% Europe , 1.2% Latin America ).
This borough:
9.5%Pennsylvania:
7.3%
Median real estate property taxes paid for housing units with mortgages in 2022: $4,716 (2.3%)Median real estate property taxes paid for housing units with no mortgage in 2022: $4,601 (2.6%)
Nearest city with pop. 50,000+: Philadelphia, PA
Nearest cities:
Latitude: 39.93 N, Longitude: 75.30 W
Daytime population change due to commuting: -1,537 (-22.5%)Workers who live and work in this borough: 287 (10.3%)
Unemployment in December 2023: Here:
2.7%Pennsylvania:
2.9%
Most common industries in Clifton Heights, PA (%)
Both Males Females
Health care (10.6%)
Construction (7.5%)
Accommodation & food services (7.2%)
Finance & insurance (6.7%)
Educational services (6.6%)
Professional, scientific, technical services (4.9%)
Administrative & support & waste management services (4.7%)
Construction (12.8%)
Accommodation & food services (7.1%)
Administrative & support & waste management services (6.3%)
Professional, scientific, technical services (5.0%)
Educational services (4.6%)
Health care (4.1%)
Finance & insurance (3.4%)
Health care (17.8%)
Finance & insurance (10.4%)
Educational services (8.9%)
Accommodation & food services (7.4%)
Food & beverage stores (5.0%)
Professional, scientific, technical services (4.7%)
Religious, grantmaking, civic, professional, similar organizations (3.9%)
Most common occupations in Clifton Heights, PA (%)
Both Males Females
Other office and administrative support workers, including supervisors (5.3%)
Driver/sales workers and truck drivers (4.9%)
Other sales and related occupations, including supervisors (4.3%)
Electrical equipment mechanics and other installation, maintenance, and repair workers, including supervisors (3.9%)
Building and grounds cleaning and maintenance occupations (3.6%)
Cashiers (3.6%)
Other management occupations, except farmers and farm managers (3.3%)
Driver/sales workers and truck drivers (7.9%)
Electrical equipment mechanics and other installation, maintenance, and repair workers, including supervisors (6.9%)
Building and grounds cleaning and maintenance occupations (4.5%)
Sales representatives, services, wholesale and manufacturing (4.1%)
Other production occupations, including supervisors (4.1%)
Vehicle and mobile equipment mechanics, installers, and repairers (3.5%)
Computer specialists (3.3%)
Other office and administrative support workers, including supervisors (7.9%)
Secretaries and administrative assistants (6.9%)
Other sales and related occupations, including supervisors (6.2%)
Cashiers (5.8%)
Other management occupations, except farmers and farm managers (4.4%)
Information and record clerks, except customer service representatives (4.3%)
Financial clerks, except bookkeeping, accounting and auditing clerks (4.2%)
Tornado activity:
Clifton Heights-area historical tornado activity is slightly above Pennsylvania state average. It is 2% greater than the overall U.S. average.
On 3/22/1955, a category F3 (max. wind speeds 158-206 mph) tornado 12.5 miles away from the Clifton Heights borough center killed one person and caused between $50,000 and $500,000 in damages.
On 4/28/1961, a category F3 tornado 23.1 miles away from the borough center caused between $5000 and $50,000 in damages.
Earthquake activity:
Clifton Heights-area historical earthquake activity is significantly above Pennsylvania state average. It is 65% smaller than the overall U.S. average. On 8/23/2011 at 17:51:04, a magnitude 5.8 (5.8 MW, Depth: 3.7 mi, Class: Moderate, Intensity: VI - VII) earthquake occurred 199.2 miles away from the city center On 1/16/1994 at 01:49:16, a magnitude 4.6 (4.6 MB, 4.6 LG, Depth: 3.1 mi, Class: Light, Intensity: IV - V) earthquake occurred 48.0 miles away from Clifton Heights center On 1/16/1994 at 00:42:43, a magnitude 4.2 (4.2 MB, 4.0 LG, Depth: 3.1 mi) earthquake occurred 46.6 miles away from Clifton Heights center On 10/7/1983 at 10:18:46, a magnitude 5.3 (5.1 MB, 5.3 LG, 5.1 ML) earthquake occurred 282.6 miles away from the city center On 11/30/2017 at 21:47:31, a magnitude 4.1 (4.1 MW, Depth: 6.1 mi) earthquake occurred 51.1 miles away from Clifton Heights center On 9/25/1998 at 19:52:52, a magnitude 5.2 (4.8 MB, 4.3 MS, 5.2 LG, 4.5 MW, Depth: 3.1 mi) earthquake occurred 288.3 miles away from the city center Magnitude types: regional Lg-wave magnitude (LG), body-wave magnitude (MB), local magnitude (ML), surface-wave magnitude (MS), moment magnitude (MW) Natural disasters: The number of natural disasters in Delaware County (21) is greater than the US average (15).Major Disasters (Presidential) Declared: 15Emergencies Declared: 6Hurricanes: 5, Floods: 4, Winter Storms: 4, Storms: 3, Tropical Storms: 3, Snowstorms: 2, Blizzard: 1, Snowfall: 1, Tropical Depression: 1, Water Shortage: 1, Other: 1 (Note: some incidents may be assigned to more than one category). Hospitals and medical centers near Clifton Heights: LEADER NSG REHAB CTR/YEADON (Nursing Home, about 2 miles away; YEADON, PA)
MANORCARE HEALTH SERVICES-YEADON (Nursing Home, about 2 miles away; YEADON, PA)
JORPAT NURSING SERVICES INC (Home Health Center, about 2 miles away; LANSDOWNE, PA)
LITTLE FLOWER MANOR (Nursing Home, about 2 miles away; DARBY, PA)
LITTLE FLOWER NRSG HM (Nursing Home, about 2 miles away; DARBY, PA)
MERCY HEALTH HOSPICE PROGRAM (Hospital, about 2 miles away; DARBY, PA)
MERCY FITZGERALD HOSPITAL SNF (Nursing Home, about 2 miles away; DARBY, PA)
Amtrak stations near Clifton Heights: 6 miles: ARDMORE (STATION RD. & LANCASTER AVE.) Services: enclosed waiting area, public restrooms, public payphones, paid short-term parking, call for car rental service, call for taxi service, public transit connection.
7 miles: PHILADELPHIA (30TH & MARKET STS.) Services: ticket office, fully wheelchair accessible, enclosed waiting area, public restrooms, public payphones, snack bar, ATM, paid short-term parking, paid long-term parking, car rental agency, taxi stand, public transit connection.
9 miles: NORTH PHILADELPHIA (PHILADELPHIA, 2900 N. BROAD ST.) Services: ticket office, fully wheelchair accessible, enclosed waiting area, public restrooms, public payphones, paid short-term parking, paid long-term parking, call for taxi service, public transit connection.
Colleges/universities with over 2000 students nearest to Clifton Heights:
University of the Sciences (about 5 miles; Philadelphia, PA ; Full-time enrollment: 2,464)
Saint Joseph's University (about 6 miles; Philadelphia, PA ; FT enrollment: 7,329)
University of Pennsylvania (about 6 miles; Philadelphia, PA ; FT enrollment: 25,693)
Widener University-Main Campus (about 6 miles; Chester, PA ; FT enrollment: 4,051)
Delaware County Community College (about 6 miles; Media, PA ; FT enrollment: 8,419)
Drexel University (about 6 miles; Philadelphia, PA ; FT enrollment: 22,969)
The Art Institute of Philadelphia (about 7 miles; Philadelphia, PA ; FT enrollment: 2,432)
Public elementary/middle school in Clifton Heights:
See full list of schools located in Clifton Heights
Notable locations in Clifton Heights: (A) , Kelleyville (B) , Clifton Station (C) , Clifton Heights Borough Hall (D) , Baltimore Pike Station (E) , Penn Street Station (F) , Springfield Road Station (G) , Clifton Heights Fire Company Station 3 (H) , Clifton Heights Police Department (I) . Display/hide their locations on the map
Hotel:
Birthplace of: Dan Morgan - College football player, Lena Blackburne - Major League Baseball player, John Kelly (outfielder) - Baseball player, Todd Rizzo - Baseball player.
Delaware County has a predicted average indoor radon screening level greater than 4 pCi/L (pico curies per liter) - Highest Potential Average household size: This borough:
2.5 peoplePennsylvania:
2.5 people
Percentage of family households: This borough:
62.1%Whole state:
65.0%
Percentage of households with unmarried partners: This borough:
9.7%Whole state:
6.6%
Likely homosexual households (counted as self-reported same-sex unmarried-partner households)
Lesbian couples: 0.3% of all households Gay men: 0.1% of all households
People in group quarters in Clifton Heights in 2000:
15 people in schools, hospitals, or wards for the intellectually disabled
6 people in homes for the mentally retarded
6 people in religious group quarters
Banks with branches in Clifton Heights (2011 data):
Beneficial Mutual Savings Bank: Baltimore Pike Branch at 410 W Branch Pike, branch established on 1968/12/09. Info updated 2011/07/08: Bank assets: $4,590.2 mil, Deposits: $3,659.5 mil, headquarters in Philadelphia, PA, positive income , 60 total offices
Sovereign Bank, National Association: Clifton Heights Branch at 5300 Baltimore Pike, branch established on 1970/06/18. Info updated 2012/01/31: Bank assets: $78,146.9 mil, Deposits: $48,042.9 mil, headquarters in Wilmington, DE, positive income , Commercial Lending Specialization, 718 total offices , Holding Company: Banco Santander, S.A.
Citizens Bank of Pennsylvania: Clifton Heights Branch at 5251 West Baltimore Pike, branch established on 1958/09/18. Info updated 2010/09/24: Bank assets: $32,316.9 mil, Deposits: $25,297.1 mil, headquarters in Philadelphia, PA, positive income , 396 total offices , Holding Company: Uk Financial Investments Limited
For population 15 years and over in Clifton Heights:
Never married: 37.6%Now married: 42.9%Separated: 1.6%Widowed: 5.6%Divorced: 12.3% For population 25 years and over in Clifton Heights:
High school or higher: 87.0%Bachelor's degree or higher: 12.7%Graduate or professional degree: 2.1%Unemployed: 4.0%Mean travel time to work (commute): 24.6 minutes
Education Gini index (Inequality in education) Here:
8.4Pennsylvania average:
11.4
Religion statistics for Clifton Heights, PA (based on Delaware County data)
Religion Adherents Congregations Catholic 262,506 50 Mainline Protestant 52,224 169 Evangelical Protestant 24,456 136 Other 9,009 27 Black Protestant 5,617 39 Orthodox 5,096 8 None 200,071 -
Source: Clifford Grammich, Kirk Hadaway, Richard Houseal, Dale E.Jones, Alexei Krindatch, Richie Stanley and Richard H.Taylor. 2012. 2010 U.S.Religion Census: Religious Congregations & Membership Study. Association of Statisticians of American Religious Bodies. Jones, Dale E., et al. 2002. Congregations and Membership in the United States 2000. Nashville, TN: Glenmary Research Center. Graphs represent county-level data
Food Environment Statistics: Number of grocery stores : 103This county :
1.86 / 10,000 pop.State :
2.04 / 10,000 pop.
Number of supercenters and club stores : 1Here :
0.02 / 10,000 pop.Pennsylvania :
0.09 / 10,000 pop.
Number of convenience stores (no gas) : 83This county :
1.50 / 10,000 pop.Pennsylvania :
0.88 / 10,000 pop.
Number of convenience stores (with gas) : 63This county :
1.14 / 10,000 pop.State :
2.52 / 10,000 pop.
Number of full-service restaurants : 313Delaware County :
5.66 / 10,000 pop.State :
7.12 / 10,000 pop.
Adult diabetes rate : Here :
8.5%Pennsylvania :
9.1%
Adult obesity rate : Here :
25.7%Pennsylvania :
27.2%
Low-income preschool obesity rate : Here :
11.1%Pennsylvania :
11.5%
Health and Nutrition: Healthy diet rate : Here:
47.7%Pennsylvania:
50.2%
Average overall health of teeth and gums : Clifton Heights:
42.2%Pennsylvania:
47.1%
Average BMI : Clifton Heights:
28.0State:
28.7
People feeling badly about themselves : This city:
21.2%Pennsylvania:
20.8%
People not drinking alcohol at all : Clifton Heights:
10.6%Pennsylvania:
10.9%
Average hours sleeping at night : Clifton Heights:
6.9Pennsylvania:
6.8
Overweight people : Clifton Heights:
31.0%Pennsylvania:
34.3%
General health condition : This city:
53.5%Pennsylvania:
56.2%
Average condition of hearing : Clifton Heights:
77.2%State:
78.3%
More about Health and Nutrition of Clifton Heights, PA Residents
Local government employment and payroll (March 2022)
Function
Full-time employees
Monthly full-time payroll
Average yearly full-time wage
Part-time employees
Monthly part-time payroll
Police Protection - Officers
9 $54,803 $73,071 22 $53,040 Solid Waste Management
5 $26,751 $64,202 0 $0 Streets and Highways
3 $17,276 $69,104 9 $23,305 Other Government Administration
1 $3,341 $40,092 71 $19,969 Police - Other
1 $3,716 $44,592 0 $0 Judicial and Legal
0 $0 4 $13,620 Financial Administration
0 $0 12 $36,925 Health
0 $0 4 $1,368
Totals for Government
19 $105,887 $66,876 122 $148,227
Clifton Heights government finances - Expenditure in 2017 (per resident):
Current Operations - Police Protection: $1,979,000 ($291.29)
Regular Highways: $907,000 ($133.50)Sewerage: $812,000 ($119.52)Central Staff Services: $713,000 ($104.95)Solid Waste Management: $296,000 ($43.57)General - Other: $247,000 ($36.36)Local Fire Protection: $198,000 ($29.14)Protective Inspection and Regulation - Other: $107,000 ($15.75)Parks and Recreation: $48,000 ($7.07)Health - Other: $2,000 ($0.29)General - Interest on Debt: $70,000 ($10.30)
Clifton Heights government finances - Revenue in 2017 (per resident):
Charges - Sewerage: $924,000 ($136.00)
Solid Waste Management: $501,000 ($73.74)Other: $42,000 ($6.18)Miscellaneous - Fines and Forfeits: $60,000 ($8.83)
General Revenue - Other: $5,000 ($0.74)Interest Earnings: $1,000 ($0.15)State Intergovernmental - Other: $195,000 ($28.70)
Tax - Property: $2,944,000 ($433.32)
Occupation and Business License - Other: $357,000 ($52.55)Public Utility License: $113,000 ($16.63)Documentary and Stock Transfer: $70,000 ($10.30)
Clifton Heights government finances - Debt in 2017 (per resident):
Long Term Debt - Beginning Outstanding - Unspecified Public Purpose: $1,759,000 ($258.90)
Outstanding Unspecified Public Purpose: $1,664,000 ($244.92)Retired Unspecified Public Purpose: $395,000 ($58.14)Issue, Unspecified Public Purpose: $300,000 ($44.16)
Clifton Heights government finances - Cash and Securities in 2017 (per resident):
Other Funds - Cash and Securities: $3,150,000 ($463.64)
5.79% of this county's 2021 resident taxpayers lived in other counties in 2020 ($87,801 average adjusted gross income )
Here:
5.79%Pennsylvania average:
5.27%
0.01% of residents moved from foreign countries ($122 average AGI )Delaware County:
0.01%Pennsylvania average:
0.01%
Top counties from which taxpayers relocated into this county between 2020 and 2021:
6.34% of this county's 2020 resident taxpayers moved to other counties in 2021 ($87,816 average adjusted gross income )
Here:
6.34%Pennsylvania average:
5.44%
0.01% of residents moved to foreign countries ($90 average AGI )Delaware County:
0.01%Pennsylvania average:
0.01%
Top counties to which taxpayers relocated from this county between 2020 and 2021:
Businesses in Clifton Heights, PA
Name Count Name Count
7-Eleven 1 McDonald's 1 Arby's 1 Payless 1 AutoZone 1 Penske 1 Burger King 1 Pizza Hut 1 Dennys 1 Rite Aid 1 FedEx 1 Taco Bell 1 IHOP 1 U-Haul 2 KFC 1 UPS 1 Kmart 1
Strongest AM radio stations in Clifton Heights:
WPEN (950 AM; 50 kW; PHILADELPHIA, PA; Owner: GREATER PHILADELPHIA RADIO, INC.)
WVCH (740 AM; 50 kW; CHESTER, PA; Owner: WVCH COMMUNICATIONS, INC.)
WNWR (1540 AM; 50 kW; PHILADELPHIA, PA)
WZZD (990 AM; 50 kW; PHILADELPHIA, PA; Owner: PENNSYLVANIA MEDIA ASSOCIATES, INC.)
KYW (1060 AM; 50 kW; PHILADELPHIA, PA; Owner: INFINITY BROADCASTING OPERATIONS, INC.)
WPHT (1210 AM; 50 kW; PHILADELPHIA, PA; Owner: INFINITY BROADCASTING OPERATIONS, INC.)
WDAS (1480 AM; 5 kW; PHILADELPHIA, PA; Owner: AMFM RADIO LICENSES, L.L.C.)
WWJZ (640 AM; 50 kW; MOUNT HOLLY, NJ; Owner: ABC, INC.)
WURD (900 AM; 1 kW; PHILADELPHIA, PA; Owner: LEVAS COMMUNICATIONS, LLC)
WIP (610 AM; 5 kW; PHILADELPHIA, PA; Owner: INFINITY BROADCASTING CORPORATION OF PHILADELPHIA)
WFIL (560 AM; 5 kW; PHILADELPHIA, PA; Owner: PENNSYLVANIA MEDIA ASSOCIATES, INC.)
WTMR (800 AM; 5 kW; CAMDEN, NJ; Owner: WTMR LICENSE LIMITED PARTNERSHIP)
WWDB (860 AM; daytime; 10 kW; PHILADELPHIA, PA)
Strongest FM radio stations in Clifton Heights:
WPLY (100.3 FM; MEDIA, PA; Owner: RADIO ONE LICENSES, LLC)
WMGK (102.9 FM; PHILADELPHIA, PA; Owner: GREATER PHILADELPHIA RADIO, INC.)
WMWX (95.7 FM; PHILADELPHIA, PA; Owner: GREATER PHILADELPHIA RADIO, INC.)
WOGL (98.1 FM; PHILADELPHIA, PA; Owner: INFINITY BROADCASTING OPERATIONS, INC.)
WMMR (93.3 FM; PHILADELPHIA, PA; Owner: GREATER BOSTON RADIO, INC.)
WBEB (101.1 FM; PHILADELPHIA, PA; Owner: WEAZ-FM RADIO, INC.)
WRTI (90.1 FM; PHILADELPHIA, PA; Owner: TEMPLE UNIV. OF THE COMMONWEALTH, ET)
WSNI-FM (104.5 FM; PHILADELPHIA, PA; Owner: AMFM RADIO LICENSES, L.L.C.)
WPHI-FM (103.9 FM; JENKINTOWN, PA; Owner: RADIO ONE LICENSES, LLC)
WXTU (92.5 FM; PHILADELPHIA, PA; Owner: WXTU LICENSE LIMITED PARTNERSHIP)
WHYY-FM (90.9 FM; PHILADELPHIA, PA; Owner: WHYY, INC.)
WXPN (88.5 FM; PHILADELPHIA, PA; Owner: TRUSTEES OF THE UNIVERSITY OF PENNA.)
WPTP (96.5 FM; PHILADELPHIA, PA; Owner: WDAS LICENSE LIMITED PARTNERSHIP)
WDAS-FM (105.3 FM; PHILADELPHIA, PA; Owner: AMFM RADIO LICENSES, L.L.C.)
WUSL (98.9 FM; PHILADELPHIA, PA; Owner: AMFM RADIO LICENSES, L.L.C.)
WYSP (94.1 FM; PHILADELPHIA, PA; Owner: INFINITY BROADCASTING OPERATIONS, INC.)
WIOQ (102.1 FM; PHILADELPHIA, PA; Owner: AMFM RADIO LICENSES, L.L.C.)
WHHS (107.9 FM; HAVERTOWN, PA; Owner: SCHOOL DISTRICT OF HAVERFORD TOWNSHP)
WJJZ (106.1 FM; PHILADELPHIA, PA; Owner: AMFM RADIO LICENSES, L.L.C.)
WSRN-FM (91.5 FM; SWARTHMORE, PA; Owner: SWARTHMORE COLLEGE)
TV broadcast stations around Clifton Heights:
KYW-TV (Channel 3; PHILADELPHIA, PA; Owner: CBS BROADCASTING INC.)
WWJT-LP (Channel 7; PHILADELPHIA, PA; Owner: PHILADELPHIA TELEVISION NETWORK, INC)
WPSG (Channel 57; PHILADELPHIA, PA; Owner: VIACOM STATIONS GROUP OF PHILADELPHIA INC.)
WPVI-TV (Channel 6; PHILADELPHIA, PA; Owner: ABC, INC.)
WPHL-TV (Channel 17; PHILADELPHIA, PA; Owner: TRIBUNE TELEVISION COMPANY)
WPPX (Channel 61; WILMINGTON, DE; Owner: PAXSON PHILADELPHIA LICENSE, INC.)
WCAU (Channel 10; PHILADELPHIA, PA; Owner: NBC SUBSIDIARY (WCAU-TV), L.P.)
WGTW (Channel 48; BURLINGTON, NJ; Owner: BRUNSON COMMUNICATIONS, INC.)
WYBE (Channel 35; PHILADELPHIA, PA; Owner: INDEPENDENCE PUBLIC MEDIA OF PHILADELPHIA, INC.)
WHYY-TV (Channel 12; WILMINGTON, DE; Owner: WHYY, INC.)
WTXF-TV (Channel 29; PHILADELPHIA, PA; Owner: FOX TV STATIONS OF PHILADELPHIA)
WELL-LP (Channel 8; WILLOW GROVE, ETC., PA; Owner: WORD OF GOD FELLOWSHIP, INC.)
WFPA-CA (Channel 28; PHILADELPHIA, PA; Owner: WXTV LICENSE PARTNERSHIP, G.P.)
WPHA-LP (Channel 63; PHILADELPHIA, PA; Owner: COMMERCIAL BROADCASTING CORP.)
WUVP (Channel 65; VINELAND, NJ; Owner: UNIVISION PHILADELPHIA LLC)
WMCN-TV (Channel 53; ATLANTIC CITY, NJ; Owner: LENFEST BROADCASTING, LLC)
WNJS (Channel 23; CAMDEN, NJ; Owner: NEW JERSEY PUBLIC BROADCASTING AUTHORITY)
WTSD-CA (Channel 14; WILMINGTON, DE; Owner: PRIORITY COMMUNICATIONS MINISTRIES, INC.)
W40AZ (Channel 40; WILMINGTON, DE; Owner: NATIONAL MINORITY T.V., INC.)
W55BT (Channel 55; TALLEYVILLE, DE; Owner: MEDIACASTING LLC)
WPSJ-LP (Channel 8; HAMMONTON, ETC., NJ; Owner: ENGLE BROADCASTING)
W33BT (Channel 33; CAMDEN, NJ; Owner: MEDIACASTING LLC)
WNJT (Channel 52; TRENTON, NJ; Owner: NEW JERSEY PUBLIC BROADCASTING AUTHORITY)
National Bridge Inventory (NBI) Statistics 3 Number of bridges49ft / 15.1m Total length $275,000 Total costs19,827 Total average daily traffic960 Total average daily truck traffic23,954 Total future (year 2032) average daily traffic
FCC Registered Antenna Towers: 7
KELLYE E ABERNATHY, Madison & Holly Streets (Lat: 39.929444 Lon: -75.288333), Type: 27.4, Overall height: 27.4 m, Registrant: Cingular Wireless LLC, Kellye.E.Abernathy@cingular.Com, , Plano, Phone: (469) 229-7422 David C Jatlow, Madison & Holly Streets (Lat: 39.929444 Lon: -75.288333), Type: 27.4, Overall height: 27.4 m, Registrant: Cingular Wireless (Formerly At&t Wireless Services), David.Jatlow@cingular.Com, , Washi-ngton, Phone: (202) 223-9222 DAVID C JATLOW, Madison & Holly Streets (Lat: 39.929444 Lon: -75.288333), Type: 27.4, Overall height: 27.4 m, Registrant: Cingular Wireless LLC, Kellye.E.Abernathy, , Dalla-s, Phone: (972) 733-2092 David Saska, Madison & Holly Streets (Lat: 39.929444 Lon: -75.288333), Type: 27.4, Overall height: 27.4 m, Registrant: At&t Mobility LLC, Ka8805@att.Com, , Plano, Phone: (469) 229-7422 David Saska, Madison & Holly Streets (Lat: 39.929444 Lon: -75.288333), Type: 27.4, Overall height: 27.4 m, Registrant: At&t Mobility LLC, Ka8805@att.Com, , Plano, Phone: (469) 229-7422 Madison & Holly (Lat: 39.928611 Lon: -75.288333), Type: 27.4, Overall height: 27.4 m, Registrant: At&t Wireless Services Inc, Esther.Hilliard@attws.Com, , Washi-ngton, Phone: (202) 223-9222 Madison & Holly Streets (Lat: 39.929444 Lon: -75.288333), Type: 27.4, Overall height: 27.4 m, Registrant: At&t Wireless Services, Inc., Esther.Hilliard@attws.Com, , Washi-ngton, Phone: (202) 223-9222 FCC Registered Private Land Mobile Towers: 1
500 E. Broadway (Lat: 39.931389 Lon: -75.285556), Type: Stack, Structure height: 29.9 m, Call Sign: WPTK474, Assigned Frequencies: 854.812 MHz, 857.837 MHz, Grant Date: 10/12/2011, Expiration Date: 10/19/2021, Cancellation Date: 07/17/2014, Certifier: Robin J Glenny, Registrant: Sprint Nextel Corporation, 12502 Sunrise Valley Drive, M/S: Varesa0209, Reston, VA 20196, Phone: (703) 433-4000, Fax: (703) 433-4483 FCC Registered Broadcast Land Mobile Towers: 1
Lat: 39.930028 Lon: -75.307639, Call Sign: WQVH911, Assigned Frequencies: 72.2400 MHz, Grant Date: 02/18/2015, Expiration Date: 02/18/2025, Cancellation Date: 02/23/2015, Certifier: Joe Mcgilvery, Registrant: Primex Wireless Inc, 965 Wells St., Lake Geneva, WI 53147, Phone: (800) 537-0464FCC Registered Microwave Towers: 3
CLIFTON HEIGHTS, 5300 Baltimore Pike (Lat: 39.925833 Lon: -75.304444), Type: Tower, Structure height: 67.1 m, Overall height: 70.7 m, Call Sign: WQKJ385, Assigned Frequencies: 10785.0 MHz, Grant Date: 06/10/2009, Expiration Date: 02/01/2019, Cancellation Date: 11/29/2012, Certifier: James J.R. Talbot, Registrant: At&t Corp., 2315 Salem Road, First Floor, H9, Conyers, GA 30013, Phone: (770) 602-2065, Fax: (779) 929-4454, Email:
PA-PHL5385A, 500 E Broadway Ave (Lat: 39.931417 Lon: -75.285583), Type: Stack, Structure height: 27.4 m, Overall height: 32.6 m, Call Sign: WQKX541, Assigned Frequencies: 23225.0 MHz, Grant Date: 10/16/2009, Expiration Date: 10/16/2019, Cancellation Date: 07/09/2015, Certifier: Nadja S Sodos-Wallace, Registrant: Sprint Corporation, 12502 Sunrise Valley Drive, M/S: Varesa0209, Reston, VA 20196, Phone: (703) 433-4000, Fax: (703) 433-4483 PL25XC479, 201 Marple Ave (Lat: 39.931417 Lon: -75.285583), Type: Mtower, Structure height: 36.6 m, Call Sign: WQXX988, Assigned Frequencies: 22025.0 MHz, 22025.0 MHz, 22025.0 MHz, 22025.0 MHz, 22025.0 MHz, 22025.0 MHz, 22025.0 MHz, Grant Date: 07/11/2016, Expiration Date: 07/11/2026, Cancellation Date: 05/16/2023, Certifier: David Werblow, Registrant: T-Mobile Usa, Inc., 12920 Se 38th Street, Bellevue, WA 98006, Phone: (425) 383-8401, Email:
FCC Registered Amateur Radio Licenses: 19 (
See the full list of FCC Registered Amateur Radio Licenses in Clifton Heights )
Home Mortgage Disclosure Act Aggregated Statistics For Year 2009(Based on 1 full tract) A) FHA, FSA/RHS & VA B) Conventional C) Refinancings D) Home Improvement Loans E) Loans on Dwellings For 5+ Families F) Non-occupant Loans on Number Average Value Number Average Value Number Average Value Number Average Value Number Average Value Number Average Value
LOANS ORIGINATED 47 $127,489 15 $88,267 97 $110,381 11 $27,818 1 $3,680,000 11 $83,273 APPLICATIONS APPROVED, NOT ACCEPTED 2 $169,500 0 $0 12 $125,250 4 $32,750 0 $0 0 $0 APPLICATIONS DENIED 4 $121,500 5 $102,000 52 $122,769 17 $11,941 0 $0 2 $90,000 APPLICATIONS WITHDRAWN 4 $151,500 1 $100,000 38 $121,553 0 $0 0 $0 0 $0 FILES CLOSED FOR INCOMPLETENESS 1 $269,000 2 $149,500 5 $130,400 1 $100,000 0 $0 0 $0
Aggregated Statistics For Year 2008(Based on 1 full tract) A) FHA, FSA/RHS & VA B) Conventional C) Refinancings D) Home Improvement Loans E) Loans on Dwellings For 5+ Families F) Non-occupant Loans on Number Average Value Number Average Value Number Average Value Number Average Value Number Average Value Number Average Value
LOANS ORIGINATED 28 $141,679 36 $122,417 99 $115,394 27 $30,444 1 $3,100,000 14 $118,857 APPLICATIONS APPROVED, NOT ACCEPTED 1 $138,000 1 $148,000 15 $103,933 2 $7,500 0 $0 4 $90,000 APPLICATIONS DENIED 3 $132,333 1 $148,000 82 $134,354 33 $40,576 1 $4,200,000 5 $124,200 APPLICATIONS WITHDRAWN 3 $107,333 2 $174,000 33 $129,424 3 $33,333 0 $0 0 $0 FILES CLOSED FOR INCOMPLETENESS 0 $0 1 $166,000 5 $159,000 2 $45,000 0 $0 1 $166,000
Aggregated Statistics For Year 2007(Based on 1 full tract) A) FHA, FSA/RHS & VA B) Conventional C) Refinancings D) Home Improvement Loans E) Loans on Dwellings For 5+ Families F) Non-occupant Loans on Number Average Value Number Average Value Number Average Value Number Average Value Number Average Value Number Average Value
LOANS ORIGINATED 10 $138,100 92 $119,141 143 $109,028 43 $44,442 1 $233,000 32 $100,531 APPLICATIONS APPROVED, NOT ACCEPTED 1 $117,000 6 $100,167 20 $117,200 4 $46,750 0 $0 3 $94,667 APPLICATIONS DENIED 2 $137,000 16 $124,938 116 $112,526 39 $36,641 1 $65,000 9 $60,222 APPLICATIONS WITHDRAWN 2 $151,000 9 $103,556 36 $120,333 7 $79,714 0 $0 2 $105,000 FILES CLOSED FOR INCOMPLETENESS 0 $0 6 $108,833 19 $137,211 1 $100,000 0 $0 0 $0
Aggregated Statistics For Year 2006(Based on 1 full tract) A) FHA, FSA/RHS & VA B) Conventional C) Refinancings D) Home Improvement Loans E) Loans on Dwellings For 5+ Families F) Non-occupant Loans on G) Loans On Manufactured Number Average Value Number Average Value Number Average Value Number Average Value Number Average Value Number Average Value Number Average Value
LOANS ORIGINATED 17 $138,529 129 $100,822 147 $98,891 43 $42,698 3 $694,000 32 $95,688 0 $0 APPLICATIONS APPROVED, NOT ACCEPTED 2 $135,000 14 $93,571 25 $95,280 8 $34,750 0 $0 6 $98,500 1 $110,000 APPLICATIONS DENIED 1 $131,000 28 $102,536 138 $110,942 50 $43,600 0 $0 11 $62,091 1 $98,000 APPLICATIONS WITHDRAWN 1 $114,000 11 $103,818 50 $108,040 3 $58,333 0 $0 4 $183,250 0 $0 FILES CLOSED FOR INCOMPLETENESS 0 $0 7 $80,143 10 $112,000 1 $34,000 0 $0 0 $0 0 $0
Aggregated Statistics For Year 2005(Based on 1 full tract) A) FHA, FSA/RHS & VA B) Conventional C) Refinancings D) Home Improvement Loans E) Loans on Dwellings For 5+ Families F) Non-occupant Loans on Number Average Value Number Average Value Number Average Value Number Average Value Number Average Value Number Average Value
LOANS ORIGINATED 20 $120,450 135 $90,763 159 $87,616 41 $32,049 1 $3,840,000 45 $72,133 APPLICATIONS APPROVED, NOT ACCEPTED 1 $80,000 8 $84,250 31 $92,258 8 $74,500 1 $161,000 6 $82,333 APPLICATIONS DENIED 1 $154,000 21 $87,381 117 $96,222 62 $26,500 0 $0 18 $34,389 APPLICATIONS WITHDRAWN 1 $98,000 25 $106,960 68 $96,868 14 $147,286 0 $0 6 $155,667 FILES CLOSED FOR INCOMPLETENESS 0 $0 5 $75,600 22 $100,455 0 $0 0 $0 1 $170,000
Aggregated Statistics For Year 2004(Based on 1 full tract) A) FHA, FSA/RHS & VA B) Conventional C) Refinancings D) Home Improvement Loans E) Loans on Dwellings For 5+ Families F) Non-occupant Loans on Number Average Value Number Average Value Number Average Value Number Average Value Number Average Value Number Average Value
LOANS ORIGINATED 14 $100,143 109 $84,578 172 $77,122 36 $33,917 2 $1,725,000 40 $69,075 APPLICATIONS APPROVED, NOT ACCEPTED 1 $95,000 11 $75,273 45 $80,067 8 $16,250 0 $0 6 $54,667 APPLICATIONS DENIED 3 $88,667 10 $91,600 133 $113,910 51 $22,353 0 $0 12 $37,000 APPLICATIONS WITHDRAWN 0 $0 9 $93,222 94 $95,574 4 $59,500 0 $0 7 $88,857 FILES CLOSED FOR INCOMPLETENESS 1 $98,000 6 $101,500 47 $93,936 0 $0 0 $0 2 $72,000
Aggregated Statistics For Year 2003(Based on 1 full tract) A) FHA, FSA/RHS & VA B) Conventional C) Refinancings D) Home Improvement Loans E) Loans on Dwellings For 5+ Families F) Non-occupant Loans on Number Average Value Number Average Value Number Average Value Number Average Value Number Average Value Number Average Value
LOANS ORIGINATED 29 $98,241 94 $74,798 223 $77,058 22 $34,864 1 $450,000 45 $63,911 APPLICATIONS APPROVED, NOT ACCEPTED 1 $80,000 15 $88,133 56 $77,018 4 $19,750 0 $0 6 $83,167 APPLICATIONS DENIED 1 $79,000 15 $77,733 155 $85,748 29 $17,897 0 $0 18 $56,333 APPLICATIONS WITHDRAWN 6 $85,167 15 $87,400 92 $81,576 5 $19,400 0 $0 6 $63,167 FILES CLOSED FOR INCOMPLETENESS 1 $71,000 2 $86,500 17 $82,647 2 $21,500 0 $0 1 $68,000
Aggregated Statistics For Year 2002(Based on 1 full tract) A) FHA, FSA/RHS & VA B) Conventional C) Refinancings D) Home Improvement Loans F) Non-occupant Loans on Number Average Value Number Average Value Number Average Value Number Average Value Number Average Value
LOANS ORIGINATED 40 $4,150,900 70 $1,303,314 114 $69,325 18 $21,222 22 $67,364 APPLICATIONS APPROVED, NOT ACCEPTED 2 $68,000 7 $64,286 37 $64,459 9 $25,667 3 $55,333 APPLICATIONS DENIED 3 $80,333 11 $63,636 92 $72,946 17 $16,059 6 $70,000 APPLICATIONS WITHDRAWN 3 $24,796,333 7 $63,857 46 $72,478 2 $20,000 2 $83,500 FILES CLOSED FOR INCOMPLETENESS 0 $0 4 $74,750 16 $70,625 1 $5,000 0 $0
Aggregated Statistics For Year 2001(Based on 1 full tract) A) FHA, FSA/RHS & VA B) Conventional C) Refinancings D) Home Improvement Loans F) Non-occupant Loans on Number Average Value Number Average Value Number Average Value Number Average Value Number Average Value
LOANS ORIGINATED 47 $79,660 38 $73,868 108 $69,481 18 $20,056 18 $55,556 APPLICATIONS APPROVED, NOT ACCEPTED 1 $148,000 6 $61,667 33 $60,879 8 $20,250 6 $49,500 APPLICATIONS DENIED 6 $70,167 13 $91,077 77 $63,610 16 $11,125 7 $79,286 APPLICATIONS WITHDRAWN 2 $60,000 4 $71,250 43 $66,093 3 $18,000 3 $68,333 FILES CLOSED FOR INCOMPLETENESS 1 $65,000 1 $71,000 9 $84,556 0 $0 0 $0
Aggregated Statistics For Year 2000(Based on 1 full tract) A) FHA, FSA/RHS & VA B) Conventional C) Refinancings D) Home Improvement Loans F) Non-occupant Loans on Number Average Value Number Average Value Number Average Value Number Average Value Number Average Value
LOANS ORIGINATED 35 $74,943 36 $59,556 39 $45,000 34 $20,471 16 $60,625 APPLICATIONS APPROVED, NOT ACCEPTED 1 $54,000 2 $74,500 19 $51,368 10 $20,100 2 $64,500 APPLICATIONS DENIED 3 $60,000 9 $70,667 42 $43,690 20 $23,650 0 $0 APPLICATIONS WITHDRAWN 2 $66,000 3 $51,667 34 $96,735 2 $10,500 1 $90,000 FILES CLOSED FOR INCOMPLETENESS 0 $0 0 $0 6 $75,000 1 $21,000 0 $0
Aggregated Statistics For Year 1999(Based on 1 full and 1 partial tracts) A) FHA, FSA/RHS & VA B) Conventional C) Refinancings D) Home Improvement Loans F) Non-occupant Loans on Number Average Value Number Average Value Number Average Value Number Average Value Number Average Value
LOANS ORIGINATED 30 $84,227 35 $67,865 67 $59,111 32 $17,168 15 $56,615 APPLICATIONS APPROVED, NOT ACCEPTED 1 $80,760 6 $63,897 18 $59,999 10 $14,539 2 $31,260 APPLICATIONS DENIED 4 $82,200 7 $96,826 51 $60,866 22 $24,081 3 $45,273 APPLICATIONS WITHDRAWN 4 $73,068 5 $82,488 42 $56,410 8 $36,521 1 $74,030 FILES CLOSED FOR INCOMPLETENESS 0 $0 1 $123,060 12 $69,261 0 $0 0 $0
Detailed HMDA statistics for the following Tracts:
4033.00
Private Mortgage Insurance Companies Aggregated Statistics For Year 2009(Based on 1 full tract) A) Conventional B) Refinancings Number Average Value Number Average Value
LOANS ORIGINATED 5 $136,000 4 $131,250 APPLICATIONS APPROVED, NOT ACCEPTED 2 $102,000 0 $0 APPLICATIONS DENIED 1 $154,000 1 $171,000 APPLICATIONS WITHDRAWN 0 $0 2 $130,500 FILES CLOSED FOR INCOMPLETENESS 0 $0 0 $0
Aggregated Statistics For Year 2008(Based on 1 full tract) A) Conventional B) Refinancings C) Non-occupant Loans on Number Average Value Number Average Value Number Average Value
LOANS ORIGINATED 23 $134,174 8 $148,875 4 $127,750 APPLICATIONS APPROVED, NOT ACCEPTED 6 $127,000 3 $150,667 1 $185,000 APPLICATIONS DENIED 4 $91,000 0 $0 1 $113,000 APPLICATIONS WITHDRAWN 1 $124,000 0 $0 0 $0 FILES CLOSED FOR INCOMPLETENESS 0 $0 1 $144,000 0 $0
Aggregated Statistics For Year 2007(Based on 1 full tract) A) Conventional B) Refinancings C) Non-occupant Loans on Number Average Value Number Average Value Number Average Value
LOANS ORIGINATED 49 $135,510 11 $139,000 6 $100,833 APPLICATIONS APPROVED, NOT ACCEPTED 6 $117,167 2 $169,000 2 $107,000 APPLICATIONS DENIED 1 $158,000 0 $0 0 $0 APPLICATIONS WITHDRAWN 1 $139,000 1 $129,000 0 $0 FILES CLOSED FOR INCOMPLETENESS 0 $0 0 $0 0 $0
Aggregated Statistics For Year 2006(Based on 1 full tract) A) Conventional B) Refinancings C) Non-occupant Loans on Number Average Value Number Average Value Number Average Value
LOANS ORIGINATED 39 $127,205 8 $131,875 3 $122,000 APPLICATIONS APPROVED, NOT ACCEPTED 4 $83,750 2 $145,500 2 $90,500 APPLICATIONS DENIED 1 $104,000 0 $0 0 $0 APPLICATIONS WITHDRAWN 1 $67,000 0 $0 0 $0 FILES CLOSED FOR INCOMPLETENESS 0 $0 0 $0 0 $0
Aggregated Statistics For Year 2005(Based on 1 full tract) A) Conventional B) Refinancings C) Non-occupant Loans on Number Average Value Number Average Value Number Average Value
LOANS ORIGINATED 37 $104,946 7 $114,286 11 $83,091 APPLICATIONS APPROVED, NOT ACCEPTED 4 $94,750 1 $105,000 1 $95,000 APPLICATIONS DENIED 0 $0 0 $0 0 $0 APPLICATIONS WITHDRAWN 2 $85,000 0 $0 2 $85,000 FILES CLOSED FOR INCOMPLETENESS 0 $0 0 $0 0 $0
Aggregated Statistics For Year 2004(Based on 1 full tract) A) Conventional B) Refinancings C) Non-occupant Loans on Number Average Value Number Average Value Number Average Value
LOANS ORIGINATED 43 $92,279 10 $82,100 8 $64,750 APPLICATIONS APPROVED, NOT ACCEPTED 6 $83,167 2 $73,500 0 $0 APPLICATIONS DENIED 0 $0 0 $0 0 $0 APPLICATIONS WITHDRAWN 1 $86,000 2 $84,500 1 $81,000 FILES CLOSED FOR INCOMPLETENESS 1 $100,000 0 $0 0 $0
Aggregated Statistics For Year 2003(Based on 1 full tract) A) Conventional B) Refinancings C) Non-occupant Loans on Number Average Value Number Average Value Number Average Value
LOANS ORIGINATED 42 $90,595 25 $92,160 6 $58,333 APPLICATIONS APPROVED, NOT ACCEPTED 6 $85,667 9 $79,111 2 $127,000 APPLICATIONS DENIED 1 $89,000 0 $0 0 $0 APPLICATIONS WITHDRAWN 2 $50,000 2 $84,500 0 $0 FILES CLOSED FOR INCOMPLETENESS 1 $50,000 0 $0 0 $0
Aggregated Statistics For Year 2002(Based on 1 full tract) A) Conventional B) Refinancings C) Non-occupant Loans on Number Average Value Number Average Value Number Average Value
LOANS ORIGINATED 45 $76,533 3 $79,333 5 $71,400 APPLICATIONS APPROVED, NOT ACCEPTED 7 $66,000 1 $90,000 3 $49,333 APPLICATIONS DENIED 3 $77,333 0 $0 0 $0 APPLICATIONS WITHDRAWN 1 $95,000 3 $80,667 0 $0 FILES CLOSED FOR INCOMPLETENESS 0 $0 0 $0 0 $0
Aggregated Statistics For Year 2001(Based on 1 full tract) A) Conventional B) Refinancings C) Non-occupant Loans on Number Average Value Number Average Value Number Average Value
LOANS ORIGINATED 14 $82,143 8 $77,375 2 $113,000 APPLICATIONS APPROVED, NOT ACCEPTED 2 $56,000 4 $71,000 2 $63,500 APPLICATIONS DENIED 1 $74,000 0 $0 0 $0 APPLICATIONS WITHDRAWN 0 $0 0 $0 0 $0 FILES CLOSED FOR INCOMPLETENESS 0 $0 0 $0 0 $0
Aggregated Statistics For Year 2000(Based on 1 full tract) A) Conventional B) Refinancings C) Non-occupant Loans on Number Average Value Number Average Value Number Average Value
LOANS ORIGINATED 11 $61,182 0 $0 3 $51,000 APPLICATIONS APPROVED, NOT ACCEPTED 1 $63,000 1 $89,000 1 $63,000 APPLICATIONS DENIED 1 $68,000 1 $104,000 0 $0 APPLICATIONS WITHDRAWN 0 $0 0 $0 0 $0 FILES CLOSED FOR INCOMPLETENESS 0 $0 0 $0 0 $0
Aggregated Statistics For Year 1999(Based on 1 full and 1 partial tracts) A) Conventional B) Refinancings C) Non-occupant Loans on Number Average Value Number Average Value Number Average Value
LOANS ORIGINATED 10 $67,389 12 $78,134 5 $58,142 APPLICATIONS APPROVED, NOT ACCEPTED 2 $57,485 1 $81,380 0 $0 APPLICATIONS DENIED 0 $0 0 $0 0 $0 APPLICATIONS WITHDRAWN 0 $0 0 $0 0 $0 FILES CLOSED FOR INCOMPLETENESS 0 $0 1 $61,530 0 $0
Detailed PMIC statistics for the following Tracts:
4033.00
Clifton Heights compared to Pennsylvania state average:
Unemployed percentage significantly below state average. Black race population percentage significantly above state average. Hispanic race population percentage significantly below state average. Median age below state average. Percentage of population with a bachelor's degree or higher below state average. Clifton Heights on our top lists :
#5 on the list of "Top 101 cities with the most residents born in Other Northern Africa (population 500+)"
#12 on the list of "Top 101 cities with largest percentage of males in industries: information (population 5,000+)"
#22 on the list of "Top 101 cities with largest percentage of males in industries: retail trade (population 5,000+)"
#26 on the list of "Top 101 cities with the most residents born in Costa Rica (population 500+)"
#32 on the list of "Top 101 cities with largest percentage of females in occupations: community and social service occupations (population 5,000+)"
#35 on the list of "Top 101 cities with the most people taking a bus, a trolley bus, a streetcar, or a trolley car to work (population 5,000+)"
#35 on the list of "Top 101 cities with the most people taking subway or elevated to work (population 5,000+)"
#41 on the list of "Top 101 cities with the largest positive percentage difference between never married females and males (15+ years) (with at least 1,000 females never married)"
#74 on the list of "Top 101 cities with largest percentage of males in industries: other services, except public administration (population 5,000+)"
#81 on the list of "Top 101 cities with the most residents born in Northern Africa (population 500+)"
#84 on the list of "Top 101 cities with the smallest percentage of one, detached housing units in structures (2,000+ housing units)"
#30 (19018) on the list of "Top 101 zip codes with the largest percentage of Irish first ancestries (pop 5,000+)"
#14 on the list of "Top 101 counties with the lowest ground withdrawal of fresh water for public supply (pop. 50,000+)"
#16 on the list of "Top 101 counties with the largest increase in the number of infant deaths per 1000 residents 2000-2006 to 2007-2013 (pop. 50,000+)"
#20 on the list of "Top 101 counties with the highest Particulate Matter (PM2.5 ) Annual air pollution readings in 2012 (µg/m3 )"
#40 on the list of "Top 101 counties with the most Mainline Protestant congregations"
#46 on the list of "Top 101 counties with the highest number of infant deaths per 1000 residents 2007-2013 (pop. 50,000+)"
Top Patent Applicants
Keith A. Santeler (2)
Leonard Villarose, Jr. (1)
Michael D. Collini (1)
Suparna Paul (1)
Andrew Ross (1)
Connor R. Bilchak (1)
Kevin Durkin (1)
Total of 8 patent applications in 2008-2024.


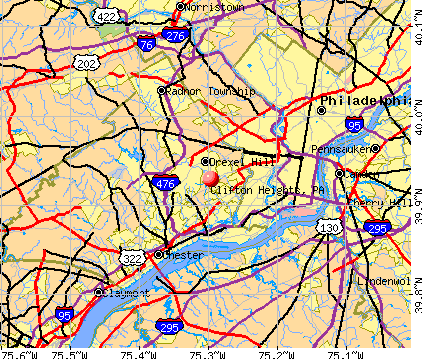


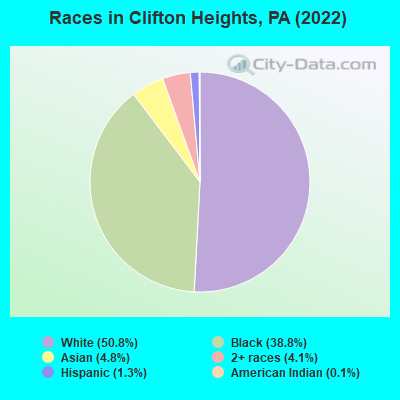
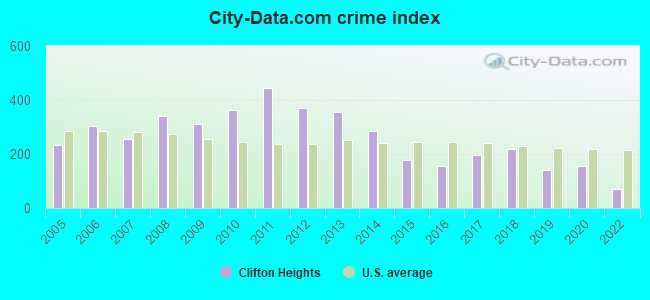
 Recent articles from our blog. Our writers, many of them Ph.D. graduates or candidates, create easy-to-read articles on a wide variety of topics.
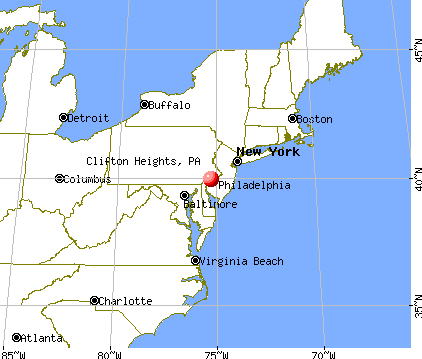
 (9.3 miles
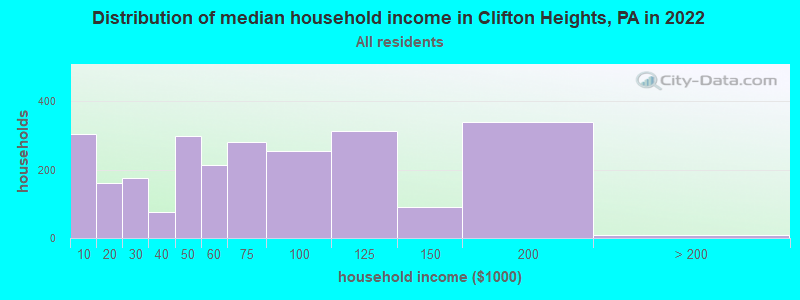
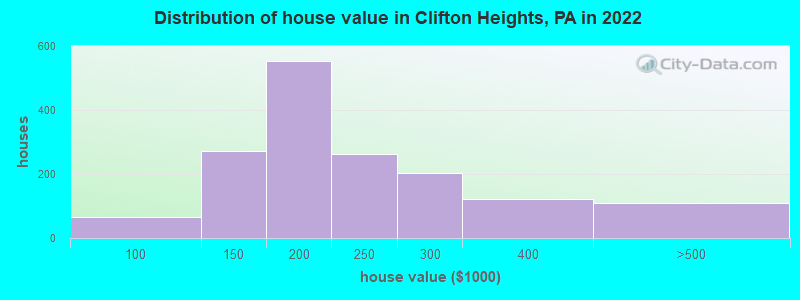
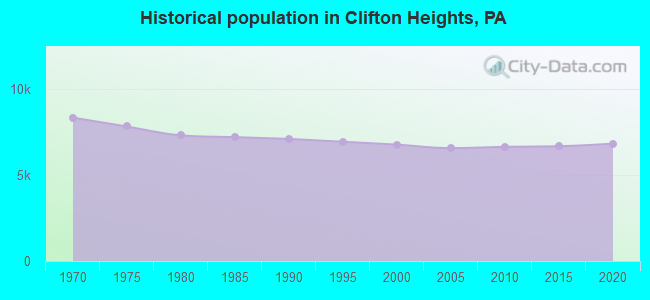
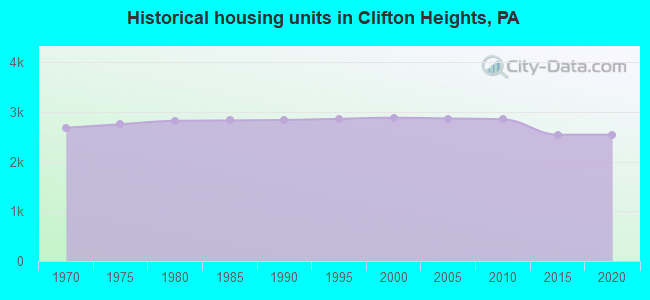
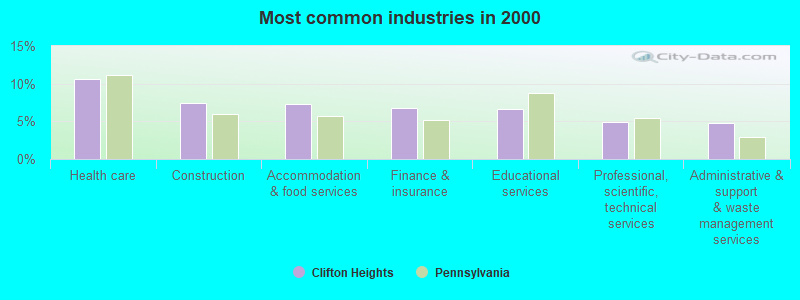
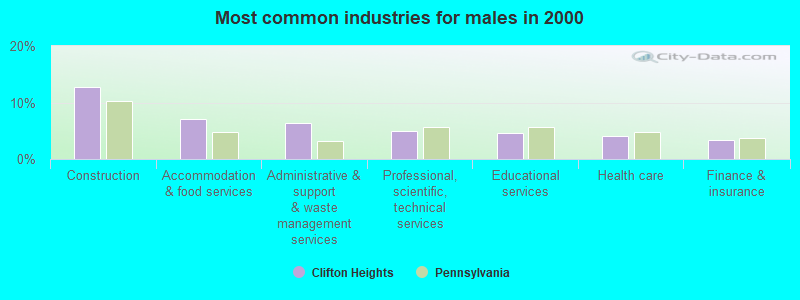
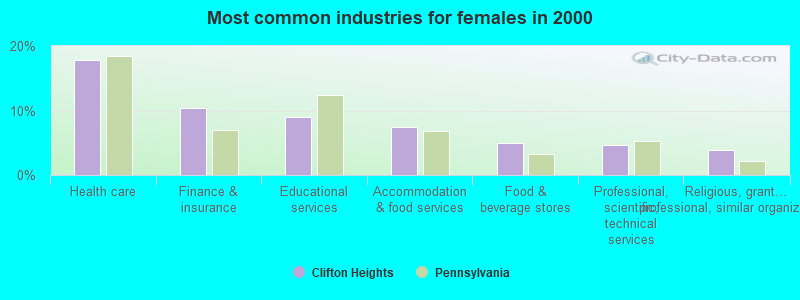
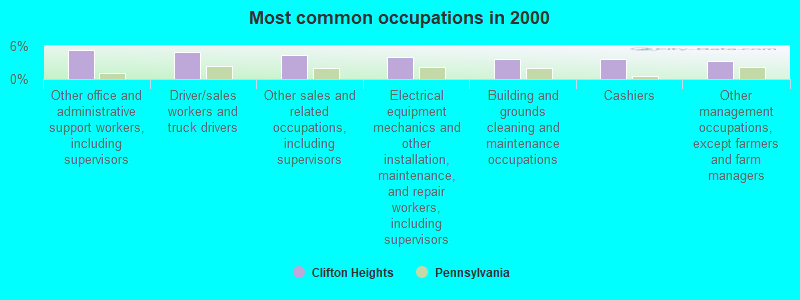
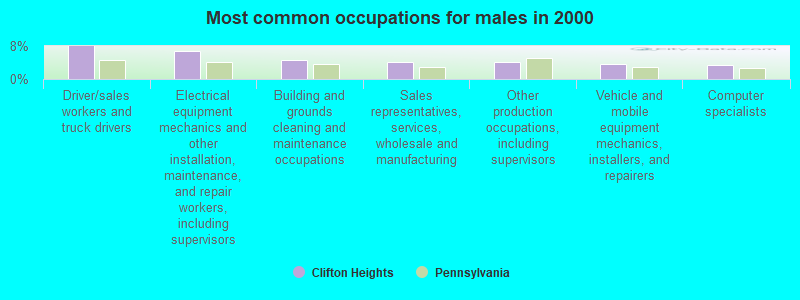
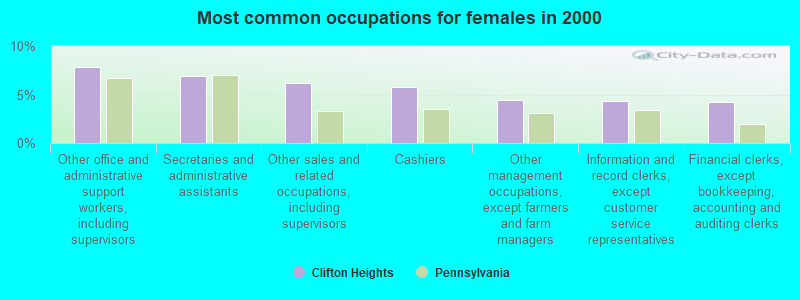


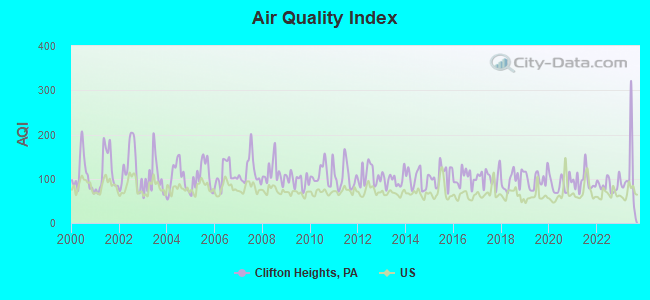
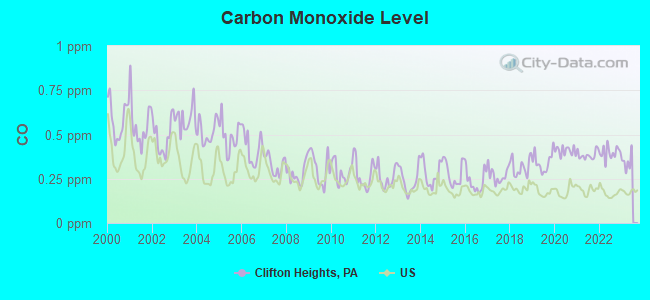
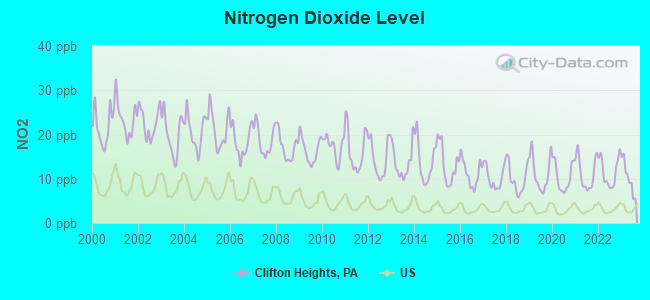
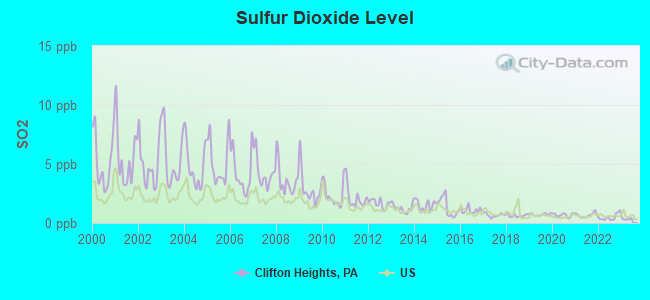
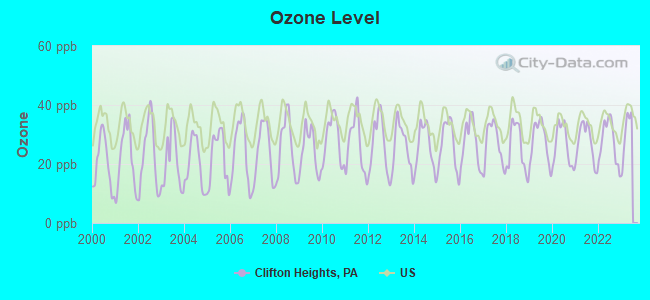
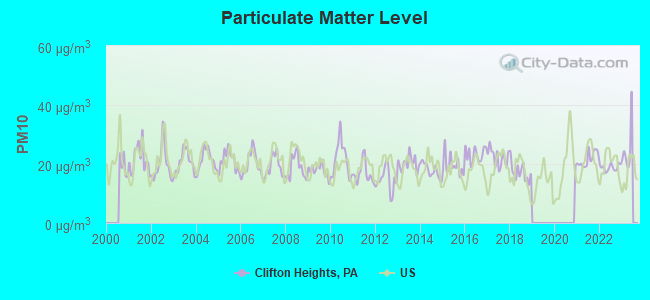
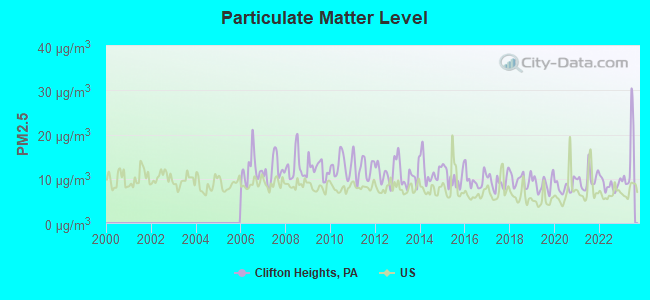
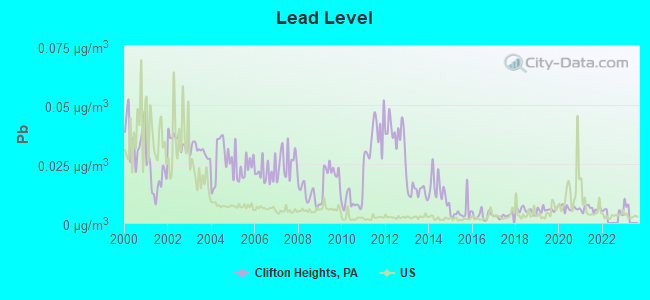
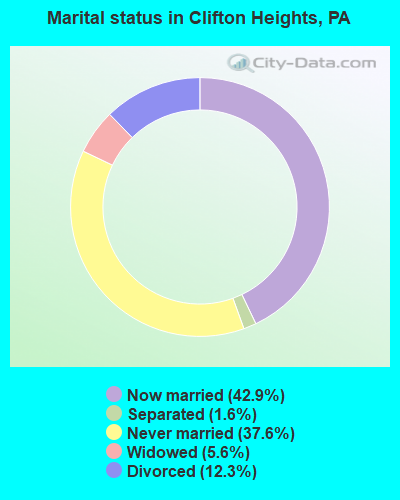
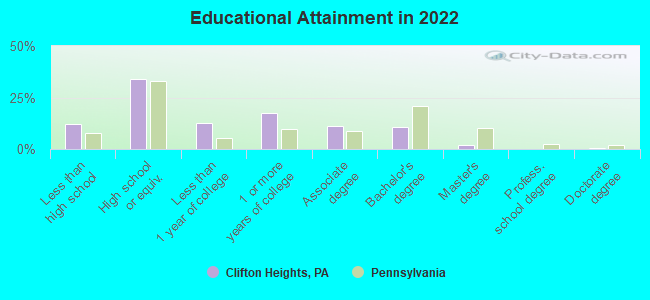
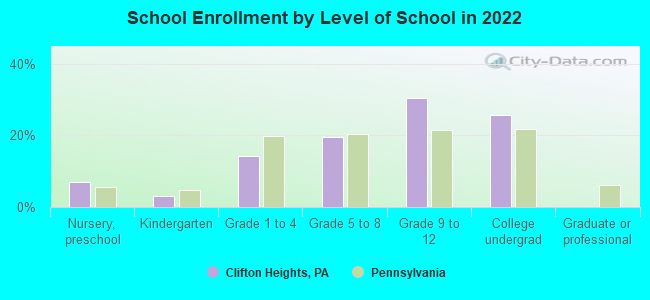
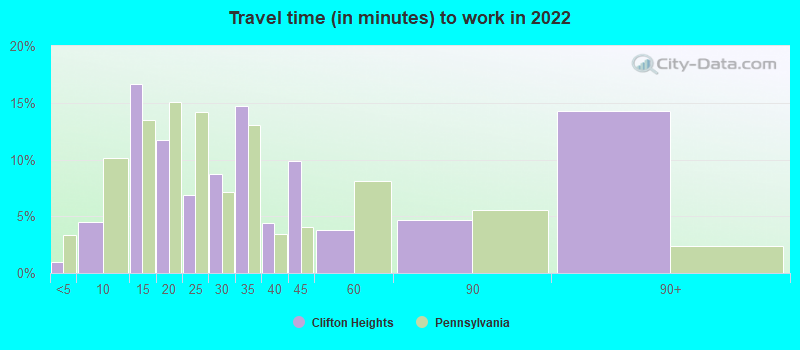
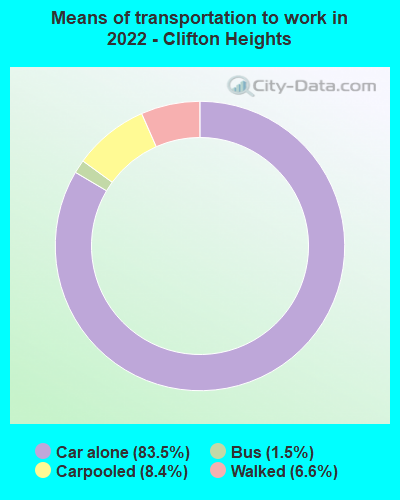
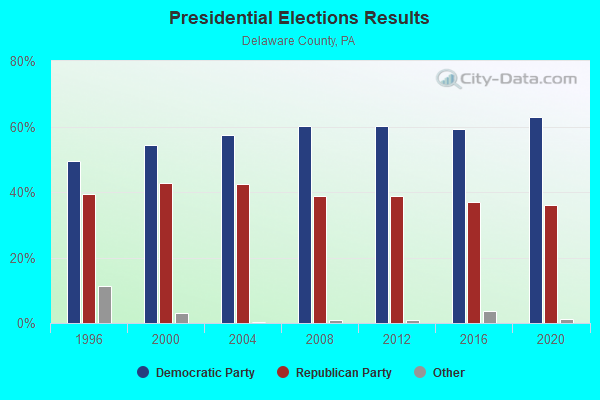
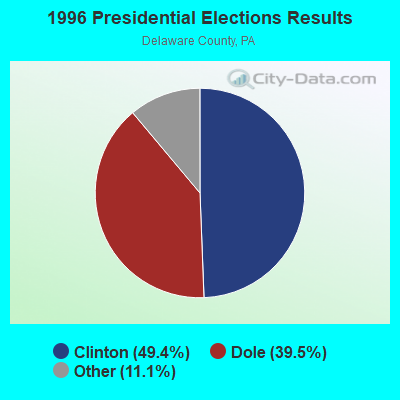
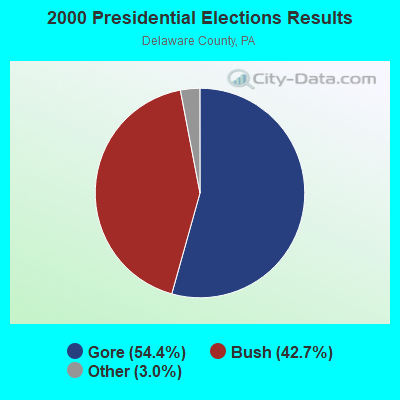
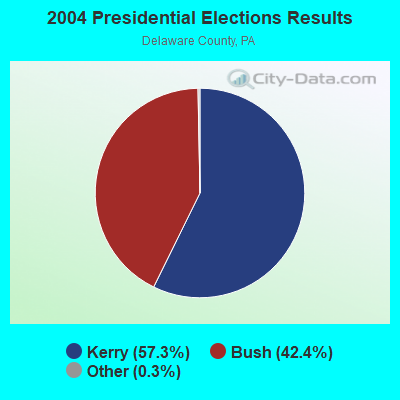
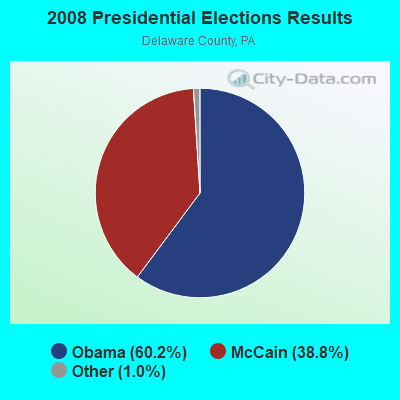
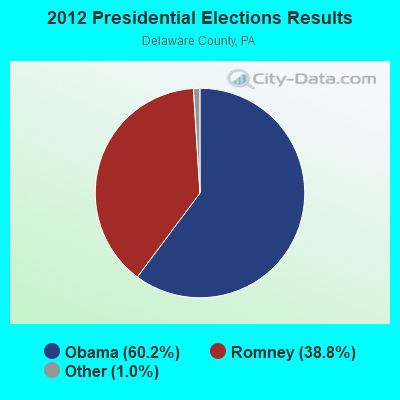
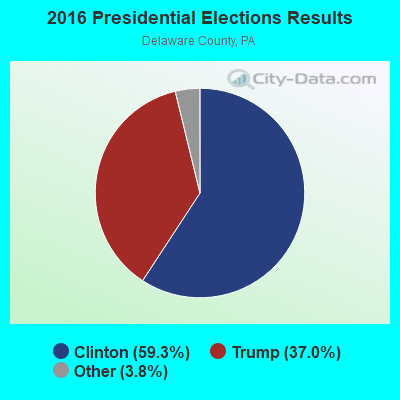
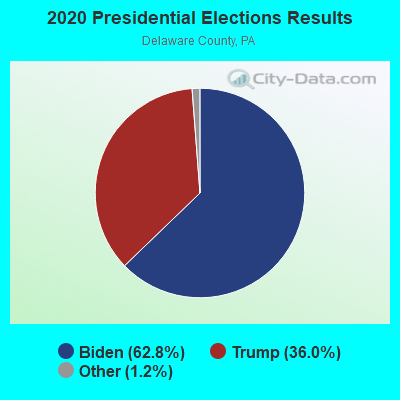
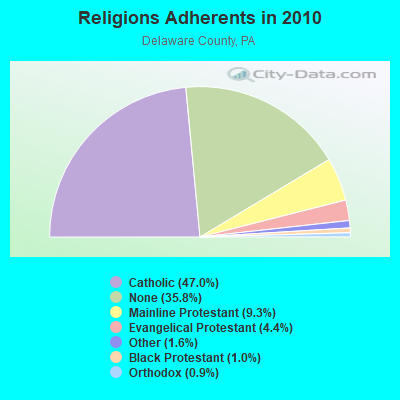
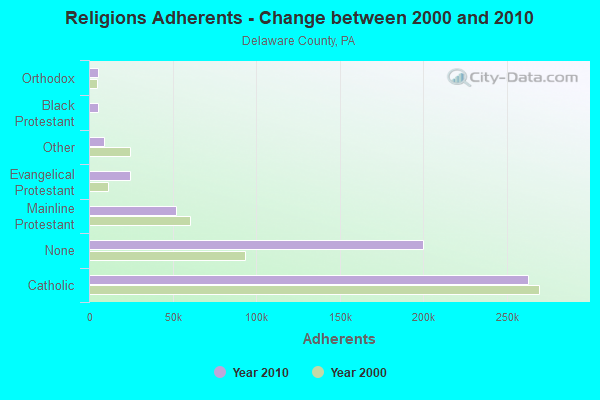
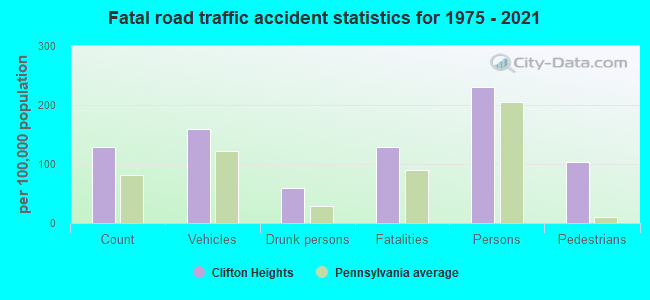
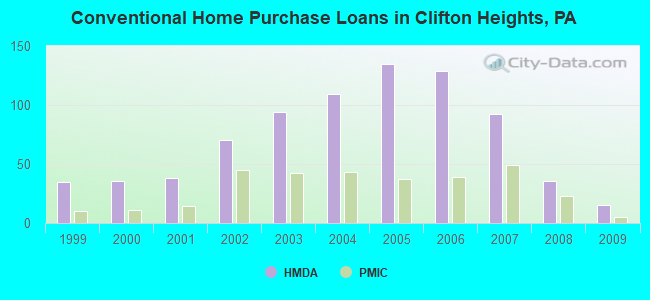
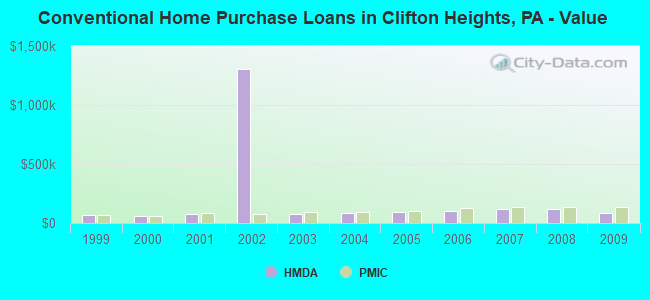
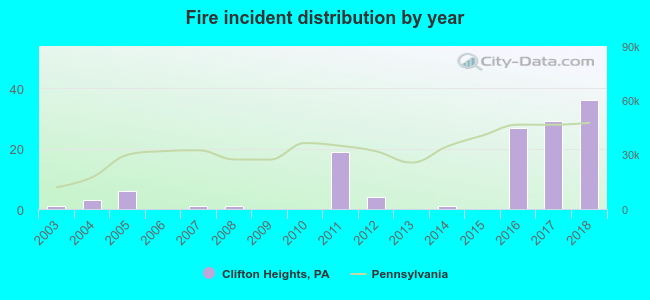 According to the data from the years 2003 - 2018 the average number of fire incidents per year is 8. The highest number of fires - 36 took place in 2018, and the least - 0 in 2006. The data has a growing trend.
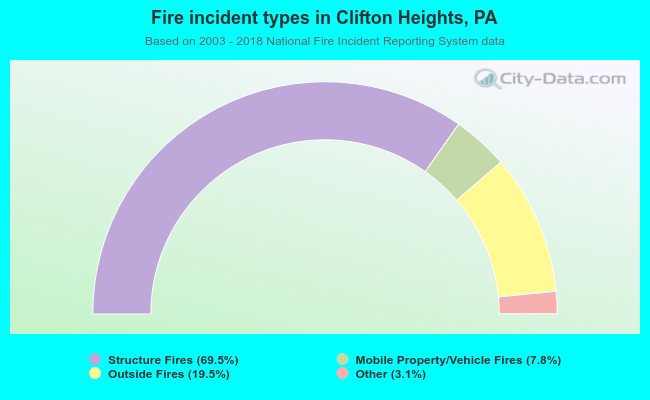 When looking into fire subcategories, the most reports belonged to: Structure Fires (69.5%), and Outside Fires (19.5%).