Fatal car crashes and road traffic accidents in Porterville, California
- Fatal car crash and road traffic accident statistics for 2021
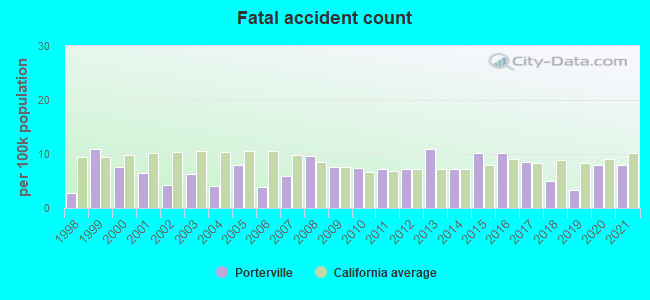
- Fatal accident count5
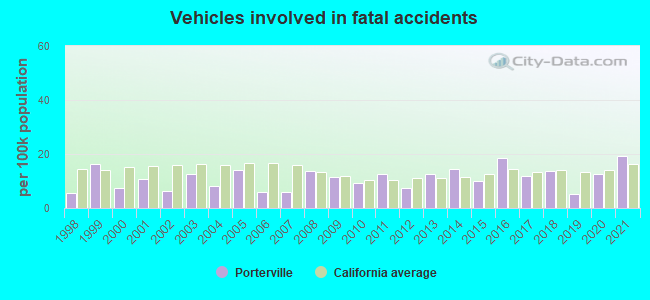
- Vehicles involved in fatal accidents12
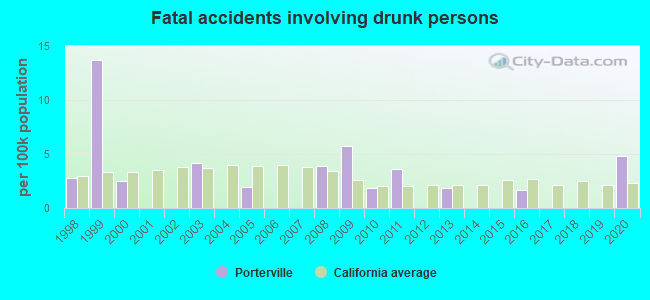
- Fatal accidents involving drunk persons0
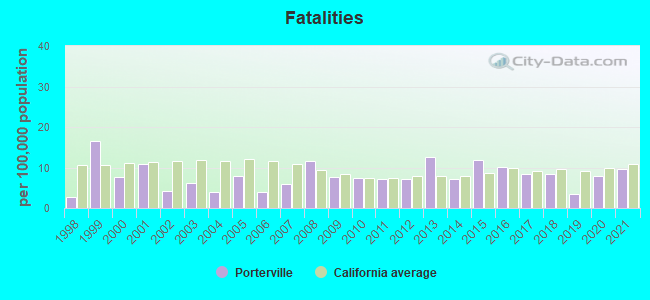
- Fatalities6
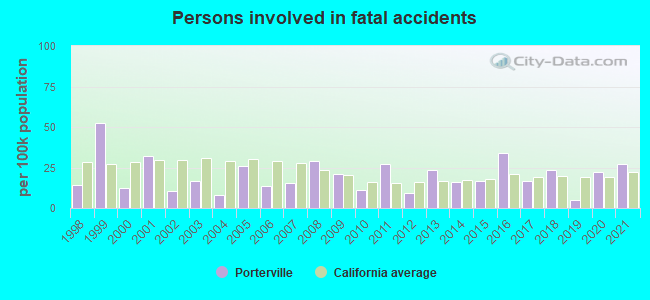
- Persons involved in fatal accidents17
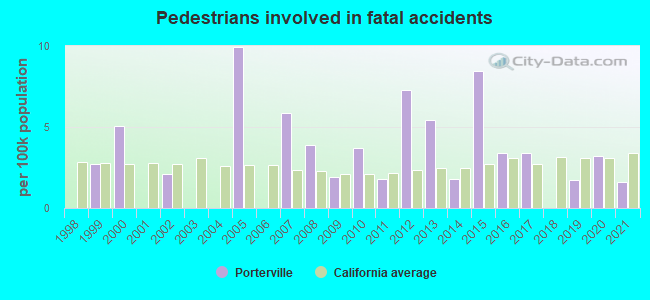
- Pedestrians involved in fatal accidents1
- Fatal car crash and road traffic accident statistics for 2020
- Fatal accident count5
- Vehicles involved in fatal accidents8
- Fatal accidents involving drunk persons3
- Fatalities5
- Persons involved in fatal accidents14
- Pedestrians involved in fatal accidents2
- Fatal car crash and road traffic accident statistics for 2019
- Fatal accident count2
- Vehicles involved in fatal accidents3
- Fatal accidents involving drunk persons0
- Fatalities2
- Persons involved in fatal accidents3
- Pedestrians involved in fatal accidents1
- Fatal car crash and road traffic accident statistics for 2018
- Fatal accident count3
- Vehicles involved in fatal accidents8
- Fatal accidents involving drunk persons0
- Fatalities5
- Persons involved in fatal accidents14
- Pedestrians involved in fatal accidents0
Data:
Latest news about accidents in Porterville, CA collected exclusively by city-data.com from local newspapers, TV, and radio stations
No street view available for this location
Porterville fatal accident statistics for 1998 - 2021
Daylight
- Porterville(Based on 160 reports) 40.6%
- Tulare County(Based on 3,631 reports) 46.5%
- California(Based on 177,072 reports) 43.9%
Dark - Lighted
- Porterville(Based on 160 reports) 30.0%
- Tulare County(Based on 3,631 reports) 11.7%
- California(Based on 177,072 reports) 25.4%
Dark - Not Lighted
- Porterville(Based on 160 reports) 25.6%
- Tulare County(Based on 3,631 reports) 37.3%
- California(Based on 177,072 reports) 26.6%
Dawn
- Porterville(Based on 160 reports) 1.9%
- Tulare County(Based on 3,631 reports) 1.9%
- California(Based on 177,072 reports) 1.6%
Dusk
- Porterville(Based on 160 reports) 1.3%
- Tulare County(Based on 3,631 reports) 2.1%
- California(Based on 177,072 reports) 2.1%
Dark - Unknown Lighting
- Porterville(Based on 160 reports) 0.6%
- Tulare County(Based on 3,631 reports) 0.5%
- California(Based on 177,072 reports) 0.5%
Clear
- Porterville(Based on 160 reports) 93.8%
- Tulare County(Based on 3,631 reports) 91.9%
- California(Based on 177,248 reports) 91.0%
Rain
- Porterville(Based on 160 reports) 4.4%
- Tulare County(Based on 3,631 reports) 3.0%
- California(Based on 177,248 reports) 4.8%
Fog, Smog, Smoke
- Porterville(Based on 160 reports) 1.3%
- Tulare County(Based on 3,631 reports) 2.6%
- California(Based on 177,248 reports) 1.1%
Unknown
- Porterville(Based on 160 reports) 0.6%
- Tulare County(Based on 3,631 reports) 2.1%
- California(Based on 177,248 reports) 2.6%

Porterville fatal car crash and road traffic accident list for 2021
- Fatal accident count5
- Vehicles involved in fatal accidents12
- Fatalities6
- Persons involved in fatal accidents17
- Pedestrians involved in fatal accidents1
Daylight
- Porterville(Based on 5 reports) 40.0%
- Tulare County(Based on 81 reports) 44.4%
- California(Based on 3,972 reports) 36.7%
Dark - Not Lighted
- Porterville(Based on 5 reports) 40.0%
- Tulare County(Based on 81 reports) 37.0%
- California(Based on 3,972 reports) 27.4%
Dark - Lighted
- Porterville(Based on 5 reports) 20.0%
- Tulare County(Based on 81 reports) 17.3%
- California(Based on 3,972 reports) 31.4%
Clear
- Porterville(Based on 5 reports) 100.0%
- Tulare County(Based on 81 reports) 91.4%
- California(Based on 3,951 reports) 86.2%
Porterville fatal car crash and road traffic accident list for 2020
- Fatal accident count5
- Vehicles involved in fatal accidents8
- Fatal accidents involving drunk persons3
- Fatalities5
- Persons involved in fatal accidents14
- Pedestrians involved in fatal accidents2
Dark - Not Lighted
- Porterville(Based on 5 reports) 60.0%
- Tulare County(Based on 74 reports) 33.8%
- California(Based on 3,555 reports) 24.8%
Dusk
- Porterville(Based on 5 reports) 20.0%
- Tulare County(Based on 74 reports) 6.8%
- California(Based on 3,555 reports) 2.8%
Dark - Lighted
- Porterville(Based on 5 reports) 20.0%
- Tulare County(Based on 74 reports) 20.3%
- California(Based on 3,555 reports) 31.5%
Clear
- Porterville(Based on 5 reports) 100.0%
- Tulare County(Based on 74 reports) 87.8%
- California(Based on 3,547 reports) 87.8%
| # | Date | Location | Vehicles | Drunk persons | Fatalites | Persons | Pedestrians |
|---|
| 1 | Mar 1, 2020 06:47 PM | Sr-190, Martin St | 2 | - | 1
| 4 | - |
| 2 | Jan 10, 2020 10:49 PM | Main St, Gibbons Av | 2 | 1
| 1 | 4 | - |
| 3 | May 5, 2020 06:55 PM | Olive Ave, Westwood St | 1 | 1
| 1 | 1 | 1 |
| 4 | Oct 16, 2020 10:38 PM | Cr-West Olive Ave, Cr-North Newcomb St | 1 | - | 1
| 1 | 1 |
| 5 | Nov 14, 2020 06:38 PM | Main St, Date Ave | 2 | 1
| 1 | 4 | - |
Porterville fatal car crash and road traffic accident list for 2019
Porterville fatal car crash and road traffic accident list for 2018
Porterville fatal car crash and road traffic accident list for 2017
- Fatal accident count5
- Vehicles involved in fatal accidents7
- Fatalities5
- Persons involved in fatal accidents10
- Pedestrians involved in fatal accidents2
Daylight
- Porterville(Based on 5 reports) 60.0%
- Tulare County(Based on 76 reports) 50.0%
- California(Based on 3,300 reports) 40.9%
Dark - Not Lighted
- Porterville(Based on 5 reports) 40.0%
- Tulare County(Based on 76 reports) 26.3%
- California(Based on 3,300 reports) 25.4%
Clear
- Porterville(Based on 5 reports) 100.0%
- Tulare County(Based on 76 reports) 86.8%
- California(Based on 3,301 reports) 83.8%
Porterville fatal car crash and road traffic accident list for 2016
- Fatal accident count6
- Vehicles involved in fatal accidents11
- Fatal accidents involving drunk persons1
- Fatalities6
- Persons involved in fatal accidents20
- Pedestrians involved in fatal accidents2
Daylight
- Porterville(Based on 6 reports) 50.0%
- Tulare County(Based on 74 reports) 47.3%
- California(Based on 3,535 reports) 40.5%
Dark - Lighted
- Porterville(Based on 6 reports) 33.3%
- Tulare County(Based on 74 reports) 18.9%
- California(Based on 3,535 reports) 31.1%
Dark - Not Lighted
- Porterville(Based on 6 reports) 16.7%
- Tulare County(Based on 74 reports) 28.4%
- California(Based on 3,535 reports) 23.4%
Clear
- Porterville(Based on 6 reports) 100.0%
- Tulare County(Based on 74 reports) 86.5%
- California(Based on 3,533 reports) 82.3%
Porterville fatal car crash and road traffic accident list for 2015
- Fatal accident count6
- Vehicles involved in fatal accidents6
- Fatalities7
- Persons involved in fatal accidents10
- Pedestrians involved in fatal accidents5
Dark - Lighted
- Porterville(Based on 6 reports) 50.0%
- Tulare County(Based on 67 reports) 26.9%
- California(Based on 3,118 reports) 29.8%
Daylight
- Porterville(Based on 6 reports) 33.3%
- Tulare County(Based on 67 reports) 37.3%
- California(Based on 3,118 reports) 41.2%
Dark - Unknown Lighting
- Porterville(Based on 6 reports) 16.7%
- Tulare County(Based on 67 reports) 1.5%
- California(Based on 3,118 reports) 0.5%
Clear
- Porterville(Based on 6 reports) 100.0%
- Tulare County(Based on 67 reports) 83.6%
- California(Based on 3,114 reports) 84.9%
Porterville fatal car crash and road traffic accident list for 2014
- Fatal accident count4
- Vehicles involved in fatal accidents8
- Fatalities4
- Persons involved in fatal accidents9
- Pedestrians involved in fatal accidents1
Daylight
- Porterville(Based on 4 reports) 50.0%
- Tulare County(Based on 54 reports) 42.6%
- California(Based on 2,819 reports) 42.9%
Dark - Lighted
- Porterville(Based on 4 reports) 25.0%
- Tulare County(Based on 54 reports) 14.8%
- California(Based on 2,819 reports) 29.9%
Dawn
- Porterville(Based on 4 reports) 25.0%
- Tulare County(Based on 54 reports) 11.1%
- California(Based on 2,819 reports) 2.1%
Clear
- Porterville(Based on 4 reports) 100.0%
- Tulare County(Based on 54 reports) 94.4%
- California(Based on 2,819 reports) 84.2%
Porterville fatal car crash and road traffic accident list for 2013
- Fatal accident count6
- Vehicles involved in fatal accidents7
- Fatal accidents involving drunk persons1
- Fatalities7
- Persons involved in fatal accidents13
- Pedestrians involved in fatal accidents3
Daylight
- Porterville(Based on 6 reports) 33.3%
- Tulare County(Based on 49 reports) 42.9%
- California(Based on 2,765 reports) 44.7%
Dark - Lighted
- Porterville(Based on 6 reports) 33.3%
- Tulare County(Based on 49 reports) 10.2%
- California(Based on 2,765 reports) 26.6%
Dark - Not Lighted
- Porterville(Based on 6 reports) 16.7%
- Tulare County(Based on 49 reports) 42.9%
- California(Based on 2,765 reports) 24.0%
Dawn
- Porterville(Based on 6 reports) 16.7%
- Tulare County(Based on 49 reports) 4.1%
- California(Based on 2,765 reports) 2.1%
Clear
- Porterville(Based on 6 reports) 83.3%
- Tulare County(Based on 49 reports) 91.8%
- California(Based on 2,760 reports) 88.1%
Fog, Smog, Smoke
- Porterville(Based on 6 reports) 16.7%
- Tulare County(Based on 49 reports) 6.1%
- California(Based on 2,760 reports) 0.9%
Porterville fatal car crash and road traffic accident list for 2012
- Fatal accident count4
- Vehicles involved in fatal accidents4
- Fatalities4
- Persons involved in fatal accidents5
- Pedestrians involved in fatal accidents4
Daylight
- Porterville(Based on 4 reports) 50.0%
- Tulare County(Based on 61 reports) 50.8%
- California(Based on 2,727 reports) 44.2%
Dark - Not Lighted
- Porterville(Based on 4 reports) 25.0%
- Tulare County(Based on 61 reports) 34.4%
- California(Based on 2,727 reports) 23.8%
Dark - Lighted
- Porterville(Based on 4 reports) 25.0%
- Tulare County(Based on 61 reports) 11.5%
- California(Based on 2,727 reports) 27.5%
Clear
- Porterville(Based on 4 reports) 100.0%
- Tulare County(Based on 61 reports) 85.2%
- California(Based on 2,728 reports) 82.3%
Porterville fatal car crash and road traffic accident list for 2011
- Fatal accident count4
- Vehicles involved in fatal accidents7
- Fatal accidents involving drunk persons2
- Fatalities4
- Persons involved in fatal accidents15
- Pedestrians involved in fatal accidents1
Dark - Lighted
- Porterville(Based on 4 reports) 50.0%
- Tulare County(Based on 52 reports) 15.4%
- California(Based on 2,591 reports) 28.1%
Daylight
- Porterville(Based on 4 reports) 25.0%
- Tulare County(Based on 52 reports) 50.0%
- California(Based on 2,591 reports) 45.3%
Dark - Not Lighted
- Porterville(Based on 4 reports) 25.0%
- Tulare County(Based on 52 reports) 34.6%
- California(Based on 2,591 reports) 22.3%
Clear
- Porterville(Based on 4 reports) 100.0%
- Tulare County(Based on 52 reports) 84.6%
- California(Based on 2,581 reports) 81.3%
Porterville fatal car crash and road traffic accident list for 2010
- Fatal accident count4
- Vehicles involved in fatal accidents5
- Fatal accidents involving drunk persons1
- Fatalities4
- Persons involved in fatal accidents6
- Pedestrians involved in fatal accidents2
Daylight
- Porterville(Based on 4 reports) 50.0%
- Tulare County(Based on 65 reports) 32.3%
- California(Based on 2,501 reports) 42.5%
Dark - Lighted
- Porterville(Based on 4 reports) 50.0%
- Tulare County(Based on 65 reports) 24.6%
- California(Based on 2,501 reports) 28.1%
Clear
- Porterville(Based on 4 reports) 75.0%
- Tulare County(Based on 65 reports) 83.1%
- California(Based on 2,495 reports) 77.2%
Unknown
- Porterville(Based on 4 reports) 25.0%
- Tulare County(Based on 65 reports) 15.4%
- California(Based on 2,495 reports) 16.6%
Porterville fatal car crash and road traffic accident list for 2009
- Fatal accident count4
- Vehicles involved in fatal accidents6
- Fatal accidents involving drunk persons3
- Fatalities4
- Persons involved in fatal accidents11
- Pedestrians involved in fatal accidents1
Dark - Lighted
- Porterville(Based on 4 reports) 75.0%
- Tulare County(Based on 62 reports) 14.5%
- California(Based on 2,811 reports) 26.0%
Dark - Not Lighted
- Porterville(Based on 4 reports) 25.0%
- Tulare County(Based on 62 reports) 35.5%
- California(Based on 2,811 reports) 24.1%
Clear
- Porterville(Based on 4 reports) 100.0%
- Tulare County(Based on 62 reports) 100.0%
- California(Based on 2,816 reports) 94.7%
Porterville fatal car crash and road traffic accident list for 2008
- Fatal accident count5
- Vehicles involved in fatal accidents7
- Fatal accidents involving drunk persons2
- Fatalities6
- Persons involved in fatal accidents15
- Pedestrians involved in fatal accidents2
Dark - Lighted
- Porterville(Based on 5 reports) 60.0%
- Tulare County(Based on 68 reports) 16.2%
- California(Based on 3,141 reports) 25.0%
Daylight
- Porterville(Based on 5 reports) 40.0%
- Tulare County(Based on 68 reports) 50.0%
- California(Based on 3,141 reports) 45.7%
Clear
- Porterville(Based on 5 reports) 100.0%
- Tulare County(Based on 68 reports) 92.6%
- California(Based on 3,145 reports) 94.2%
Porterville fatal car crash and road traffic accident list for 2007
Porterville fatal car crash and road traffic accident list for 2006
| # | Date | Location | Vehicles | Drunk persons | Fatalites | Persons | Pedestrians |
|---|
| 1 | Jan 31, 2006 01:10 AM | Main St | 2 | - | 1
| 3 | - |
| 2 | May 12, 2006 02:20 PM | Sr-190 | 1 | - | 1
| 4 | - |
Porterville fatal car crash and road traffic accident list for 2005
- Fatal accident count4
- Vehicles involved in fatal accidents7
- Fatal accidents involving drunk persons1
- Fatalities4
- Persons involved in fatal accidents13
- Pedestrians involved in fatal accidents5
Dark - Lighted
- Porterville(Based on 4 reports) 50.0%
- Tulare County(Based on 96 reports) 13.5%
- California(Based on 3,842 reports) 24.4%
Daylight
- Porterville(Based on 4 reports) 25.0%
- Tulare County(Based on 96 reports) 51.0%
- California(Based on 3,842 reports) 46.3%
Dark - Not Lighted
- Porterville(Based on 4 reports) 25.0%
- Tulare County(Based on 96 reports) 31.3%
- California(Based on 3,842 reports) 25.3%
Clear
- Porterville(Based on 4 reports) 75.0%
- Tulare County(Based on 96 reports) 87.5%
- California(Based on 3,849 reports) 92.3%
Rain
- Porterville(Based on 4 reports) 25.0%
- Tulare County(Based on 96 reports) 8.3%
- California(Based on 3,849 reports) 5.8%
| # | Date | Location | Vehicles | Drunk persons | Fatalites | Persons | Pedestrians |
|---|
| 1 | Apr 8, 2005 07:50 PM | Sr-65 | 2 | - | 1
| 4 | - |
| 2 | Aug 3, 2005 05:30 PM | Sr-65 Ramp | 3 | 1
| 1 | 5 | 4 |
| 3 | Oct 1, 2005 07:30 PM | Sr-65 | 1 | - | 1
| 2 | 1 |
| 4 | Oct 6, 2005 09:07 PM | Main St | 1 | - | 1
| 2 | - |
Porterville fatal car crash and road traffic accident list for 2004
| # | Date | Location | Vehicles | Drunk persons | Fatalites | Persons | Pedestrians |
|---|
| 1 | Apr 13, 2004 06:08 AM | Henderson Ave, Westwood St | 2 | - | 1
| 2 | - |
| 2 | Jun 27, 2004 10:39 AM | Orange Belt Dr | 2 | - | 1
| 2 | - |
Porterville fatal car crash and road traffic accident list for 2003
| # | Date | Location | Vehicles | Drunk persons | Fatalites | Persons | Pedestrians |
|---|
| 1 | Mar 28, 2003 09:49 PM | Sr-190 | 2 | 1
| 1 | 2 | - |
| 2 | Apr 1, 2003 09:45 AM | Sr-190 | 3 | - | 1
| 4 | - |
| 3 | May 29, 2003 01:52 AM | Sr-190 | 1 | 1
| 1 | 2 | - |
Porterville fatal car crash and road traffic accident list for 2002
| # | Date | Location | Vehicles | Drunk persons | Fatalites | Persons | Pedestrians |
|---|
| 1 | Feb 2, 2002 11:54 PM | Olive Ave | 1 | - | 1
| 2 | 1 |
| 2 | Jun 9, 2002 11:23 PM | Morton Ave | 2 | - | 1
| 3 | - |
Porterville fatal car crash and road traffic accident list for 2001
| # | Date | Location | Vehicles | Drunk persons | Fatalites | Persons | Pedestrians |
|---|
| 1 | Mar 1, 2001 03:07 PM | Morton Ave | 2 | - | 3
| 7 | - |
| 2 | Aug 15, 2001 02:00 PM | Sr-65 | 1 | - | 1
| 6 | - |
| 3 | Oct 30, 2001 02:45 PM | Sr-190 | 2 | - | 1
| 2 | - |
Porterville fatal car crash and road traffic accident list for 2000
| # | Date | Location | Vehicles | Drunk persons | Fatalites | Persons | Pedestrians |
|---|
| 1 | Mar 21, 2000 07:00 PM | Main Street | 1 | - | 1
| 2 | 1 |
| 2 | Apr 28, 2000 04:40 AM | Sr-190 | 1 | - | 1
| 2 | 1 |
| 3 | Dec 13, 2000 07:58 PM | Sr-65 | 1 | 1
| 1 | 1 | - |
Porterville fatal car crash and road traffic accident list for 1999
- Fatal accident count4
- Vehicles involved in fatal accidents6
- Fatal accidents involving drunk persons5
- Fatalities6
- Persons involved in fatal accidents19
- Pedestrians involved in fatal accidents1
Dark - Not Lighted
- Porterville(Based on 4 reports) 50.0%
- Tulare County(Based on 60 reports) 35.0%
- California(Based on 3,137 reports) 25.2%
Dark - Lighted
- Porterville(Based on 4 reports) 50.0%
- Tulare County(Based on 60 reports) 15.0%
- California(Based on 3,137 reports) 22.8%
Clear
- Porterville(Based on 4 reports) 100.0%
- Tulare County(Based on 60 reports) 91.7%
- California(Based on 3,148 reports) 93.8%
| # | Date | Location | Vehicles | Drunk persons | Fatalites | Persons | Pedestrians |
|---|
| 1 | Feb 1, 1999 06:19 PM | Olive Ave | 1 | 1
| 1 | 2 | 1 |
| 2 | Mar 3, 1999 09:04 PM | Oljive Ave | 1 | - | 1
| 1 | - |
| 3 | Apr 10, 1999 09:49 PM | Sr-65 | 2 | 2
| 2 | 12 | - |
| 4 | Jul 17, 1999 09:30 PM | Road 160 | 2 | 2
| 2 | 4 | - |
Porterville fatal car crash and road traffic accident list for 1998
| # | Date | Location | Vehicles | Drunk persons | Fatalites | Persons | Pedestrians |
|---|
| 1 | Sep 6, 1998 10:45 PM | Sr-65 | 2 | 1
| 1 | 5 | - |
Porterville fatal car crash and road traffic accident list for 1997
- Fatal accident count4
- Vehicles involved in fatal accidents7
- Fatal accidents involving drunk persons1
- Fatalities5
- Persons involved in fatal accidents11
Daylight
- Porterville(Based on 4 reports) 100.0%
- Tulare County(Based on 51 reports) 60.8%
- California(Based on 3,271 reports) 49.1%
Clear
- Porterville(Based on 4 reports) 75.0%
- Tulare County(Based on 51 reports) 98.0%
- California(Based on 3,279 reports) 93.8%
Rain
- Porterville(Based on 4 reports) 25.0%
- Tulare County(Based on 51 reports) 2.0%
- California(Based on 3,279 reports) 4.8%
| # | Date | Location | Vehicles | Drunk persons | Fatalites | Persons | Pedestrians |
|---|
| 1 | Apr 22, 1997 10:53 AM | 65 | 2 | - | 1
| 3 | - |
| 2 | Jan 2, 1997 11:51 AM | 65 | 2 | 1
| 2 | 3 | - |
| 3 | Sep 7, 1997 03:27 PM | 65 | 2 | - | 1
| 4 | - |
| 4 | Oct 24, 1997 03:20 PM | 65 | 1 | - | 1
| 1 | - |
Porterville fatal car crash and road traffic accident list for 1996
| # | Date | Location | Vehicles | Drunk persons | Fatalites | Persons | Pedestrians |
|---|
| 1 | Jul 21, 1996 09:13 AM | 65 | 2 | 1
| 1 | 3 | - |
| 2 | Sep 9, 1996 07:51 PM | Main St | 1 | - | 1
| 2 | 1 |
Porterville fatal car crash and road traffic accident list for 1995
| # | Date | Location | Vehicles | Drunk persons | Fatalites | Persons | Pedestrians |
|---|
| 1 | May 14, 1995 12:48 AM | Henderson | 1 | - | 1
| 1 | - |
| 2 | Sep 1, 1995 06:22 PM | Main St | 1 | 1
| 1 | 3 | 1 |
Porterville fatal car crash and road traffic accident list for 1994
| # | Date | Location | Vehicles | Drunk persons | Fatalites | Persons | Pedestrians |
|---|
| 1 | Jan 22, 1994 11:05 PM | 190 | 2 | 1
| 1 | 4 | - |
| 2 | Mar 26, 1994 05:36 PM | Date Ave | 1 | 1
| 1 | 2 | 1 |
| 3 | Sep 23, 1994 04:59 PM | Main St | 1 | - | 1
| 3 | 1 |
Porterville fatal car crash and road traffic accident list for 1993
- Fatal accident count4
- Vehicles involved in fatal accidents8
- Fatal accidents involving drunk persons4
- Fatalities7
- Persons involved in fatal accidents19
Dark - Not Lighted
- Porterville(Based on 4 reports) 50.0%
- Tulare County(Based on 77 reports) 46.8%
- California(Based on 3,682 reports) 26.0%
Dark - Lighted
- Porterville(Based on 4 reports) 25.0%
- Tulare County(Based on 77 reports) 9.1%
- California(Based on 3,682 reports) 24.0%
Daylight
- Porterville(Based on 4 reports) 25.0%
- Tulare County(Based on 77 reports) 41.6%
- California(Based on 3,682 reports) 46.1%
Clear
- Porterville(Based on 4 reports) 75.0%
- Tulare County(Based on 77 reports) 89.6%
- California(Based on 3,687 reports) 93.4%
Rain
- Porterville(Based on 4 reports) 25.0%
- Tulare County(Based on 77 reports) 7.8%
- California(Based on 3,687 reports) 5.1%
| # | Date | Location | Vehicles | Drunk persons | Fatalites | Persons | Pedestrians |
|---|
| 1 | Jun 30, 1993 08:36 PM | 65 | 2 | 1
| 1 | 3 | - |
| 2 | Aug 24, 1993 12:15 AM | Road 192 | 2 | - | 3
| 3 | - |
| 3 | Oct 16, 1993 10:56 PM | 65 | 2 | 2
| 1 | 5 | - |
| 4 | Dec 11, 1993 08:08 PM | Main St | 2 | 1
| 2 | 8 | - |
Porterville fatal car crash and road traffic accident list for 1992
- Fatal accident count5
- Vehicles involved in fatal accidents8
- Fatal accidents involving drunk persons1
- Fatalities5
- Persons involved in fatal accidents15
- Pedestrians involved in fatal accidents1
Daylight
- Porterville(Based on 5 reports) 60.0%
- Tulare County(Based on 90 reports) 44.4%
- California(Based on 3,717 reports) 45.5%
Dark - Lighted
- Porterville(Based on 5 reports) 40.0%
- Tulare County(Based on 90 reports) 12.2%
- California(Based on 3,717 reports) 25.2%
Clear
- Porterville(Based on 5 reports) 100.0%
- Tulare County(Based on 90 reports) 96.7%
- California(Based on 3,722 reports) 92.3%
| # | Date | Location | Vehicles | Drunk persons | Fatalites | Persons | Pedestrians |
|---|
| 1 | Jan 17, 1992 12:05 AM | Mainstreet | 2 | - | 1
| 4 | - |
| 2 | Mar 28, 1992 11:57 PM | 65 | 2 | - | 1
| 4 | - |
| 3 | Jun 18, 1992 05:29 PM | 65 | 2 | - | 1
| 2 | - |
| 4 | Jul 1, 1992 08:16 PM | Plano St | 1 | 1
| 1 | 3 | - |
| 5 | Oct 22, 1992 05:42 PM | Main St | 1 | - | 1
| 2 | 1 |
Porterville fatal car crash and road traffic accident list for 1991
| # | Date | Location | Vehicles | Drunk persons | Fatalites | Persons | Pedestrians |
|---|
| 1 | Jan 15, 1991 06:02 PM | 65 | 2 | 2
| 1 | 3 | - |
| 2 | Sep 14, 1991 05:58 PM | Henderson | 2 | - | 1
| 3 | - |
Porterville fatal car crash and road traffic accident list for 1990
| # | Date | Location | Vehicles | Drunk persons | Fatalites | Persons | Pedestrians |
|---|
| 1 | Apr 9, 1990 12:43 AM | Henderson | 1 | - | 1
| 2 | - |
| 2 | May 9, 1990 08:56 PM | Plano St | 3 | - | 1
| 5 | - |
| 3 | Dec 4, 1990 10:55 AM | Putnam Ave | 3 | - | 1
| 8 | - |
Porterville fatal car crash and road traffic accident list for 1989
| # | Date | Location | Vehicles | Drunk persons | Fatalites | Persons | Pedestrians |
|---|
| 1 | Aug 6, 1989 04:45 PM | 190 | 2 | - | 1
| 9 | - |
| 2 | Sep 15, 1989 08:14 AM | Olive Ave | 2 | - | 1
| 5 | - |
Porterville fatal car crash and road traffic accident list for 1988
- Fatal accident count6
- Vehicles involved in fatal accidents7
- Fatal accidents involving drunk persons2
- Fatalities9
- Persons involved in fatal accidents18
Daylight
- Porterville(Based on 6 reports) 83.3%
- Tulare County(Based on 93 reports) 44.1%
- California(Based on 4,868 reports) 43.7%
Dark - Not Lighted
- Porterville(Based on 6 reports) 16.7%
- Tulare County(Based on 93 reports) 41.9%
- California(Based on 4,868 reports) 28.0%
Clear
- Porterville(Based on 6 reports) 100.0%
- Tulare County(Based on 93 reports) 94.6%
- California(Based on 4,875 reports) 94.0%
| # | Date | Location | Vehicles | Drunk persons | Fatalites | Persons | Pedestrians |
|---|
| 1 | Feb 18, 1988 04:35 PM | Corona Dr | 1 | 1
| 1 | 1 | - |
| 2 | Sep 10, 1988 09:20 PM | Mainstreet | 1 | 1
| 4 | 4 | - |
| 3 | Sep 21, 1988 10:54 AM | Mainstreet | 1 | - | 1
| 2 | - |
| 4 | Sep 29, 1988 07:57 AM | Main St | 2 | - | 1
| 2 | - |
| 5 | Nov 5, 1988 01:00 PM | Beverly St | 1 | - | 1
| 8 | - |
| 6 | Oct 5, 1988 03:46 PM | 190 | 1 | - | 1
| 1 | - |
Porterville fatal car crash and road traffic accident list for 1987
- Fatal accident count5
- Vehicles involved in fatal accidents6
- Fatal accidents involving drunk persons4
- Fatalities5
- Persons involved in fatal accidents13
Daylight
- Porterville(Based on 5 reports) 40.0%
- Tulare County(Based on 86 reports) 37.2%
- California(Based on 4,923 reports) 43.9%
Dark - Lighted
- Porterville(Based on 5 reports) 40.0%
- Tulare County(Based on 86 reports) 14.0%
- California(Based on 4,923 reports) 23.5%
Dark - Not Lighted
- Porterville(Based on 5 reports) 20.0%
- Tulare County(Based on 86 reports) 45.3%
- California(Based on 4,923 reports) 28.9%
Clear
- Porterville(Based on 5 reports) 100.0%
- Tulare County(Based on 86 reports) 96.5%
- California(Based on 4,935 reports) 93.0%
| # | Date | Location | Vehicles | Drunk persons | Fatalites | Persons | Pedestrians |
|---|
| 1 | May 31, 1987 01:10 AM | 65 | 1 | 1
| 1 | 5 | - |
| 2 | Aug 18, 1987 05:27 PM | Main St | 1 | 1
| 1 | 2 | - |
| 3 | Sep 28, 1987 03:35 PM | 65 | 1 | - | 1
| 2 | - |
| 4 | Nov 7, 1987 09:40 PM | Henderson | 2 | 2
| 1 | 2 | - |
| 5 | Dec 30, 1987 05:22 PM | Putnam Ave | 1 | - | 1
| 2 | - |
Porterville fatal car crash and road traffic accident list for 1986
| # | Date | Location | Vehicles | Drunk persons | Fatalites | Persons | Pedestrians |
|---|
| 1 | Jun 28, 1986 09:50 PM | Orange Ave | 1 | - | 1
| 3 | - |
| 2 | Jul 161986 02:42 AM | | 1 | 1
| 1 | 1 | - |
Porterville fatal car crash and road traffic accident list for 1985
- Fatal accident count4
- Vehicles involved in fatal accidents5
- Fatal accidents involving drunk persons3
- Fatalities5
- Persons involved in fatal accidents9
Dark - Not Lighted
- Porterville(Based on 4 reports) 50.0%
- Tulare County(Based on 84 reports) 40.5%
- California(Based on 4,436 reports) 26.8%
Daylight
- Porterville(Based on 4 reports) 25.0%
- Tulare County(Based on 84 reports) 41.7%
- California(Based on 4,436 reports) 44.6%
Dark - Lighted
- Porterville(Based on 4 reports) 25.0%
- Tulare County(Based on 84 reports) 15.5%
- California(Based on 4,436 reports) 24.5%
Clear
- Porterville(Based on 4 reports) 50.0%
- Tulare County(Based on 84 reports) 85.7%
- California(Based on 4,447 reports) 92.9%
Rain
- Porterville(Based on 4 reports) 50.0%
- Tulare County(Based on 84 reports) 7.1%
- California(Based on 4,447 reports) 3.9%
| # | Date | Location | Vehicles | Drunk persons | Fatalites | Persons | Pedestrians |
|---|
| 1 | Feb 23, 1985 01:10 AM | Orangebelt | 1 | - | 2
| 2 | - |
| 2 | Jul 28, 1985 03:10 PM | Richgrove | 1 | 1
| 1 | 1 | - |
| 3 | Dec 28, 1985 11:28 PM | Mainstreet | 1 | 1
| 1 | 2 | - |
| 4 | Dec 311985 10:28 PM | | 2 | 1
| 1 | 4 | - |
Porterville fatal car crash and road traffic accident list for 1984
- Fatal accident count4
- Vehicles involved in fatal accidents7
- Fatal accidents involving drunk persons2
- Fatalities4
- Persons involved in fatal accidents11
Daylight
- Porterville(Based on 4 reports) 50.0%
- Tulare County(Based on 70 reports) 45.7%
- California(Based on 4,504 reports) 43.0%
Dark - Lighted
- Porterville(Based on 4 reports) 25.0%
- Tulare County(Based on 70 reports) 5.7%
- California(Based on 4,504 reports) 24.2%
Dark - Not Lighted
- Porterville(Based on 4 reports) 25.0%
- Tulare County(Based on 70 reports) 47.1%
- California(Based on 4,504 reports) 29.5%
Clear
- Porterville(Based on 4 reports) 100.0%
- Tulare County(Based on 70 reports) 91.4%
- California(Based on 4,517 reports) 93.9%
| # | Date | Location | Vehicles | Drunk persons | Fatalites | Persons | Pedestrians |
|---|
| 1 | Jun 22, 1984 08:28 PM | Main St | 2 | 1
| 1 | 3 | - |
| 2 | Jun 24, 1984 05:51 PM | Main St | 2 | 1
| 1 | 3 | - |
| 3 | Aug 191984 02:10 AM | | 1 | - | 1
| 1 | - |
| 4 | Nov 23, 1984 02:30 PM | Henderson | 2 | - | 1
| 4 | - |
Porterville fatal car crash and road traffic accident list for 1983
- Fatal accident count5
- Vehicles involved in fatal accidents6
- Fatal accidents involving drunk persons1
- Fatalities6
- Persons involved in fatal accidents14
Dark - Not Lighted
- Porterville(Based on 5 reports) 60.0%
- Tulare County(Based on 82 reports) 47.6%
- California(Based on 4,082 reports) 29.8%
Daylight
- Porterville(Based on 5 reports) 40.0%
- Tulare County(Based on 82 reports) 41.5%
- California(Based on 4,082 reports) 42.4%
Clear
- Porterville(Based on 5 reports) 100.0%
- Tulare County(Based on 82 reports) 90.2%
- California(Based on 4,089 reports) 89.6%
| # | Date | Location | Vehicles | Drunk persons | Fatalites | Persons | Pedestrians |
|---|
| 1 | Feb 81983 01:00 AM | | 1 | - | 2
| 5 | - |
| 2 | Jun 17, 1983 06:25 PM | Mortonave | 1 | - | 1
| 1 | - |
| 3 | Jul 15, 1983 01:40 AM | Orangebelt | 1 | 1
| 1 | 1 | - |
| 4 | Nov 17, 1983 10:30 AM | Mainstreet | 1 | - | 1
| 3 | - |
| 5 | Nov 121983 05:30 PM | | 2 | - | 1
| 4 | - |
Porterville fatal car crash and road traffic accident list for 1982
- Fatal accident count5
- Vehicles involved in fatal accidents9
- Fatal accidents involving drunk persons2
- Fatalities6
- Persons involved in fatal accidents18
Dark - Not Lighted
- Porterville(Based on 5 reports) 40.0%
- Tulare County(Based on 83 reports) 48.2%
- California(Based on 4,116 reports) 29.9%
Daylight
- Porterville(Based on 5 reports) 40.0%
- Tulare County(Based on 83 reports) 39.8%
- California(Based on 4,116 reports) 39.7%
Dark - Lighted
- Porterville(Based on 5 reports) 20.0%
- Tulare County(Based on 83 reports) 9.6%
- California(Based on 4,116 reports) 27.0%
Clear
- Porterville(Based on 5 reports) 80.0%
- Tulare County(Based on 83 reports) 89.2%
- California(Based on 4,119 reports) 90.8%
Fog, Smog, Smoke
- Porterville(Based on 5 reports) 20.0%
- Tulare County(Based on 83 reports) 3.6%
- California(Based on 4,119 reports) 1.6%
| # | Date | Location | Vehicles | Drunk persons | Fatalites | Persons | Pedestrians |
|---|
| 1 | Feb 51982 05:13 AM | | 2 | - | 2
| 8 | - |
| 2 | Sep 5, 1982 10:10 PM | Orangest | 1 | 1
| 1 | 1 | - |
| 3 | Sep 20, 1982 02:23 PM | Soplanost | 2 | - | 1
| 4 | - |
| 4 | Sep 29, 1982 11:47 PM | Orngebltdr | 1 | 1
| 1 | 1 | - |
| 5 | Oct 1, 1982 02:37 PM | Nonewcomb | 3 | - | 1
| 4 | - |