Estimated zip code population in 2022: 4,967 Zip code population in 2010: 4,894 Zip code population in 2000: 3,370
Houses and condos: 2,321 Renter-occupied apartments: 205
% of renters here:
9%
State:
29%
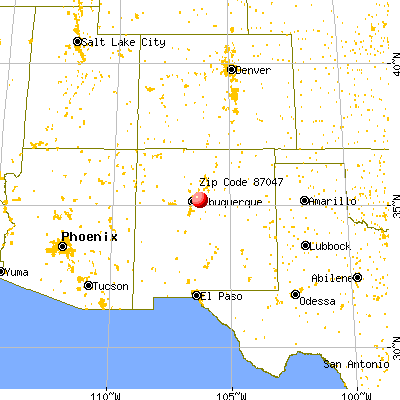
March 2022 cost of living index in zip code 87047: 88.0 (less than average, U.S. average is 100)
Land area: 132.9 sq. mi. Water area: 0.0 sq. mi.
Population density: 37 people per square mile
(very low).
OSM Map
General Map
Google Map
MSN Map
OSM Map
General Map
Google Map
MSN Map
OSM Map
General Map
Google Map
MSN Map
OSM Map
General Map
Google Map
MSN Map
Please wait while loading the map...
Real estate property taxes paid for housing units in 2022:
This zip code:
0.6% ($2,656)
New Mexico:
0.7% ($1,638)
Median real estate property taxes paid for housing units with mortgages in 2022: $2,796 (0.6%) Median real estate property taxes paid for housing units with no mortgage in 2022: $2,468 (0.5%)
Business Search- 14 Million verified businesses
Males: 2,564
(51.6%)
Females: 2,401
(48.4%)
For population 25 years and over in 87047:
High school or higher: 96.7%
Bachelor's degree or higher: 53.0%
Graduate or professional degree: 31.6%
Unemployed: 2.3%
Mean travel time to work (commute): 32.4 minutes
For population 15 years and over in 87047:
Never married: 26.2%
Now married: 58.3%
Separated: 0.9%
Widowed: 3.4%
Divorced: 11.3%
Zip code 87047 compared to state average:
Median household income above state average.
Median house value above state average.
Unemployed percentage below state average.
Black race population percentage significantly below state average.
Hispanic race population percentage below state average.
Median age significantly above state average.
Foreign-born population percentage significantly below state average.
Renting percentage significantly below state average.
Length of stay since moving in significantly above state average.
House age below state average.
Percentage of population with a bachelor's degree or higher above state average.
Estimated median house/condo value in 2022: $437,918
87047:
$437,918
New Mexico:
$243,100
According to our research of New Mexico and other state lists, there were 4 registered sex offenders living in 87047 zip code as of May 28, 2024. The ratio of all residents to sex offenders in zip code 87047 is 1,055 to 1. The ratio of registered sex offenders to all residents in this zip code is lower than the state average.
Median resident age:
This zip code:
49.4 years
New Mexico median age:
39.4 years
Average household size:
This zip code:
2.3 people
New Mexico:
2.4 people
Averages for the 2020 tax year for zip code 87047, filed in 2021:
Average Adjusted Gross Income (AGI) in 2020: $106,720 (Individual Income Tax Returns)
Here:
$106,720
State:
$59,146
Salary/wage: $84,693 (reported on 69.8% of returns)
Here:
$84,693
State:
$48,327
(% of AGI for various income ranges: 1014.6% for AGIs below $25k, 3057.0% for AGIs $25k-50k, 5190.9% for AGIs $50k-75k, 7938.2% for AGIs $75k-100k, 15457.6% for AGIs $100k-200k, 54690.0% for AGIs over 200k)
Taxable interest for individuals: $1,686 (reported on 51.9% of returns)
This zip code:
$1,686
New Mexico:
$1,616
(% of AGI for various income ranges: 30.0% for AGIs below $25k, 57.0% for AGIs $25k-50k, 72.7% for AGIs $50k-75k, 113.5% for AGIs $75k-100k, 240.8% for AGIs $100k-200k, 702.7% for AGIs over 200k)
Ordinary dividends: $8,285 (reported on 32.8% of returns)
Here:
$8,285
State:
$7,816
(% of AGI for various income ranges: 88.3% for AGIs below $25k, 85.0% for AGIs $25k-50k, 182.3% for AGIs $50k-75k, 422.9% for AGIs $75k-100k, 665.7% for AGIs $100k-200k, 2707.3% for AGIs over 200k)
Net capital gain/loss in AGI: +$26,458 (reported on 30.9% of returns)
Here:
+$26,458
State:
+$19,595
(% of AGI for various income ranges: 15.7% for AGIs below $25k, 63.0% for AGIs $25k-50k, 185.9% for AGIs $50k-75k, 232.4% for AGIs $75k-100k, 862.2% for AGIs $100k-200k, 15630.0% for AGIs over 200k)
Profit/loss from business: +$17,292 (reported on 19.1% of returns)
Here:
+$17,292
State:
+$11,430
(% of AGI for various income ranges: 135.4% for AGIs below $25k, 226.3% for AGIs $25k-50k, 334.5% for AGIs $50k-75k, 291.8% for AGIs $75k-100k, 837.3% for AGIs $100k-200k, 2875.5% for AGIs over 200k)
Taxable individual retirement arrangement distribution: $31,076 (reported on 17.2% of returns)
87047:
$31,076
New Mexico:
$20,970
(% of AGI for various income ranges: 126.0% for AGIs below $25k, 164.3% for AGIs $25k-50k, 362.3% for AGIs $50k-75k, 691.2% for AGIs $75k-100k, 1306.8% for AGIs $100k-200k, 5675.5% for AGIs over 200k)
Self-employed (Keogh) retirement plans: $25,250 (reported on 0.8% of returns)
87047:
$25,250
New Mexico:
$20,997
(% of AGI for various income ranges: 136.5% for AGIs $100k-200k)
Total itemized deductions: $33,542 (reported on 15.3% of returns)
Here:
$33,542
State:
$33,187
(% of AGI for various income ranges: 298.3% for AGIs below $25k, 415.0% for AGIs $50k-75k, 494.7% for AGIs $75k-100k, 1356.5% for AGIs $100k-200k, 5090.9% for AGIs over 200k)
Charity contributions: $10,141 (reported on 13.0% of returns)
Here:
$10,141
State:
$11,850
(% of AGI for various income ranges: 75.0% for AGIs $50k-75k, 74.7% for AGIs $75k-100k, 339.2% for AGIs $100k-200k, 1728.2% for AGIs over 200k)
Taxes paid: $8,123 (reported on 15.3% of returns)
87047:
$8,123
State:
$7,150
(% of AGI for various income ranges: 24.9% for AGIs below $25k, 100.9% for AGIs $50k-75k, 141.8% for AGIs $75k-100k, 359.5% for AGIs $100k-200k, 1244.5% for AGIs over 200k)
Earned income credit: $1,832 (reported on 7.3% of returns)
Here:
$1,832
State:
$2,323
(% of AGI for various income ranges: 57.1% for AGIs below $25k, 49.3% for AGIs $25k-50k)
Percentage of individuals using paid preparers for their 2020 taxes: 88.2%
Here:
88%
State:
92%
(% for various income ranges: 86.2% for AGIs below $25k, 88.1% for AGIs $25k-50k, 87.9% for AGIs $50k-75k, 89.3% for AGIs $75k-100k, 88.2% for AGIs $100k-200k, 90.9% for AGIs over 200k)
Averages for the 2012 tax year for zip code 87047, filed in 2013:
Average Adjusted Gross Income (AGI) in 2012: $88,920 (Individual Income Tax Returns)
Here:
$88,920
State:
$50,343
Salary/wage: $68,224 (reported on 77.1% of returns)
Here:
$68,224
State:
$41,171
(% of AGI for various income ranges: 63.6% for AGIs below $25k, 70.3% for AGIs $25k-50k, 63.6% for AGIs $50k-75k, 65.9% for AGIs $75k-100k, 64.7% for AGIs $100k-200k, 48.5% for AGIs over 200k)
Taxable interest for individuals: $1,438 (reported on 52.5% of returns)
This zip code:
$1,438
New Mexico:
$1,677
(% of AGI for various income ranges: 1.2% for AGIs below $25k, 1.0% for AGIs $25k-50k, 1.1% for AGIs $50k-75k, 1.0% for AGIs $75k-100k, 0.8% for AGIs $100k-200k, 0.7% for AGIs over 200k)
Ordinary dividends: $6,406 (reported on 34.3% of returns)
Here:
$6,406
State:
$6,939
(% of AGI for various income ranges: 3.3% for AGIs below $25k, 2.4% for AGIs $25k-50k, 2.4% for AGIs $50k-75k, 1.5% for AGIs $75k-100k, 2.0% for AGIs $100k-200k, 3.1% for AGIs over 200k)
Net capital gain/loss in AGI: +$13,166 (reported on 28.4% of returns)
Here:
+$13,166
State:
+$14,311
(% of AGI for various income ranges: 0.6% for AGIs below $25k, 1.1% for AGIs $50k-75k, 0.3% for AGIs $75k-100k, 1.8% for AGIs $100k-200k, 9.5% for AGIs over 200k)
Profit/loss from business: +$14,671 (reported on 22.0% of returns)
Here:
+$14,671
State:
+$11,059
(% of AGI for various income ranges: 10.3% for AGIs below $25k, 1.7% for AGIs $25k-50k, 5.3% for AGIs $50k-75k, 3.6% for AGIs $75k-100k, 2.5% for AGIs $100k-200k, 4.0% for AGIs over 200k)
Taxable individual retirement arrangement distribution: $25,350 (reported on 16.9% of returns)
87047:
$25,350
New Mexico:
$15,706
(% of AGI for various income ranges: 4.6% for AGIs below $25k, 4.6% for AGIs $25k-50k, 2.8% for AGIs $50k-75k, 4.0% for AGIs $75k-100k, 6.6% for AGIs $100k-200k, 4.1% for AGIs over 200k)
Self-employment retirement plans: $20,033 (reported on 1.3% of returns)
87047:
$20,033
New Mexico:
$18,209
Total itemized deductions: $26,445 (19% of AGI, reported on 48.3% of returns)
Here:
$26,445
State:
$21,709
Here:
18.7% of AGI
State:
19.8% of AGI
(% of AGI for various income ranges: 18.6% for AGIs below $25k, 14.0% for AGIs $25k-50k, 14.6% for AGIs $50k-75k, 14.6% for AGIs $75k-100k, 16.1% for AGIs $100k-200k, 12.5% for AGIs over 200k)
Charity contributions: $4,456 (reported on 40.3% of returns)
Here:
$4,456
State:
$4,195
(% of AGI for various income ranges: 1.2% for AGIs below $25k, 1.7% for AGIs $25k-50k, 1.2% for AGIs $50k-75k, 1.6% for AGIs $75k-100k, 2.2% for AGIs $100k-200k, 2.3% for AGIs over 200k)
Taxes paid: $8,314 (reported on 48.3% of returns)
87047:
$8,314
State:
$6,176
(% of AGI for various income ranges: 3.2% for AGIs below $25k, 2.7% for AGIs $25k-50k, 3.3% for AGIs $50k-75k, 3.8% for AGIs $75k-100k, 5.2% for AGIs $100k-200k, 4.9% for AGIs over 200k)
Earned income credit: $1,764 (reported on 9.3% of returns)
Here:
$1,764
State:
$2,311
(% of AGI for various income ranges: 4.0% for AGIs below $25k, 0.7% for AGIs $25k-50k)
Percentage of individuals using paid preparers for their 2012 taxes: 41.9%
Here:
42%
State:
50%
(% for various income ranges: 36.4% for AGIs below $25k, 39.0% for AGIs $25k-50k, 46.7% for AGIs $50k-75k, 40.0% for AGIs $75k-100k, 38.8% for AGIs $100k-200k, 70.0% for AGIs over 200k)
Averages for the 2004 tax year for zip code 87047, filed in 2005:
Average Adjusted Gross Income (AGI) in 2004: $66,324 (Individual Income Tax Returns)
Here:
$66,324
State:
$39,572
Salary/wage: $58,367 (reported on 82.3% of returns)
Here:
$58,367
State:
$34,237
(% of AGI for various income ranges: 124.0% for AGIs below $10k, 74.0% for AGIs $10k-25k, 73.7% for AGIs $25k-50k, 75.1% for AGIs $50k-75k, 76.7% for AGIs $75k-100k, 69.5% for AGIs over 100k)
Taxable interest for individuals: $1,659 (reported on 58.4% of returns)
This zip code:
$1,659
New Mexico:
$1,873
(% of AGI for various income ranges: 6.6% for AGIs below $10k, 1.9% for AGIs $10k-25k, 1.7% for AGIs $25k-50k, 1.4% for AGIs $50k-75k, 1.5% for AGIs $75k-100k, 1.3% for AGIs over 100k)
Taxable dividends: $3,806 (reported on 36.6% of returns)
Here:
$3,806
State:
$3,554
(% of AGI for various income ranges: 10.5% for AGIs below $10k, 3.8% for AGIs $10k-25k, 1.3% for AGIs $25k-50k, 1.7% for AGIs $50k-75k, 1.8% for AGIs $75k-100k, 2.2% for AGIs over 100k)
Net capital gain/loss: +$6,393 (reported on 32.2% of returns)
Here:
+$6,393
State:
+$10,425
(% of AGI for various income ranges: -2.8% for AGIs below $10k, 1.2% for AGIs $10k-25k, 1.3% for AGIs $25k-50k, 0.4% for AGIs $50k-75k, 0.6% for AGIs $75k-100k, 5.1% for AGIs over 100k)
Profit/loss from business: +$9,929 (reported on 23.4% of returns)
Here:
+$9,929
State:
+$8,875
(% of AGI for various income ranges: 14.9% for AGIs below $10k, 9.4% for AGIs $10k-25k, 4.8% for AGIs $25k-50k, 1.6% for AGIs $50k-75k, 2.9% for AGIs $75k-100k, 3.3% for AGIs over 100k)
IRA payment deduction: $3,259 (reported on 4.2% of returns)
87047:
$3,259
New Mexico:
$2,940
(% of AGI for various income ranges: 0.8% for AGIs $10k-25k, 0.5% for AGIs $25k-50k, 0.3% for AGIs $50k-75k, 0.3% for AGIs $75k-100k, 0.1% for AGIs over 100k)
Self-employed pension: $10,182 (reported on 1.1% of returns)
Here:
$10,182
New Mexico:
$13,110
Total itemized deductions: $21,061 (20% of AGI, reported on 50.5% of returns)
Here:
$21,061
State:
$18,103
Here:
20.3% of AGI
State:
21.5% of AGI
(% of AGI for various income ranges: 31.4% for AGIs below $10k, 17.8% for AGIs $10k-25k, 16.0% for AGIs $25k-50k, 15.9% for AGIs $50k-75k, 17.5% for AGIs $75k-100k, 15.4% for AGIs over 100k)
Charity contributions deductions: $3,001 (3% of AGI, reported on 44.0% of returns)
Here:
$3,001
State:
$3,246
Here:
2.8% of AGI
State:
3.6% of AGI
(% of AGI for various income ranges: 1.5% for AGIs below $10k, 2.1% for AGIs $10k-25k, 1.5% for AGIs $25k-50k, 1.7% for AGIs $50k-75k, 1.8% for AGIs $75k-100k, 2.2% for AGIs over 100k)
Total tax: $11,232 (reported on 81.5% of returns)
87047:
$11,232
State:
$6,237
(% of AGI for various income ranges: 5.1% for AGIs below $10k, 4.8% for AGIs $10k-25k, 7.3% for AGIs $25k-50k, 9.2% for AGIs $50k-75k, 10.6% for AGIs $75k-100k, 18.0% for AGIs over 100k)
Earned income credit: $1,457 (reported on 8.6% of returns)
Here:
$1,457
State:
$1,796
Percentage of individuals using paid preparers for their 2004 taxes: 47.5%
Here:
47%
State:
57%
(% for various income ranges: 37.9% for AGIs below $10k, 51.6% for AGIs $10k-25k, 48.0% for AGIs $25k-50k, 47.6% for AGIs $50k-75k, 40.4% for AGIs $75k-100k, 55.6% for AGIs over 100k)
Likely homosexual households (counted as self-reported same-sex unmarried-partner households)
Lesbian couples: 0.3% of all households
Gay men: 0.0% of all households
Household received Food Stamps/SNAP in the past 12 months: 52 Household did not receive Food Stamps/SNAP in the past 12 months: 2,062
Women who had a birth in the past 12 months: 39 (13 now married, 21 unmarried) Women who did not have a birth in the past 12 months: 872 (426 now married, 441 unmarried)
Housing units in zip code 87047 with a mortgage: 1,273 (102 second mortgage, 93 both second mortgage and home equity loan) Median monthly owner costs for units with a mortgage: $1,511 Median monthly owner costs for units without a mortgage: $605
Residents with income below the poverty level in 2022:
This zip code:
4.2%
Whole state:
17.6%
Residents with income below 50% of the poverty level in 2022:
This zip code:
1.3%
Whole state:
9.7%
Median number of rooms in houses and condos:
Here:
6.5
State:
5.9
Median number of rooms in apartments:
Here:
4.8
State:
4.2
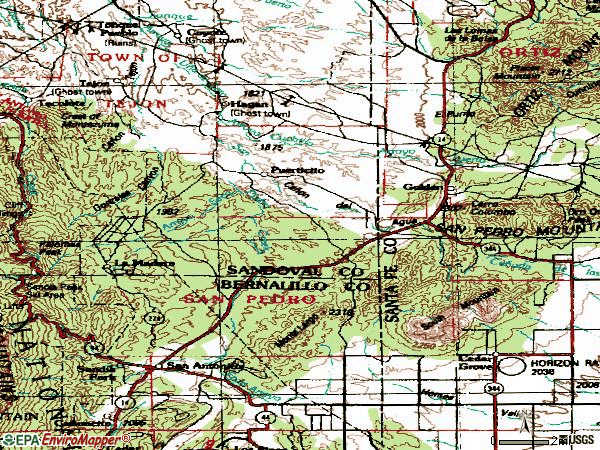
Notable locations in this zip code not listed on our city pages
Notable locations in zip code 87047: Palo Amarillo Ranch (A), Ranchito (B), Smelter Ruins (C), Stewart Ranch (D), Camp Campbell (E), Sandia Cave Trailhead (F), Vista Grande Community Center (G), Dry Camp Picnic Area (H), Boxcar Camp (I), Balsam Glade Picnic Area (J), Las Huertas Picnic Area (K), Pa-ako Ruins (L), Glenn Ranch (M), Golden Weather Station (N), Capulin Spring Picnic Area (O), Sandia Park Weather Station (P), Lone Mountain Cattle Company (Q), Santa Fe County Volunteer Fire Edgewood District Station 3 (R), Bernalillo County Fire and Rescue Station 6 (S). Display/hide their locations on the map
Churches in zip code 87047 include: Community Church (A), San Franciso Church (B), San Antonio Catholic Mission (C). Display/hide their locations on the map
In group quarters: 1 (-1 institutionalized population)
Size of family households: 925 2-persons, 196 3-persons, 256 4-persons, 68 5-persons, 13 6-persons, 21 7-or-more-persons
Size of nonfamily households: 510 1-person, 159 2-persons
756 married couples with children.
71 single-parent households (17 men, 54 women).
94.0% of residents of 87047 zip code speak English at home.
6.0% of residents speak Spanish at home (81% very well, 7% well, 12% not well).
0.8% of residents speak other Indo-European language at home (100% very well).
0.7% of residents speak Asian or Pacific Island language at home (91% very well, 9% well).
0.4% of residents speak other language at home (100% very well).
Foreign born population: 166 (3.4%) (80.4% of them are naturalized citizens)
This zip code:
3.4%
Whole state:
9.3%
31%Sweden
20%France
18%Honduras
9%Haiti
5%Egypt
4%United Kingdom, excluding England and Scotland
4%Czechoslovakia (includes Czech Republic and Slovakia)
11%German
10%American
8%English
5%European
5%Irish
4%Polish
3%Dutch
Year of entry for the foreign-born population
82010 or later
02000 to 2009
461990 to 1999
125Before 1990
Facilities with environmental interests located in this zip code:
E. MT. CHARTER HIGH ( in SANDIA PARK, NM)
(National Center for Education Statistics) - STATE ID-01015024 Organizations: ALBUQUERQUE PUBLIC SCHOOLS (SCHOOL DISTRICT)
CARACHE CANYON DECLINE (3.5 MI. NW OF GOLDEN in GOLDEN, NM)
AIR MINOR (AIRS/AFS) CRITERIA AND HAZARDOUS AIR POLLUTANT INVENTORY (Inventory of air pollution sources) Business SIC classification: GOLD ORES Business NAICS classification: GOLD ORE MINING. Alternative names: LAC MINERALS CARACHE CANYON DECLINE, LAC MINERALS CARACHE CYN DECLINE
HARVEY & O'GUINN RESIDENTIAL (CONSTRUCTION PROJECT in SANDIA PARK, NM)
National Pollutant Discharge Elimination System NON-MAJOR (Tracking pollutant discharge elimination systems) - permit Business SIC classification: GENERAL CONTRACTORS-SINGLE-FAMILY HOUSES Alternative names: CROMBIE CONSTRUCTION, INC.
HANK KOLB (NMU001491) (105 AVENIDA DEL MONTE ROAD in SANDIA PARK, NM)
ENFORCEMENT/COMPLIANCE ACTIVITY (Integrated Compliance Information System)
HARVEY & O'GUINN RESIDENTIAL CONSTRUCTION PROJECT (31 KRAMER RD. in SANDIA PARK, NM)
ENFORCEMENT/COMPLIANCE ACTIVITY (Integrated Compliance Information System)
Housing units lacking complete plumbing facilities: 1.6% Housing units lacking complete kitchen facilities: 2.1%
40.4%Bottled, tank, or LP gas
21.6%Utility gas
19.5%Wood
9.0%Electricity
5.9%Other fuel
3.2%Solar energy
Population in 1990: 2,672. Population change in the 1990s: +698 (+26.1%).
Place of birth for U.S.-born residents:
This state: 1,820
Northeast: 639
Midwest: 635
South: 816
West: 884
55% of the 87047 zip code residents lived in the same house 5 years ago. Out of people who lived in different houses, 49% lived in this county. Out of people who lived in different counties, 50% lived in New Mexico.
93% of the 87047 zip code residents lived in the same house 1 year ago. Out of people who lived in different houses, 16% moved from this county. Out of people who lived in different houses, 15% moved from different county within same state. Out of people who lived in different houses, 73% moved from different state. Out of people who lived in different houses, 7% moved from abroad.
Private vs. public school enrollment:
Students in private schools in grades 1 to 8 (elementary and middle school): 198
Here:
36.6%
New Mexico:
10.2%
Students in private schools in grades 9 to 12 (high school): 182
Here:
49.2%
New Mexico:
10.0%
Students in private undergraduate colleges:
Here:
0.0%
New Mexico:
12.3%
Occupation by median earnings in the past 12 months ($)
177,056Computer and mathematical occupations
155,154Architecture and engineering occupations
140,920Sales and related occupations
125,268Business and financial operations occupations
124,038Legal occupations
105,367Law enforcement workers including supervisors
Companies with federal contracts located in this zip code:
M E MARTIN CONSTRUCTION (44 OKILL DRV in SANDIA PARK, NM; small business) : $87,621 in 5 contractsfrom 2003 to 2005
Contracts for Miscellaneous Items, Maintenance, Repair or Alteration of Real Property -- Other Non-Building Facilities, Maintenance, Repair or Alteration of Real Property -- Other Administrative Facilities and Service Buildings by Army Signed by year:2000: $0; 2001: $0; 2002: $0; 2003: $23,227; 2004: $40,697; 2005: $23,697; 2006: $0.
Biggest contracts:
$26,902 with Army for Miscellaneous Items. Signed on 2004-08-10. Completion date: 2004-10-15.
$23,227 with Army for Maintenance, Repair or Alteration of Real Property -- Other Non-Building Facilities. Signed on 2003-06-24. Completion date: 2003-06-11.
$22,997 with Army for Maintenance, Repair or Alteration of Real Property -- Other Administrative Facilities and Service Buildings. Signed on 2005-04-06. Completion date: 2005-05-20.
$13,795, same as above.Signed on 2004-10-28. Completion date: 2004-10-25.
Top industries in this zip code by the number of employees in 2005:
Professional, Scientific, and Technical Services: Administrative Management and General Management Consulting Services (20-49 employees: 1 establishment, 1-4 employees: 3 establishments)
Health Care and Social Assistance: Offices of All Other Miscellaneous Health Practitioners (20-49: 1, 1-4: 1)
Arts, Entertainment, and Recreation: Golf Courses and Country Clubs (20-49: 1)
Accommodation and Food Services: Full-Service Restaurants (20-49: 1)
Construction: New Single-Family Housing Construction (except Operative Builders) (5-9: 3, 1-4: 2)
Construction: Electrical Contractors (1-4: 6)
Health Care and Social Assistance: Offices of Physical, Occupational and Speech Therapists, and Audiologists (5-9: 1, 1-4: 2)
Administrative and Support and Waste Management and Remediation Services: Janitorial Services (5-9: 1, 1-4: 1)
Fatal accident statistics in 2012:
Fatal accident count: 2
Vehicles involved in fatal accidents: 2
Fatal accidents caused by drunken drivers: 0
Fatalities: 2
Persons involved in fatal accidents: 2
Pedestrians involved in fatal accidents: 0
Fatal accident statistics in 2010:
Fatal accident count: 1
Vehicles involved in fatal accidents: 1
Fatal accidents caused by drunken drivers: 0
Fatalities: 1
Persons involved in fatal accidents: 1
Pedestrians involved in fatal accidents: 0
Home Mortgage Disclosure Act Aggregated Statistics For Year 2009 (Based on 2 full tracts)
A) FHA, FSA/RHS & VA Home Purchase Loans
B) Conventional Home Purchase Loans
C) Refinancings
D) Home Improvement Loans
F) Non-occupant Loans on < 5 Family Dwellings (A B C & D)
G) Loans On Manufactured Home Dwelling (A B C & D)
Number
Average Value
Number
Average Value
Number
Average Value
Number
Average Value
Number
Average Value
Number
Average Value
LOANS ORIGINATED
12
$228,917
41
$256,746
277
$236,173
14
$68,405
14
$223,770
14
$134,456
APPLICATIONS APPROVED, NOT ACCEPTED
0
$0
8
$486,346
25
$275,591
2
$48,465
0
$0
2
$271,405
APPLICATIONS DENIED
2
$132,795
2
$256,865
70
$240,857
19
$29,895
10
$285,556
8
$101,291
APPLICATIONS WITHDRAWN
4
$181,745
6
$435,862
56
$237,132
0
$0
4
$124,070
2
$112,440
FILES CLOSED FOR INCOMPLETENESS
0
$0
2
$224,880
19
$195,186
0
$0
0
$0
0
$0
Aggregated Statistics For Year 2008 (Based on 2 full tracts)
A) FHA, FSA/RHS & VA Home Purchase Loans
B) Conventional Home Purchase Loans
C) Refinancings
D) Home Improvement Loans
F) Non-occupant Loans on < 5 Family Dwellings (A B C & D)
G) Loans On Manufactured Home Dwelling (A B C & D)
Number
Average Value
Number
Average Value
Number
Average Value
Number
Average Value
Number
Average Value
Number
Average Value
LOANS ORIGINATED
21
$174,012
76
$307,549
188
$272,311
17
$93,395
16
$174,595
8
$97,658
APPLICATIONS APPROVED, NOT ACCEPTED
2
$183,200
8
$356,218
35
$299,154
2
$5,815
2
$283,035
2
$137,640
APPLICATIONS DENIED
2
$123,100
21
$502,282
87
$335,957
10
$50,985
4
$589,335
6
$95,315
APPLICATIONS WITHDRAWN
6
$285,297
10
$396,831
50
$203,282
6
$166,397
4
$82,875
0
$0
FILES CLOSED FOR INCOMPLETENESS
0
$0
0
$0
19
$178,657
0
$0
0
$0
0
$0
Aggregated Statistics For Year 2007 (Based on 2 full tracts)
A) FHA, FSA/RHS & VA Home Purchase Loans
B) Conventional Home Purchase Loans
C) Refinancings
D) Home Improvement Loans
F) Non-occupant Loans on < 5 Family Dwellings (A B C & D)
G) Loans On Manufactured Home Dwelling (A B C & D)
Number
Average Value
Number
Average Value
Number
Average Value
Number
Average Value
Number
Average Value
Number
Average Value
LOANS ORIGINATED
10
$182,616
134
$236,871
174
$245,712
64
$66,882
25
$223,482
12
$100,808
APPLICATIONS APPROVED, NOT ACCEPTED
2
$98,870
35
$228,699
48
$262,801
4
$165,750
10
$347,203
8
$101,050
APPLICATIONS DENIED
4
$114,862
33
$241,268
99
$230,458
17
$117,000
16
$352,341
16
$95,961
APPLICATIONS WITHDRAWN
0
$0
19
$278,954
50
$257,446
6
$40,388
2
$119,225
6
$124,070
FILES CLOSED FOR INCOMPLETENESS
0
$0
4
$184,652
31
$198,237
0
$0
0
$0
0
$0
Aggregated Statistics For Year 2006 (Based on 2 full tracts)
A) FHA, FSA/RHS & VA Home Purchase Loans
B) Conventional Home Purchase Loans
C) Refinancings
D) Home Improvement Loans
F) Non-occupant Loans on < 5 Family Dwellings (A B C & D)
G) Loans On Manufactured Home Dwelling (A B C & D)
Number
Average Value
Number
Average Value
Number
Average Value
Number
Average Value
Number
Average Value
Number
Average Value
LOANS ORIGINATED
17
$181,316
190
$197,635
174
$202,127
35
$57,715
27
$215,974
17
$117,228
APPLICATIONS APPROVED, NOT ACCEPTED
0
$0
31
$176,287
25
$208,981
6
$39,742
0
$0
4
$63,005
APPLICATIONS DENIED
4
$133,280
35
$234,626
136
$201,985
45
$59,709
8
$122,374
16
$101,171
APPLICATIONS WITHDRAWN
2
$124,070
16
$94,386
68
$174,331
4
$108,078
6
$149,918
4
$101,778
FILES CLOSED FOR INCOMPLETENESS
0
$0
8
$144,668
25
$267,527
0
$0
2
$275,280
0
$0
Aggregated Statistics For Year 2005 (Based on 2 full tracts)
A) FHA, FSA/RHS & VA Home Purchase Loans
B) Conventional Home Purchase Loans
C) Refinancings
D) Home Improvement Loans
F) Non-occupant Loans on < 5 Family Dwellings (A B C & D)
G) Loans On Manufactured Home Dwelling (A B C & D)
Number
Average Value
Number
Average Value
Number
Average Value
Number
Average Value
Number
Average Value
Number
Average Value
LOANS ORIGINATED
8
$246,686
198
$225,348
186
$169,607
14
$99,146
45
$203,251
16
$79,725
APPLICATIONS APPROVED, NOT ACCEPTED
2
$66,880
25
$126,164
43
$105,451
0
$0
6
$44,265
4
$105,170
APPLICATIONS DENIED
2
$66,880
23
$230,188
91
$155,791
21
$89,730
14
$226,816
10
$94,216
APPLICATIONS WITHDRAWN
2
$326,655
19
$247,835
56
$150,276
19
$106,725
10
$89,563
2
$116,315
FILES CLOSED FOR INCOMPLETENESS
2
$86,270
4
$266,558
19
$169,373
2
$4,845
0
$0
0
$0
Aggregated Statistics For Year 2004 (Based on 2 full tracts)
A) FHA, FSA/RHS & VA Home Purchase Loans
B) Conventional Home Purchase Loans
C) Refinancings
D) Home Improvement Loans
F) Non-occupant Loans on < 5 Family Dwellings (A B C & D)
G) Loans On Manufactured Home Dwelling (A B C & D)
Number
Average Value
Number
Average Value
Number
Average Value
Number
Average Value
Number
Average Value
Number
Average Value
LOANS ORIGINATED
25
$153,150
176
$184,420
268
$170,857
14
$42,372
23
$171,187
10
$84,329
APPLICATIONS APPROVED, NOT ACCEPTED
0
$0
25
$278,926
27
$149,847
6
$63,973
8
$190,468
0
$0
APPLICATIONS DENIED
2
$107,590
29
$142,788
101
$225,204
19
$60,607
17
$89,632
4
$69,305
APPLICATIONS WITHDRAWN
4
$124,555
37
$156,188
47
$182,476
14
$30,741
8
$140,306
6
$73,020
FILES CLOSED FOR INCOMPLETENESS
0
$0
0
$0
14
$168,796
2
$48,465
0
$0
0
$0
Aggregated Statistics For Year 2003 (Based on 2 full tracts)
A) FHA, FSA/RHS & VA Home Purchase Loans
B) Conventional Home Purchase Loans
C) Refinancings
D) Home Improvement Loans
F) Non-occupant Loans on < 5 Family Dwellings (A B C & D)
Number
Average Value
Number
Average Value
Number
Average Value
Number
Average Value
Number
Average Value
LOANS ORIGINATED
19
$132,335
151
$178,287
574
$159,012
10
$28,304
33
$169,833
APPLICATIONS APPROVED, NOT ACCEPTED
0
$0
19
$215,388
62
$157,058
0
$0
4
$158,480
APPLICATIONS DENIED
2
$122,130
16
$154,967
138
$162,983
4
$2,422
2
$174,475
APPLICATIONS WITHDRAWN
0
$0
17
$219,746
87
$136,170
4
$35,380
14
$122,132
FILES CLOSED FOR INCOMPLETENESS
0
$0
4
$133,762
14
$236,371
2
$19,385
0
$0
Aggregated Statistics For Year 1999 (Based on 1 partial tract)
A) FHA, FSA/RHS & VA Home Purchase Loans
B) Conventional Home Purchase Loans
C) Refinancings
D) Home Improvement Loans
F) Non-occupant Loans on < 5 Family Dwellings (A B C & D)
Detailed PMIC statistics for the following Tracts:0038.03
2006 - 2018 National Fire Incident Reporting System (NFIRS) incidents
Based on the data from the years 2006 - 2018 the average number of fire incidents per year is 22. The highest number of reported fire incidents - 30 took place in 2016, and the least - 14 in 2012. The data has an increasing trend.
When looking into fire subcategories, the most reports belonged to: Outside Fires (46.5%), and Structure Fires (36.5%).
Fire incident types reported to NFIRS in Zip Code 87047


 Nearest zip codes: 87001, 87043, 87008, 87015, 87122, 87010.


 Based on the data from the years 2006 - 2018 the average number of fire incidents per year is 22. The highest number of reported fire incidents - 30 took place in 2016, and the least - 14 in 2012. The data has an increasing trend.
 When looking into fire subcategories, the most reports belonged to: Outside Fires (46.5%), and Structure Fires (36.5%).