Sandoval County, New Mexico (NM)
County owner-occupied free and clear houses and condos in 2010: 9,707
County owner-occupied houses and condos in 2000: 26,265
Renter-occupied apartments: 9,044 (it was 5,146 in 2000)
| % of renters here: | 16% |
| State: | 31% |
Land area: 3709 sq. mi.
Water area: 5.0 sq. mi.
Population density: 41 people per square mile (average).
Industries providing employment: Educational, health and social services (24.0%), Professional, scientific, management, administrative, and waste management services (12.5%), Retail trade (11.5%).
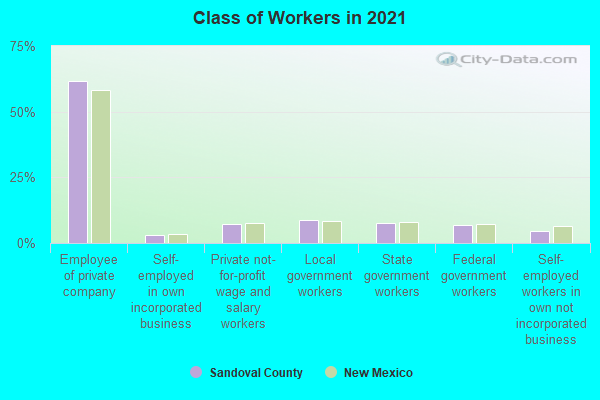
Type of workers:
- Private wage or salary: 70%
- Government: 23%
- Self-employed, not incorporated: 6%
- Unpaid family work: 1%
- OSM Map
- General Map
- Google Map
- MSN Map

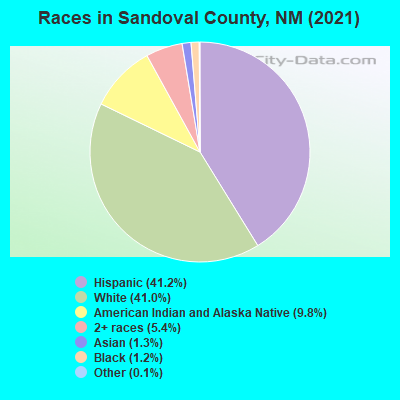
- 63,56541.4%Hispanic or Latino
- 61,17839.9%White Non-Hispanic Alone
- 17,33211.3%American Indian and Alaska Native alone
- 5,0483.3%Two or more races
- 3,4352.2%Black Non-Hispanic Alone
- 2,0851.4%Asian alone
- 5720.4%Some other race alone
- 2860.2%Native Hawaiian and Other
Pacific Islander alone
| Median resident age: | 41.4 years |
| New Mexico median age: | 39.4 years |
| Males: 76,041 | |
| Females: 77,460 |

 | improving NM (44 replies) |
| Searching for a Safe and Family-Friendly Neighborhood in Albuquerque (Update 2023) (37 replies) |
| New Mexico Covid-19 discussion (429 replies) |
| Likely will be relocating to NM and just trying to figure out where? (9 replies) |
| Retiring to Silver City/Grant County NM or Pima County, AZ: Pros & Cons? (40 replies) |
| Jury Duty in New Mexico (61 replies) |
| Sandoval County: | 2.0 people |
| New Mexico: | 3 people |
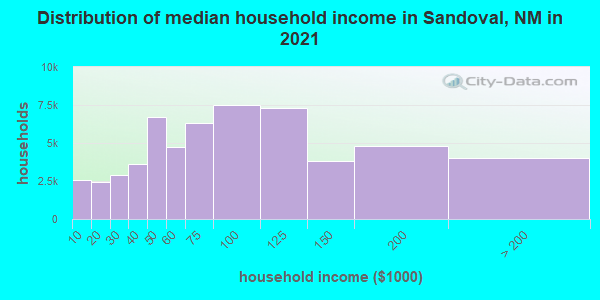
Estimated median household income in 2022: $83,639 ($44,949 in 1999)
| This county: | $83,639 |
| New Mexico: | $59,726 |
Median contract rent in 2022 for apartments: $1,156 (lower quartile is $843, upper quartile is $1,521)
| This county: | $1156 |
| State: | $816 |
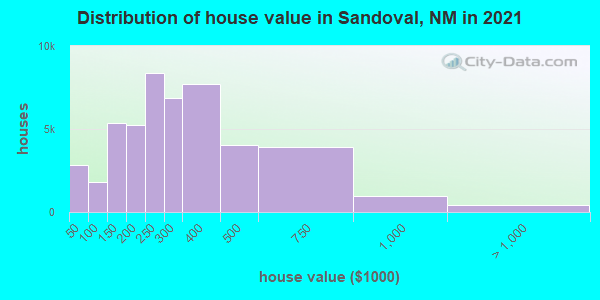
Estimated median house or condo value in 2022: $315,500 (it was $111,600 in 2000)
| Sandoval: | $315,500 |
| New Mexico: | $243,100 |
Mean price in 2022:
Median monthly housing costs for homes and condos with a mortgage: $1,499Detached houses: $425,810
Here: $425,810 State: $322,045 Townhouses or other attached units: $531,327
Here: $531,327 State: $284,053 In 2-unit structures: $180,627
Here: $180,627 State: $354,971 In 3-to-4-unit structures: $135,601
Here: $135,601 State: $235,720 In 5-or-more-unit structures: $162,590
Here: $162,590 State: $217,304 Mobile homes: $459,468
Here: $459,468 State: $117,675 Occupied boats, RVs, vans, etc.: $28,275
Here: $28,275 State: $78,635
Median monthly housing costs for units without a mortgage: $448
Institutionalized population: 481
Crime in 2020 (reported by the sheriff's office or county police, not the county total):
- Murders: 1
- Rapes: 0
- Robberies: 0
- Assaults: 64
- Burglaries: 30
- Thefts: 31
- Auto thefts: 1
Crime in 2019 (reported by the sheriff's office or county police, not the county total):
- Murders: 0
- Rapes: 1
- Robberies: 1
- Assaults: 142
- Burglaries: 43
- Thefts: 59
- Auto thefts: 0
Health of residents in Sandoval County based on CDC Behavioral Risk Factor Surveillance System Survey Questionnaires from 2013 to 2021:
General health status score of residents in this county from 1 (poor) to 5 (excellent) is 3.5. This is about average.77.5% of residents exercised in the past month. This is about average.
43.3% of residents smoked 100+ cigarettes in their lives. This is about average.
52.3% of adult residents drank alcohol in the past 30 days. This is less than average.
69.3% of residents visited a dentist within the past year. This is about average.
Average weight of males is 192 pounds. This is about average.
Average weight of females is 158 pounds. This is about average.
Health of residents in Sandoval County based on CDC Behavioral Risk Factor Surveillance System Survey Questionnaires from 2003 to 2012:
General health status score of residents in this county from 1 (poor) to 5 (excellent) is 3.5. This is about average.78.3% of residents exercised in the past month. This is about average.
47.3% of residents smoked 100+ cigarettes in their lives. This is about average.
72.2% of adult residents drank alcohol in the past 30 days. This is about average.
67.7% of residents visited a dentist within the past year. This is about average.
Average weight of males is 190 pounds. This is about average.
Average weight of females is 160 pounds. This is about average.
36.6% of residents keep firearms around their homes. This is more than average.
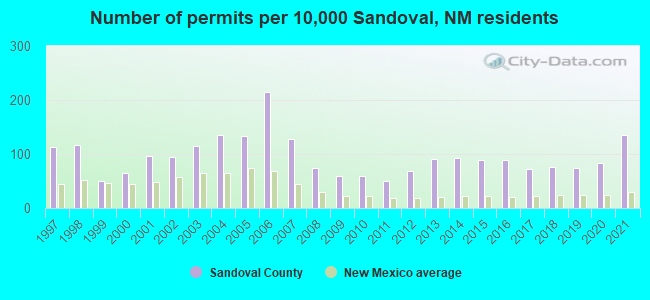
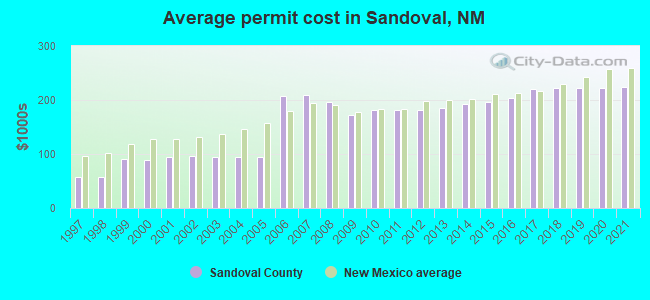
Single-family new house construction building permits:
- 2022: 835 buildings, average cost: $231,100
- 2021: 1215 buildings, average cost: $224,400
- 2020: 745 buildings, average cost: $222,000
- 2019: 677 buildings, average cost: $222,000
- 2018: 686 buildings, average cost: $222,300
- 2017: 650 buildings, average cost: $220,300
- 2016: 804 buildings, average cost: $202,700
- 2015: 804 buildings, average cost: $195,900
- 2014: 834 buildings, average cost: $191,800
- 2013: 818 buildings, average cost: $184,800
- 2012: 607 buildings, average cost: $181,800
- 2011: 453 buildings, average cost: $181,600
- 2010: 535 buildings, average cost: $180,700
- 2009: 530 buildings, average cost: $172,700
- 2008: 676 buildings, average cost: $196,700
- 2007: 1147 buildings, average cost: $209,800
- 2006: 1935 buildings, average cost: $207,900
- 2005: 1202 buildings, average cost: $95,200
- 2004: 1213 buildings, average cost: $95,200
- 2003: 1021 buildings, average cost: $94,900
- 2002: 857 buildings, average cost: $95,600
- 2001: 864 buildings, average cost: $94,100
- 2000: 576 buildings, average cost: $87,900
- 1999: 449 buildings, average cost: $89,700
- 1998: 1052 buildings, average cost: $56,900
- 1997: 1014 buildings, average cost: $56,700
Median real estate property taxes paid for housing units with mortgages in 2022: $2,372 (0.7%)
Median real estate property taxes paid for housing units with no mortgage in 2022: $1,902 (0.7%)

| Sandoval County: | 10.1% |
| New Mexico: | 17.6% |
Median age of residents in 2022: 41.4 years old
(Males: 41.2 years old, Females: 41.7 years old)
(Median age for: White residents: 53.4 years old, Black residents: 40.0 years old, American Indian residents: 32.0 years old, Asian residents: 35.6 years old, Hispanic or Latino residents: 34.5 years old, Other race residents: 41.4 years old)
Area name: Albuquerque, NM MSA
Fair market rent in 2006 for a 1-bedroom apartment in Sandoval County is $571 a month.
Fair market rent for a 2-bedroom apartment is $721 a month.
Fair market rent for a 3-bedroom apartment is $1050 a month.
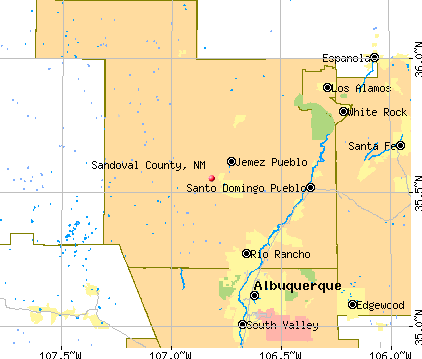
Cities in this county include: Santo Domingo, Corrales, Bernalillo, Jemez, Placitas, Santo Domingo Pueblo, San Felipe Pueblo, Jemez Pueblo, Algodones, Pena Blanca.
2023 air pollution in Sandoval County:
Ozone (1-hour): 0.036 ppm (standard limit: 0.12 ppm). Near U.S. average.
Notable locations in this county outside city limits:
Notable locations in Sandoval County: Lake Windmill (A), Largo Windmill (B), Leatherman Windmill (C), Little Johnny Windmill (D), Logan Ranch (E), Louis Windmills (F), Lower Andrews Windmill (G), Martinez Windmill (H), Mathis Ranch (I), McCarty Ranch (J), McCarty West Camp (K), McCloy Ranch (L), McCuistion Camp (M), McFarland Well (N), McIntosh Camp (O), McIntosh Windmill (P), McNeil Windmill (Q), Medano Windmill (R), Nelson Well (S), New Pasture Windmill (T). Display/hide their locations on the map
Churches in Sandoval County include: Sacred Heart Church Historic Site (A), Hanova Church (B), Church of the Immaculate Conception Historic Site (C), Mosquero Creek Church (D), Carrizo Church (E). Display/hide their locations on the map
Cemeteries: Alamosa Cemetery (1), Rosebud Cemetery (2), Calvert Cemetery (3), Johnson Cemetery (4), Mestenito Cemetery (5), Trujillo Cemetery (6), Armenta Plaza Cemetery (7). Display/hide their locations on the map
Lakes and reservoirs: Indian Bathtub (A), Matis Lake (B), Payton Lake (C), Gunn Lake (D), Laguna Tierra Amatosa (E), Island Lake (F), Dorhman Lake (G), Cone Lake (H). Display/hide their locations on the map
Streams, rivers, and creeks: Arroyo de la Cejita (A), Alamosa Creek (B), Bueyeros Creek (C), Conejo Creek (D), Del Muerto Creek (E), Deposito Creek (F), Garcia Creek (G), Las Canelas Creek (H), Las Cuevas Creek (I). Display/hide their locations on the map
Parks in Sandoval County include: New Goodnight Trail Historical Marker (1), Mills Canyon Historical Marker (2), Chicosa Lake State Park (3). Display/hide their locations on the map
Neighboring counties: Mohave County, Arizona  , Chatham County, North Carolina
  , Franklin County, North Carolina , Meigs County, Tennessee , Southampton County, Virginia .
| Here: | 3.6% |
| New Mexico: | 3.6% |
Current college students: 4,415
People 25 years of age or older with a high school degree or higher: 92.4%
People 25 years of age or older with a bachelor's degree or higher: 34.6%
Number of foreign born residents: 10,340 (48.7% naturalized citizens)
| Sandoval County: | 6.7% |
| Whole state: | 9.3% |
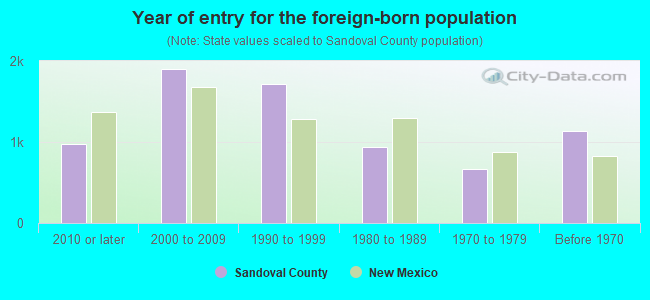
- Year of entry for the foreign-born population
- 1,2592010 or later
- 2,2582000 to 2009
- 1,7881990 to 1999
- 9391980 to 1989
- 6661970 to 1979
- 1,136Before 1970
Mean travel time to work (commute): minutes
Percentage of county residents living and working in this county: 99.2%
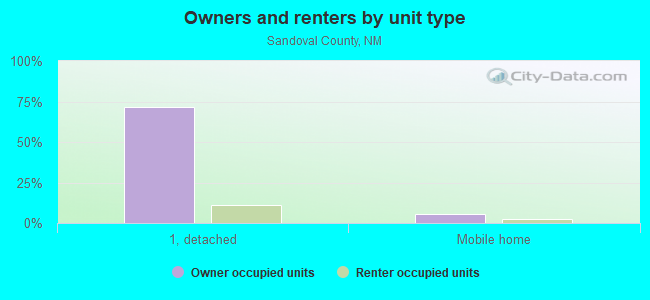
Housing units in structures:
- One, detached: 52,549
- One, attached: 2,065
- Two: 184
- 3 or 4: 1,161
- 5 to 9: 790
- 10 to 19: 514
- 20 to 49: 261
- 50 or more: 922
- Mobile homes: 2,940
- Boats, RVs, vans, etc.: 89
Housing units in Sandoval County with a mortgage: 31,976 (1,625 second mortgage, 51 home equity loan, 1,068 both second mortgage and home equity loan)
Houses without a mortgage: 284
| Here: | 9.8% with mortgage |
| State: | 98.8% with mortgage |
Religion statistics for Sandoval County
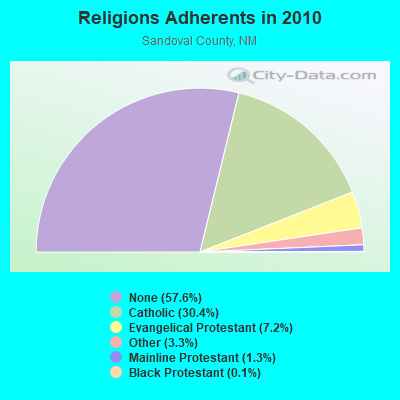
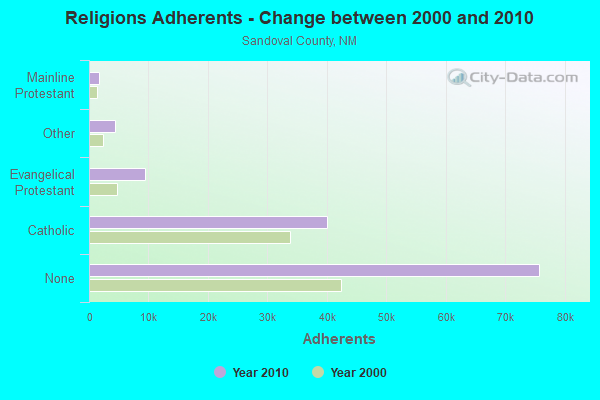
| Religion | Adherents | Congregations |
|---|---|---|
| Catholic | 40,035 | 25 |
| Evangelical Protestant | 9,421 | 44 |
| Other | 4,398 | 18 |
| Mainline Protestant | 1,741 | 9 |
| Black Protestant | 189 | 1 |
| None | 75,777 | - |
Source: Clifford Grammich, Kirk Hadaway, Richard Houseal, Dale E.Jones, Alexei Krindatch, Richie Stanley and Richard H.Taylor. 2012. 2010 U.S.Religion Census: Religious Congregations & Membership Study. Association of Statisticians of American Religious Bodies. Jones, Dale E., et al. 2002. Congregations and Membership in the United States 2000. Nashville, TN: Glenmary Research Center.
Food Environment Statistics:
| Sandoval County: | 1.19 / 10,000 pop. |
| State: | 1.44 / 10,000 pop. |
| This county: | 0.26 / 10,000 pop. |
| New Mexico: | 0.32 / 10,000 pop. |
| Sandoval County: | 2.38 / 10,000 pop. |
| New Mexico: | 4.06 / 10,000 pop. |
| This county: | 3.74 / 10,000 pop. |
| State: | 7.12 / 10,000 pop. |
| Sandoval County: | 6.4% |
| New Mexico: | 6.4% |
| Sandoval County: | 22.2% |
| State: | 22.1% |
Agriculture in Sandoval County:
Average size of farms: 2199 acresAverage value of agricultural products sold per farm: $16,255
Average value of crops sold per acre for harvested cropland: $573.26
The value of nursery, greenhouse, floriculture, and sod as a percentage of the total market value of agricultural products sold: 11.33%
The value of livestock, poultry, and their products as a percentage of the total market value of agricultural products sold: 52.71%
Average total farm production expenses per farm: $18,121
Harvested cropland as a percentage of land in farms: 0.61%
Irrigated harvested cropland as a percentage of land in farms: 94.28%
Average market value of all machinery and equipment per farm: $23,780
The percentage of farms operated by a family or individual: 87.90%
Average age of principal farm operators: 58 years
Average number of cattle and calves per 100 acres of all land in farms: 1.48
Corn for grain: 421 harvested acres
Vegetables: 305 harvested acres
Land in orchards: 220 acres
Tornado activity:
Sandoval County historical area-adjusted tornado activity is significantly below New Mexico state average. It is 52550763.4 times below overall U.S. average.Tornadoes in this county have caused 3 injuries recorded between 1950 and 2004.
On 5/14/1977, a category 3 (max. wind speeds 158-206 mph) tornado injured 2 people and caused between $5000 and $50,000 in damages.
Earthquake activity:
Sandoval County-area historical earthquake activity is significantly above New Mexico state average. It is 853% greater than the overall U.S. average.On 6/28/1992 at 11:57:34, a magnitude 7.6 (6.2 MB, 7.6 MS, 7.3 MW, Depth: 0.7 mi, Class: Major, Intensity: VIII - XII) earthquake occurred 558.9 miles away from Sandoval County center, causing 3 deaths (1 shaking deaths, 2 other deaths) and 400 injuries, causing $100,000,000 total damage and $40,000,000 insured losses
On 8/23/2011 at 05:46:18, a magnitude 5.3 (5.3 MW, Depth: 2.5 mi, Class: Moderate, Intensity: VI - VII) earthquake occurred 157.8 miles away from the county center
On 10/16/1999 at 09:46:44, a magnitude 7.4 (6.3 MB, 7.4 MS, 7.2 MW, 7.3 ML) earthquake occurred 549.0 miles away from the county center
On 1/29/1990 at 13:16:10, a magnitude 4.8 (4.5 MB, 4.8 LG, Depth: 7.5 mi, Class: Light, Intensity: IV - V) earthquake occurred 75.2 miles away from the county center
On 5/19/1940 at 04:36:40, a magnitude 7.2 (7.2 UK) earthquake occurred 531.4 miles away from Sandoval County center, causing $33,000,000 total damage
On 8/10/2005 at 22:08:22, a magnitude 5.0 (5.0 MW, Depth: 3.1 mi) earthquake occurred 147.1 miles away from the county center
Magnitude types: regional Lg-wave magnitude (LG), body-wave magnitude (MB), local magnitude (ML), surface-wave magnitude (MS), moment magnitude (MW)
Most recent natural disasters:
- New Mexico Covid-19 Pandemic, Incident Period: January 20, 2020, FEMA Id: 4529, Natural disaster type: Other
- New Mexico Severe Storms and Flooding, Incident Period: July 27, 2014 to August 05, 2014, Major Disaster (Presidential) Declared DR-4197: October 06, 2014, FEMA Id: 4197, Natural disaster type: Storm, Flood
- New Mexico Severe Storms, Flooding, and Mudslides, Incident Period: September 09, 2013 to September 22, 2013, Major Disaster (Presidential) Declared DR-4152: October 29, 2013, FEMA Id: 4152, Natural disaster type: Storm, Mudslide, Flood
- New Mexico Severe Storms and Flooding, Incident Period: July 23, 2013 to July 29, 2013, Major Disaster (Presidential) Declared DR-4148: September 30, 2013, FEMA Id: 4148, Natural disaster type: Storm, Flood
- New Mexico Flooding, Incident Period: June 22, 2012 to July 12, 2012, Major Disaster (Presidential) Declared DR-4079: August 24, 2012, FEMA Id: 4079, Natural disaster type: Flood
- New Mexico Romero Fire, Incident Period: June 20, 2012 to July 06, 2012, Fire Management Assistance Declared: June 20, 2012, FEMA Id: 2982, Natural disaster type: Fire
- New Mexico Flooding, Incident Period: August 19, 2011 to August 24, 2011, Major Disaster (Presidential) Declared DR-4047: November 23, 2011, FEMA Id: 4047, Natural disaster type: Flood
- New Mexico Las Conchas Fire, Incident Period: June 26, 2011 to August 25, 2011, Fire Management Assistance Declared: June 26, 2011, FEMA Id: 2933, Natural disaster type: Fire
- New Mexico Rio Fire, Incident Period: June 01, 2010 to December 31, 1969, Fire Management Assistance Declared: June 02, 2010, FEMA Id: 2843, Natural disaster type: Fire
- New Mexico Cabazon Fire, Incident Period: May 23, 2010 to December 31, 1969, Fire Management Assistance Declared: May 24, 2010, FEMA Id: 2842, Natural disaster type: Fire
- 8 other natural disasters have been reported since 1953.
The number of natural disasters in Sandoval County (18) is near the US average (15).
Major Disasters (Presidential) Declared: 9
Emergencies Declared: 3
Causes of natural disasters: Floods: 8, Fires: 7, Storms: 6, Drought: 1, Hurricane: 1, Mudslide: 1, Snow: 1, Other: 1 (Note: some incidents may be assigned to more than one category).
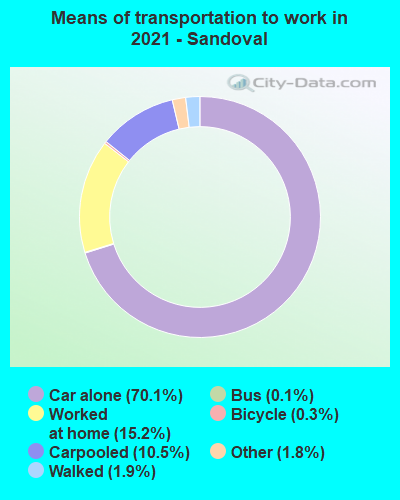
Means of transportation to work:
- Drove a car alone: 30,927 (65.0%)
- Carpooled: 4,900 (10.3%)
- Bus: 63 (0.1%)
- Taxicab, motorcycle, or other means: 1,003 (2.1%)
- Bicycle: 165 (0.3%)
- Walked: 787 (1.7%)
- Worked at home: 10,974 (23.1%)
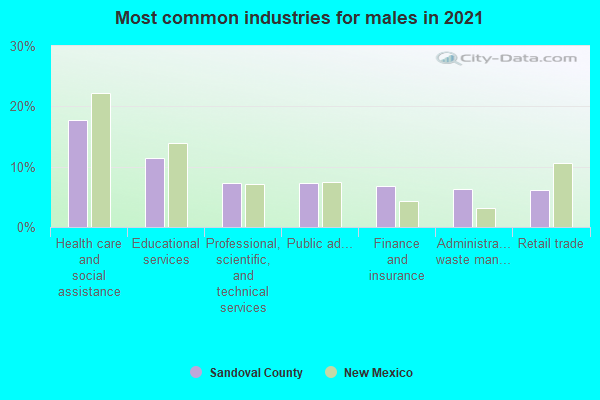
- Health care and social assistance (20%)
- Educational services (13%)
- Retail trade (9%)
- Public administration (7%)
- Professional, scientific, and technical services (7%)
- Finance and insurance (6%)
- Other services, except public administration (6%)
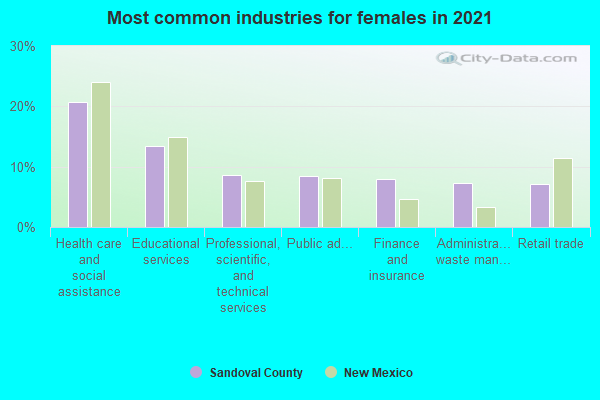
- Health care and social assistance (23%)
- Educational services (15%)
- Retail trade (10%)
- Public administration (8%)
- Professional, scientific, and technical services (8%)
- Finance and insurance (7%)
- Other services, except public administration (7%)
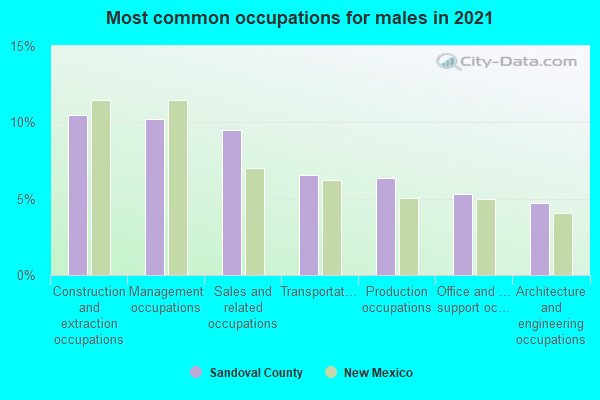
- Construction and extraction occupations (12%)
- Office and administrative support occupations (10%)
- Sales and related occupations (10%)
- Management occupations (9%)
- Architecture and engineering occupations (6%)
- Computer and mathematical occupations (6%)
- Installation, maintenance, and repair occupations (5%)
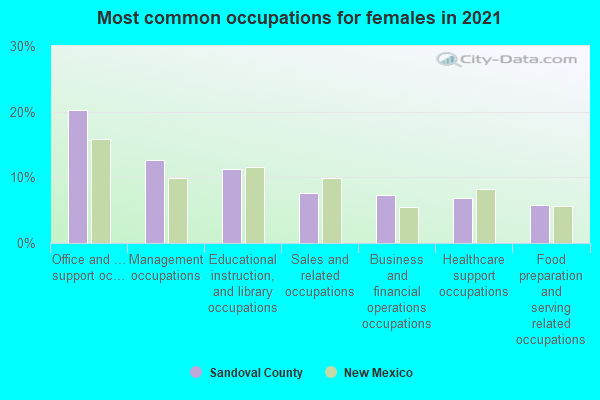
- Office and administrative support occupations (19%)
- Management occupations (13%)
- Educational instruction, and library occupations (11%)
- Health diagnosing and treating practitioners and other technical occupations (9%)
- Sales and related occupations (9%)
- Business and financial operations occupations (7%)
- Healthcare support occupations (6%)
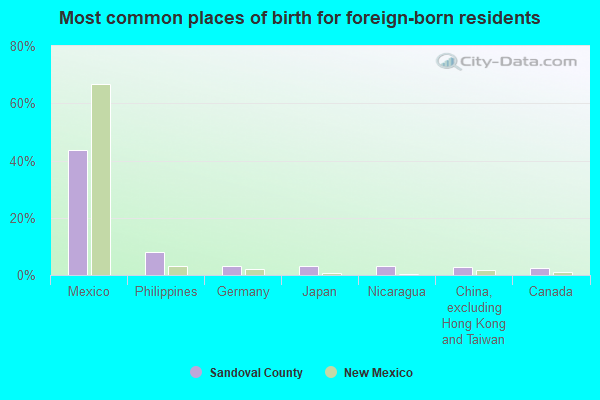
- Mexico (46%)
- Philippines (7%)
- Germany (4%)
- China, excluding Hong Kong and Taiwan (3%)
- Canada (3%)
- Nicaragua (3%)
- Vietnam (3%)
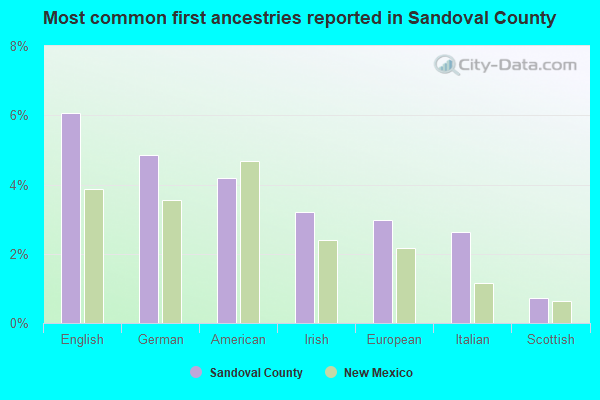
- English (6%)
- German (5%)
- American (4%)
- Irish (3%)
- European (3%)
- Italian (2%)
- Scottish (1%)
People in group quarters in Sandoval County, New Mexico in 2010:
- 327 people in local jails and other municipal confinement facilities
- 170 people in emergency and transitional shelters (with sleeping facilities) for people experiencing homelessness
- 141 people in nursing facilities/skilled-nursing facilities
- 96 people in other noninstitutional facilities
- 13 people in group homes for juveniles (non-correctional)
- 13 people in group homes intended for adults
People in group quarters in Sandoval County, New Mexico in 2000:
- 326 people in other group homes
- 257 people in nursing homes
- 78 people in religious group quarters
- 21 people in other noninstitutional group quarters
- 13 people in other nonhousehold living situations
9.68% of this county's 2021 resident taxpayers lived in other counties in 2020 ($69,075 average adjusted gross income)
| Here: | 9.68% |
| New Mexico average: | 6.50% |
0.05% of residents moved from foreign countries ($409 average AGI)
Sandoval County: 0.05% New Mexico average: 0.07%
6.07% relocated from other counties in New Mexico ($37,444 average AGI)
3.55% relocated from other states ($31,223 average AGI)
Sandoval County: 3.55% New Mexico average: 3.84%
Top counties from which taxpayers relocated into this county between 2020 and 2021:
| from Bernalillo County, NM | |
| from Santa Fe County, NM | |
| from Maricopa County, AZ | |
| from Los Angeles County, CA | |
| from Valencia County, NM | |
| from Dona Ana County, NM | |
| from McKinley County, NM |
7.68% of this county's 2020 resident taxpayers moved to other counties in 2021 ($63,081 average adjusted gross income)
| Here: | 7.68% |
| New Mexico average: | 6.53% |
10 or fewer of this county's residents moved to foreign countries.
4.44% relocated to other counties in New Mexico ($31,035 average AGI)
3.24% relocated to other states ($32,046 average AGI)
Sandoval County: 3.24% New Mexico average: 3.90%
Top counties to which taxpayers relocated from this county between 2020 and 2021:
| to Bernalillo County, NM | |
| to Santa Fe County, NM | |
| to Maricopa County, AZ | |
| to Valencia County, NM | |
| to El Paso County, TX | |
| to Clark County, NV | |
| to Dona Ana County, NM |
Births per 1000 population from 1990 to 1999: 16.3
Births per 1000 population from 2000 to 2009: 9.2
Births per 1000 population from 2010 to 2022: 5.3
Deaths per 1000 population from 1990 to 1999: 5.9
Deaths per 1000 population from 2000 to 2009: 6.5
Deaths per 1000 population from 2010 to 2020: 7.7

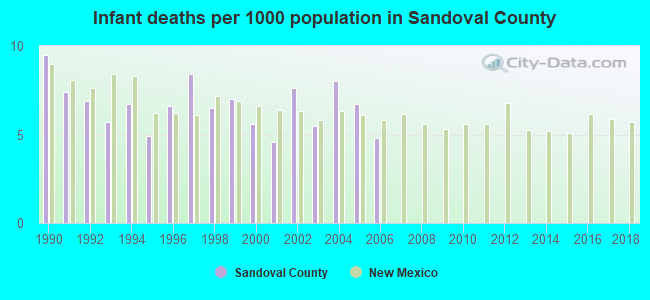
Infant deaths per 1000 live births from 1990 to 1999: 7.0
Infant deaths per 1000 live births from 2000 to 2006: 6.1
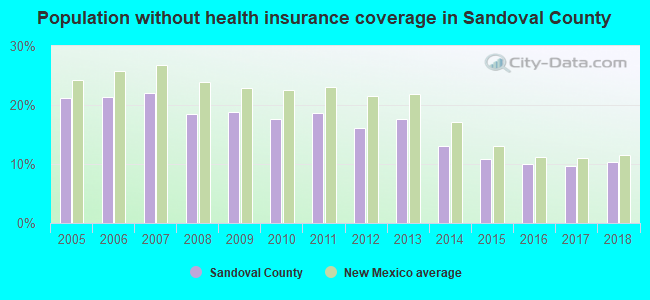
Persons under 19 years old without health insurance coverage in 2018: 5.0%


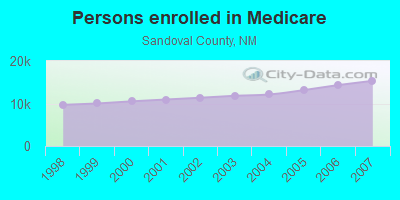
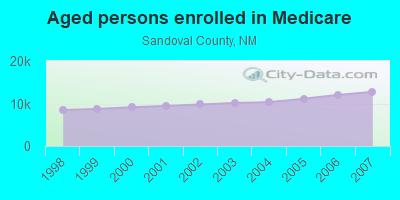
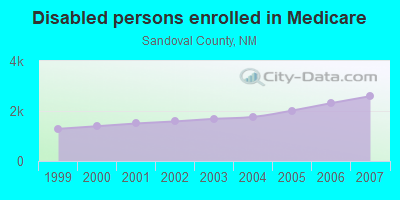
Persons enrolled in hospital insurance and/or supplemental medical insurance (Medicare) in July 1, 2007: 15,335 (12,740 aged, 2,595 disabled)
Children under 18 without health insurance coverage in 2007: 4,607 (14%)
Most common underlying causes of death in Sandoval County, New Mexico in 1999 - 2019:
- Atherosclerotic heart disease (838)
- Bronchus or lung, unspecified - Malignant neoplasms (780)
- Atherosclerotic cardiovascular disease, so described (778)
- Chronic obstructive pulmonary disease, unspecified (740)
- Acute myocardial infarction, unspecified (606)
- Unspecified dementia (536)
- Alzheimer disease, unspecified (450)
- Stroke, not specified as haemorrhage or infarction (341)
- Unspecified diabetes mellitus, without complications (318)
- Breast, unspecified - Malignant neoplasms (292)
Population without health insurance coverage in 2000: 19%
Children under 18 without health insurance coverage in 2000: 15%
Medical specialist MDs per 100,000 population in 2005: 603
Dentists per 100,000 population in 1998: 2
Total births per 100,000 population, July 2005 - July 2006 : 12
Total deaths per 100,000 population, July 2005 - July 2006: 44
Limited-service eating places per 100,000 population in 2005 : 7
EPA green book nonattainment status in 2004-2006: 1
Homicides per 1,000,000 population from 2000 to 2006: 54.6. This is less than state average.
Suicides per 1,000,000 population from 2000 to 2006: 139.3. This is less than state average.
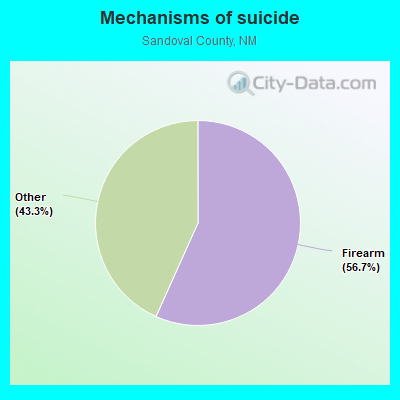
- Firearm - 79.0
- Other - 60.3
Household type by relationship:
Households: 153,501- Male householders: 28,981 (6,369 living alone), Female householders: 28,633 (6,122 living alone)
31,396 spouses (30,866 opposite-sex spouses), 4,377 unmarried partners, (4,316 opposite-sex unmarried partners), 43,429 children (39,559 natural, 1,886 adopted, 1,984 stepchildren), 6,354 grandchildren, 2,069 brothers or sisters, 1,498 parents, 0 foster children, 2,782 other relatives, 3,148 non-relatives
- In group quarters: 834
Size of family households: 20,110 2-persons, 8,745 3-persons, 5,420 4-persons, 4,350 5-persons, 1,681 6-persons, 1,681 7-or-more-persons.
Size of nonfamily households: 12,491 1-person, 2,801 2-persons, 220 3-persons, 115 5-persons.
18,919 married couples with children.
7,183 single-parent households (1,536 men, 5,647 women).
76.8% of residents of Sandoval speak English at home.
14.9% of residents speak Spanish at home (71% speak English very well, 20% speak English well, 7% speak English not well, 2% don't speak English at all).
0.8% of residents speak other Indo-European language at home (81% speak English very well, 15% speak English well, 4% speak English not well).
0.9% of residents speak Asian or Pacific Island language at home (64% speak English very well, 29% speak English well, 7% speak English not well).
6.4% of residents speak other language at home (71% speak English very well, 23% speak English well, 6% speak English not well).
In fiscal year 2004:
Federal Government expenditure: $427,594,000 ($4,187 per capita)
Department of Defense expenditure: $12,200,000
Federal direct payments to individuals for retirement and disability: $210,802,000
Federal other direct payments to individuals: $58,758,000
Federal direct payments not to individuals: $4,288,000
Federal grants: $119,764,000
Federal procurement contracts: $16,607,000 ($3,444,000 Department of Defense)
Federal salaries and wages: $17,374,000 ($670,000 Department of Defense)
Federal Government direct loans: $648,000
Federal guaranteed/insured loans: $172,061,000
Federal Government insurance: $66,082,000
Population change from April 1, 2000 to July 1, 2005:
Births: 6,682| Here: | 62 per 1000 residents |
| State: | 74 per 1000 residents |
Deaths: 2,940
| Here: | 27 per 1000 residents |
| State: | 36 per 1000 residents |
Net international migration: +413
| Here: | +4 per 1000 residents |
| State: | +15 per 1000 residents |
Net internal migration: +12,932
| Here: | +120 per 1000 residents |
| State: | +5 per 1000 residents |
Total withdrawal of fresh water for public supply: 11.08 millions of gallons per day (99% from ground, 1% from surface)
| Here: | 6.1 |
| State: | 5.9 |
| Here: | 4.8 |
| State: | 4.2 |
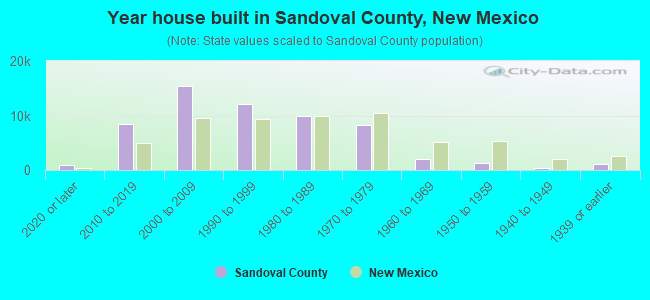
- Year house built in Sandoval County, New Mexico
- 2,3762020 or later
- 9,9492010 to 2019
- 15,4402000 to 2009
- 10,1531990 to 1999
- 11,3781980 to 1989
- 7,0121970 to 1979
- 2,8281960 to 1969
- 1,0301950 to 1959
- 921940 to 1949
- 1,2171939 or earlier
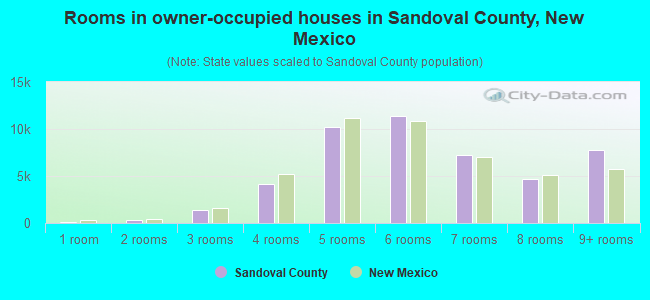
- Rooms in owner-occupied houses in Sandoval County, New Mexico
- 2601 room
- 4662 rooms
- 8033 rooms
- 6,6154 rooms
- 10,4875 rooms
- 10,2956 rooms
- 8,1297 rooms
- 6,6548 rooms
- 5,8069+ rooms
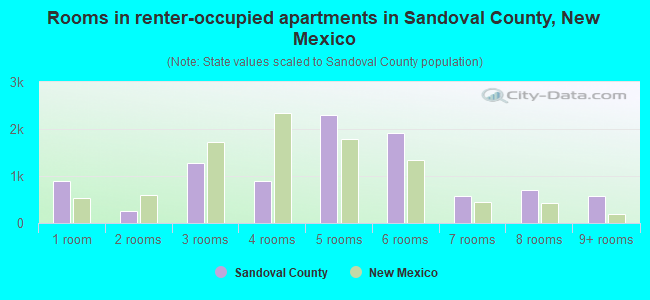
- Rooms in renter-occupied apartments in Sandoval County, New Mexico
- 3831 room
- 6482 rooms
- 4773 rooms
- 1,8294 rooms
- 2,4945 rooms
- 9186 rooms
- 5637 rooms
- 3358 rooms
- 4529+ rooms
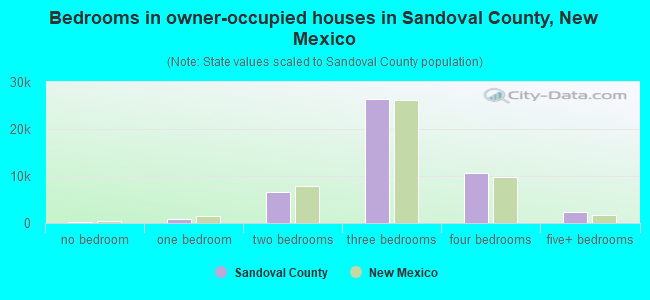
- Bedrooms in owner-occupied houses in Sandoval County, New Mexico
- 512no bedroom
- 1,7101 bedroom
- 6,7052 bedrooms
- 25,5173 bedrooms
- 11,7954 bedrooms
- 3,2765+ bedrooms
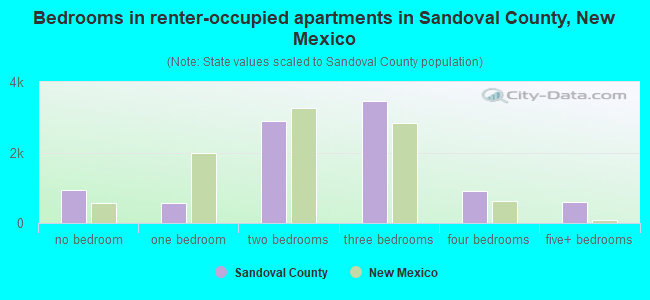
- Bedrooms in renter-occupied apartments in Sandoval County, New Mexico
- 428no bedroom
- 9591 bedroom
- 1,7492 bedrooms
- 4,1063 bedrooms
- 4474 bedrooms
- 4105+ bedrooms
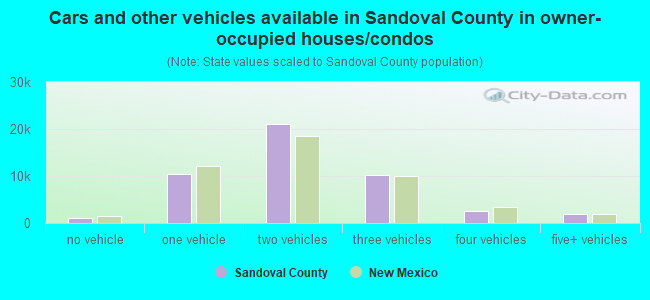
- Cars and other vehicles available in Sandoval County in owner-occupied houses/condos
- 817no vehicle
- 10,9971 vehicle
- 19,1962 vehicles
- 11,6133 vehicles
- 3,8084 vehicles
- 3,0845+ vehicles
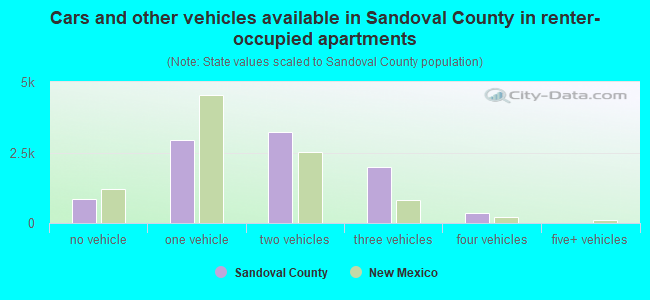
- Cars and other vehicles available in Sandoval County in renter-occupied apartments
- 1,170no vehicle
- 2,8551 vehicle
- 3,1942 vehicles
- 8293 vehicles
- 124 vehicles
- 395+ vehicles
90.2% of Sandoval County residents lived in the same house 1 years ago.
Out of people who lived in different houses, 23% lived in this county.
Out of people who lived in different counties, 62% lived in New Mexico.
| Sandoval County: | 90.2% |
| State average: | 88.2% |
Place of birth for U.S.-born residents:
- This state: 83,347
- Other state: 57,237
- Northeast: 8,150
- Midwest: 13,586
- South: 12,300
- West: 23,201
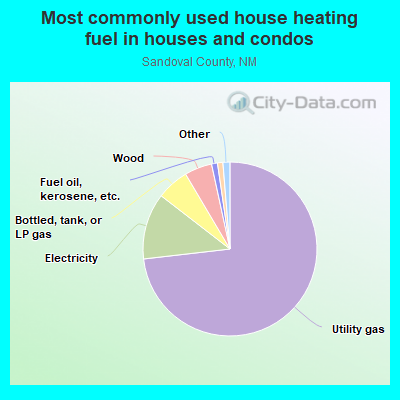
- 76.3%Utility gas
- 11.0%Electricity
- 5.7%Bottled, tank, or LP gas
- 4.8%Wood
- 1.0%Other fuel
- 0.9%Solar energy
- 0.2%Fuel oil, kerosene, etc.
- 0.1%No fuel used
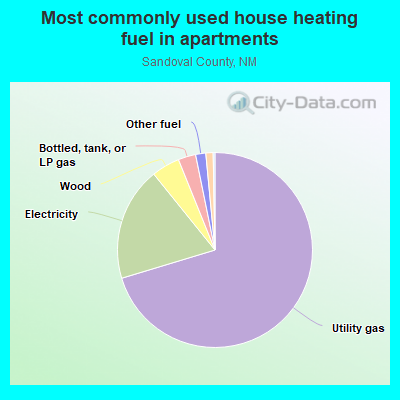
- 68.2%Utility gas
- 15.8%Electricity
- 8.8%Bottled, tank, or LP gas
- 5.9%Wood
- 0.8%Other fuel
- 0.2%Coal or coke
- 0.1%Solar energy
Private vs. public school enrollment:
| Here: | 9.8% |
| New Mexico: | 10.2% |
| Here: | 7.5% |
| New Mexico: | 10.0% |
| Here: | 8.4% |
| New Mexico: | 12.3% |


Sandoval County government finances - Expenditure in 2018:
- Bond Funds - Cash and Securities: $11,285,000
Cash and Securities: $242,000
- Charges - Solid Waste Management: $4,030,000
Solid Waste Management: $3,425,000
Other: $1,543,000
Other: $1,257,000
- Construction - Correctional Institutions: $2,830,000
Public Welfare - Other: $2,050,000
Local Fire Protection: $571,000
Police Protection: $446,000
General - Other: $431,000
Parks and Recreation: $409,000
Public Welfare - Other: $282,000
Regular Highways: $199,000
Solid Waste Management: $183,000
Libraries: $106,000
General Public Buildings: $51,000
Local Fire Protection: $22,000
- Current Operations - Correctional Institutions: $10,605,000
Central Staff Services: $9,235,000
Correctional Institutions: $8,598,000
General - Other: $8,410,000
Central Staff Services: $5,997,000
Police Protection: $5,350,000
General - Other: $5,032,000
Public Welfare - Other: $4,786,000
Financial Administration: $4,252,000
Police Protection: $4,186,000
Public Welfare - Other: $4,185,000
Local Fire Protection: $3,755,000
Local Fire Protection: $3,732,000
Financial Administration: $3,359,000
Health - Other: $3,078,000
Public Welfare, Vendor Payments for Medical Care: $3,056,000
Regular Highways: $2,966,000
Solid Waste Management: $2,611,000
Natural Resources - Other: $2,152,000
Solid Waste Management: $1,648,000
General Public Buildings: $1,564,000
Libraries: $1,545,000
Regular Highways: $1,426,000
General Public Buildings: $1,306,000
Judicial and Legal Services: $457,000
Public Welfare, Vendor Payments for Other Purposes: $413,000
Health - Other: $215,000
Parks and Recreation: $148,000
Housing and Community Development: $138,000
Parks and Recreation: $80,000
Judicial and Legal Services: $64,000
- Federal Intergovernmental - Other: $5,516,000
General Local Government Support: $2,478,000
General Local Government Support: $2,416,000
Other: $1,303,000
Public Welfare: $784,000
Public Welfare: $387,000
Housing and Community Development: $309,000
Highways: $153,000
Highways: $139,000
Health and Hospitals: $28,000
Natural Resources: $19,000
Health and Hospitals: $8,000
- General - Interest on Debt: $3,428,000
Interest on Debt: $2,339,000
- Local Intergovernmental - Other: $1,377,000
Other: $1,282,000
Public Welfare: $209,000
Public Welfare: $54,000
- Long Term Debt - Beginning Outstanding - Unspecified Public Purpose: $85,700,000
Beginning Outstanding - Unspecified Public Purpose: $84,532,000
Outstanding Unspecified Public Purpose: $63,462,000
Outstanding Unspecified Public Purpose: $59,630,000
Retired Unspecified Public Purpose: $26,070,000
Retired Unspecified Public Purpose: $24,915,000
Issue, Unspecified Public Purpose: $3,845,000
- Miscellaneous - General Revenue - Other: $16,929,000
General Revenue - Other: $9,521,000
Interest Earnings: $1,848,000
Rents: $831,000
Rents: $466,000
Interest Earnings: $165,000
Sale of Property: $27,000
Special Assessments: $23,000
Donations From Private Sources: $6,000
Donations From Private Sources: $3,000
Fines and Forfeits: $1,000
- Other Capital Outlay - Regular Highways: $2,513,000
Police Protection: $1,601,000
Solid Waste Management: $1,390,000
Libraries: $909,000
Local Fire Protection: $875,000
Correctional Institutions: $632,000
Central Staff Services: $584,000
Correctional Institutions: $384,000
Housing and Community Development: $100,000
Parks and Recreation: $60,000
Public Welfare - Other: $23,000
- Other Funds - Cash and Securities: $63,355,000
Cash and Securities: $31,162,000
- Sinking Funds - Cash and Securities: $7,229,000
Cash and Securities: $6,358,000
- State Intergovernmental - Public Welfare: $5,413,000
General Local Government Support: $5,075,000
General Local Government Support: $3,983,000
Public Welfare: $3,825,000
Other: $2,177,000
Other: $1,894,000
Highways: $1,474,000
Highways: $1,465,000
Housing and Community Development: $414,000
Health and Hospitals: $167,000
Health and Hospitals: $124,000
- Tax - Property: $32,087,000
Property: $30,403,000
General Sales and Gross Receipts: $10,671,000
General Sales and Gross Receipts: $5,354,000
Other: $18,000
Other: $9,000
Occupation and Business License - Other: $8,000
Occupation and Business License - Other: $8,000
- Total Salaries and Wages: $20,827,000
: $20,823,000
Sandoval County government finances - Revenue in 2018:
- Bond Funds - Cash and Securities: $11,285,000
Cash and Securities: $242,000
- Charges - Solid Waste Management: $4,030,000
Solid Waste Management: $3,425,000
Other: $1,543,000
Other: $1,257,000
- Construction - Correctional Institutions: $2,830,000
Public Welfare - Other: $2,050,000
Local Fire Protection: $571,000
Police Protection: $446,000
General - Other: $431,000
Parks and Recreation: $409,000
Public Welfare - Other: $282,000
Regular Highways: $199,000
Solid Waste Management: $183,000
Libraries: $106,000
General Public Buildings: $51,000
Local Fire Protection: $22,000
- Current Operations - Correctional Institutions: $10,605,000
Central Staff Services: $9,235,000
Correctional Institutions: $8,598,000
General - Other: $8,410,000
Central Staff Services: $5,997,000
Police Protection: $5,350,000
General - Other: $5,032,000
Public Welfare - Other: $4,786,000
Financial Administration: $4,252,000
Police Protection: $4,186,000
Public Welfare - Other: $4,185,000
Local Fire Protection: $3,755,000
Local Fire Protection: $3,732,000
Financial Administration: $3,359,000
Health - Other: $3,078,000
Public Welfare, Vendor Payments for Medical Care: $3,056,000
Regular Highways: $2,966,000
Solid Waste Management: $2,611,000
Natural Resources - Other: $2,152,000
Solid Waste Management: $1,648,000
General Public Buildings: $1,564,000
Libraries: $1,545,000
Regular Highways: $1,426,000
General Public Buildings: $1,306,000
Judicial and Legal Services: $457,000
Public Welfare, Vendor Payments for Other Purposes: $413,000
Health - Other: $215,000
Parks and Recreation: $148,000
Housing and Community Development: $138,000
Parks and Recreation: $80,000
Judicial and Legal Services: $64,000
- Federal Intergovernmental - Other: $5,516,000
General Local Government Support: $2,478,000
General Local Government Support: $2,416,000
Other: $1,303,000
Public Welfare: $784,000
Public Welfare: $387,000
Housing and Community Development: $309,000
Highways: $153,000
Highways: $139,000
Health and Hospitals: $28,000
Natural Resources: $19,000
Health and Hospitals: $8,000
- General - Interest on Debt: $3,428,000
Interest on Debt: $2,339,000
- Local Intergovernmental - Other: $1,377,000
Other: $1,282,000
Public Welfare: $209,000
Public Welfare: $54,000
- Long Term Debt - Beginning Outstanding - Unspecified Public Purpose: $85,700,000
Beginning Outstanding - Unspecified Public Purpose: $84,532,000
Outstanding Unspecified Public Purpose: $63,462,000
Outstanding Unspecified Public Purpose: $59,630,000
Retired Unspecified Public Purpose: $26,070,000
Retired Unspecified Public Purpose: $24,915,000
Issue, Unspecified Public Purpose: $3,845,000
- Miscellaneous - General Revenue - Other: $16,929,000
General Revenue - Other: $9,521,000
Interest Earnings: $1,848,000
Rents: $831,000
Rents: $466,000
Interest Earnings: $165,000
Sale of Property: $27,000
Special Assessments: $23,000
Donations From Private Sources: $6,000
Donations From Private Sources: $3,000
Fines and Forfeits: $1,000
- Other Capital Outlay - Regular Highways: $2,513,000
Police Protection: $1,601,000
Solid Waste Management: $1,390,000
Libraries: $909,000
Local Fire Protection: $875,000
Correctional Institutions: $632,000
Central Staff Services: $584,000
Correctional Institutions: $384,000
Housing and Community Development: $100,000
Parks and Recreation: $60,000
Public Welfare - Other: $23,000
- Other Funds - Cash and Securities: $63,355,000
Cash and Securities: $31,162,000
- Sinking Funds - Cash and Securities: $7,229,000
Cash and Securities: $6,358,000
- State Intergovernmental - Public Welfare: $5,413,000
General Local Government Support: $5,075,000
General Local Government Support: $3,983,000
Public Welfare: $3,825,000
Other: $2,177,000
Other: $1,894,000
Highways: $1,474,000
Highways: $1,465,000
Housing and Community Development: $414,000
Health and Hospitals: $167,000
Health and Hospitals: $124,000
- Tax - Property: $32,087,000
Property: $30,403,000
General Sales and Gross Receipts: $10,671,000
General Sales and Gross Receipts: $5,354,000
Other: $18,000
Other: $9,000
Occupation and Business License - Other: $8,000
Occupation and Business License - Other: $8,000
- Total Salaries and Wages: $20,827,000
: $20,823,000
Sandoval County government finances - Debt in 2018:
- Bond Funds - Cash and Securities: $11,285,000
Cash and Securities: $242,000
- Charges - Solid Waste Management: $4,030,000
Solid Waste Management: $3,425,000
Other: $1,543,000
Other: $1,257,000
- Construction - Correctional Institutions: $2,830,000
Public Welfare - Other: $2,050,000
Local Fire Protection: $571,000
Police Protection: $446,000
General - Other: $431,000
Parks and Recreation: $409,000
Public Welfare - Other: $282,000
Regular Highways: $199,000
Solid Waste Management: $183,000
Libraries: $106,000
General Public Buildings: $51,000
Local Fire Protection: $22,000
- Current Operations - Correctional Institutions: $10,605,000
Central Staff Services: $9,235,000
Correctional Institutions: $8,598,000
General - Other: $8,410,000
Central Staff Services: $5,997,000
Police Protection: $5,350,000
General - Other: $5,032,000
Public Welfare - Other: $4,786,000
Financial Administration: $4,252,000
Police Protection: $4,186,000
Public Welfare - Other: $4,185,000
Local Fire Protection: $3,755,000
Local Fire Protection: $3,732,000
Financial Administration: $3,359,000
Health - Other: $3,078,000
Public Welfare, Vendor Payments for Medical Care: $3,056,000
Regular Highways: $2,966,000
Solid Waste Management: $2,611,000
Natural Resources - Other: $2,152,000
Solid Waste Management: $1,648,000
General Public Buildings: $1,564,000
Libraries: $1,545,000
Regular Highways: $1,426,000
General Public Buildings: $1,306,000
Judicial and Legal Services: $457,000
Public Welfare, Vendor Payments for Other Purposes: $413,000
Health - Other: $215,000
Parks and Recreation: $148,000
Housing and Community Development: $138,000
Parks and Recreation: $80,000
Judicial and Legal Services: $64,000
- Federal Intergovernmental - Other: $5,516,000
General Local Government Support: $2,478,000
General Local Government Support: $2,416,000
Other: $1,303,000
Public Welfare: $784,000
Public Welfare: $387,000
Housing and Community Development: $309,000
Highways: $153,000
Highways: $139,000
Health and Hospitals: $28,000
Natural Resources: $19,000
Health and Hospitals: $8,000
- General - Interest on Debt: $3,428,000
Interest on Debt: $2,339,000
- Local Intergovernmental - Other: $1,377,000
Other: $1,282,000
Public Welfare: $209,000
Public Welfare: $54,000
- Long Term Debt - Beginning Outstanding - Unspecified Public Purpose: $85,700,000
Beginning Outstanding - Unspecified Public Purpose: $84,532,000
Outstanding Unspecified Public Purpose: $63,462,000
Outstanding Unspecified Public Purpose: $59,630,000
Retired Unspecified Public Purpose: $26,070,000
Retired Unspecified Public Purpose: $24,915,000
Issue, Unspecified Public Purpose: $3,845,000
- Miscellaneous - General Revenue - Other: $16,929,000
General Revenue - Other: $9,521,000
Interest Earnings: $1,848,000
Rents: $831,000
Rents: $466,000
Interest Earnings: $165,000
Sale of Property: $27,000
Special Assessments: $23,000
Donations From Private Sources: $6,000
Donations From Private Sources: $3,000
Fines and Forfeits: $1,000
- Other Capital Outlay - Regular Highways: $2,513,000
Police Protection: $1,601,000
Solid Waste Management: $1,390,000
Libraries: $909,000
Local Fire Protection: $875,000
Correctional Institutions: $632,000
Central Staff Services: $584,000
Correctional Institutions: $384,000
Housing and Community Development: $100,000
Parks and Recreation: $60,000
Public Welfare - Other: $23,000
- Other Funds - Cash and Securities: $63,355,000
Cash and Securities: $31,162,000
- Sinking Funds - Cash and Securities: $7,229,000
Cash and Securities: $6,358,000
- State Intergovernmental - Public Welfare: $5,413,000
General Local Government Support: $5,075,000
General Local Government Support: $3,983,000
Public Welfare: $3,825,000
Other: $2,177,000
Other: $1,894,000
Highways: $1,474,000
Highways: $1,465,000
Housing and Community Development: $414,000
Health and Hospitals: $167,000
Health and Hospitals: $124,000
- Tax - Property: $32,087,000
Property: $30,403,000
General Sales and Gross Receipts: $10,671,000
General Sales and Gross Receipts: $5,354,000
Other: $18,000
Other: $9,000
Occupation and Business License - Other: $8,000
Occupation and Business License - Other: $8,000
- Total Salaries and Wages: $20,827,000
: $20,823,000
Sandoval County government finances - Cash and Securities in 2018:
- Bond Funds - Cash and Securities: $11,285,000
Cash and Securities: $242,000
- Charges - Solid Waste Management: $4,030,000
Solid Waste Management: $3,425,000
Other: $1,543,000
Other: $1,257,000
- Construction - Correctional Institutions: $2,830,000
Public Welfare - Other: $2,050,000
Local Fire Protection: $571,000
Police Protection: $446,000
General - Other: $431,000
Parks and Recreation: $409,000
Public Welfare - Other: $282,000
Regular Highways: $199,000
Solid Waste Management: $183,000
Libraries: $106,000
General Public Buildings: $51,000
Local Fire Protection: $22,000
- Current Operations - Correctional Institutions: $10,605,000
Central Staff Services: $9,235,000
Correctional Institutions: $8,598,000
General - Other: $8,410,000
Central Staff Services: $5,997,000
Police Protection: $5,350,000
General - Other: $5,032,000
Public Welfare - Other: $4,786,000
Financial Administration: $4,252,000
Police Protection: $4,186,000
Public Welfare - Other: $4,185,000
Local Fire Protection: $3,755,000
Local Fire Protection: $3,732,000
Financial Administration: $3,359,000
Health - Other: $3,078,000
Public Welfare, Vendor Payments for Medical Care: $3,056,000
Regular Highways: $2,966,000
Solid Waste Management: $2,611,000
Natural Resources - Other: $2,152,000
Solid Waste Management: $1,648,000
General Public Buildings: $1,564,000
Libraries: $1,545,000
Regular Highways: $1,426,000
General Public Buildings: $1,306,000
Judicial and Legal Services: $457,000
Public Welfare, Vendor Payments for Other Purposes: $413,000
Health - Other: $215,000
Parks and Recreation: $148,000
Housing and Community Development: $138,000
Parks and Recreation: $80,000
Judicial and Legal Services: $64,000
- Federal Intergovernmental - Other: $5,516,000
General Local Government Support: $2,478,000
General Local Government Support: $2,416,000
Other: $1,303,000
Public Welfare: $784,000
Public Welfare: $387,000
Housing and Community Development: $309,000
Highways: $153,000
Highways: $139,000
Health and Hospitals: $28,000
Natural Resources: $19,000
Health and Hospitals: $8,000
- General - Interest on Debt: $3,428,000
Interest on Debt: $2,339,000
- Local Intergovernmental - Other: $1,377,000
Other: $1,282,000
Public Welfare: $209,000
Public Welfare: $54,000
- Long Term Debt - Beginning Outstanding - Unspecified Public Purpose: $85,700,000
Beginning Outstanding - Unspecified Public Purpose: $84,532,000
Outstanding Unspecified Public Purpose: $63,462,000
Outstanding Unspecified Public Purpose: $59,630,000
Retired Unspecified Public Purpose: $26,070,000
Retired Unspecified Public Purpose: $24,915,000
Issue, Unspecified Public Purpose: $3,845,000
- Miscellaneous - General Revenue - Other: $16,929,000
General Revenue - Other: $9,521,000
Interest Earnings: $1,848,000
Rents: $831,000
Rents: $466,000
Interest Earnings: $165,000
Sale of Property: $27,000
Special Assessments: $23,000
Donations From Private Sources: $6,000
Donations From Private Sources: $3,000
Fines and Forfeits: $1,000
- Other Capital Outlay - Regular Highways: $2,513,000
Police Protection: $1,601,000
Solid Waste Management: $1,390,000
Libraries: $909,000
Local Fire Protection: $875,000
Correctional Institutions: $632,000
Central Staff Services: $584,000
Correctional Institutions: $384,000
Housing and Community Development: $100,000
Parks and Recreation: $60,000
Public Welfare - Other: $23,000
- Other Funds - Cash and Securities: $63,355,000
Cash and Securities: $31,162,000
- Sinking Funds - Cash and Securities: $7,229,000
Cash and Securities: $6,358,000
- State Intergovernmental - Public Welfare: $5,413,000
General Local Government Support: $5,075,000
General Local Government Support: $3,983,000
Public Welfare: $3,825,000
Other: $2,177,000
Other: $1,894,000
Highways: $1,474,000
Highways: $1,465,000
Housing and Community Development: $414,000
Health and Hospitals: $167,000
Health and Hospitals: $124,000
- Tax - Property: $32,087,000
Property: $30,403,000
General Sales and Gross Receipts: $10,671,000
General Sales and Gross Receipts: $5,354,000
Other: $18,000
Other: $9,000
Occupation and Business License - Other: $8,000
Occupation and Business License - Other: $8,000
- Total Salaries and Wages: $20,827,000
: $20,823,000
Supplemental Security Income (SSI) in 2006:
- Total number of recipients: 2,198
- Number of aged recipients: 435
- Number of blind and disabled recipients: 1,763
- Number of recipients under 18: 335
- Number of recipients between 18 and 64: 1,111
- Number of recipients older than 64: 752
- Number of recipients also receiving OASDI: 845
- Amount of payments (thousands of dollars): 964
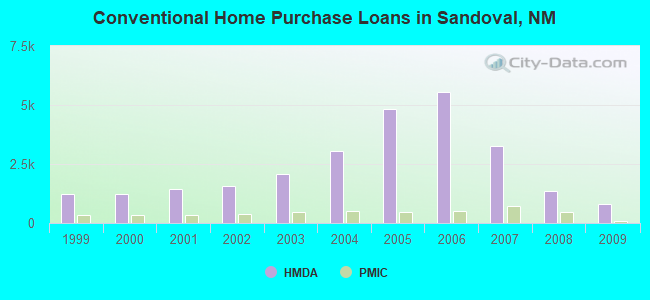
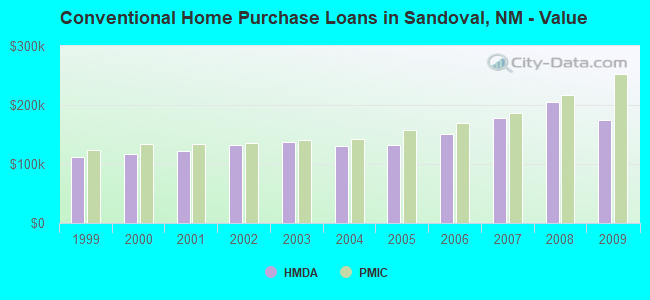
| Home Mortgage Disclosure Act Aggregated Statistics For Year 2009 (Based on 27 full tracts) | ||||||||||||
| A) FHA, FSA/RHS & VA Home Purchase Loans | B) Conventional Home Purchase Loans | C) Refinancings | D) Home Improvement Loans | F) Non-occupant Loans on < 5 Family Dwellings (A B C & D) | G) Loans On Manufactured Home Dwelling (A B C & D) | |||||||
|---|---|---|---|---|---|---|---|---|---|---|---|---|
| Number | Average Value | Number | Average Value | Number | Average Value | Number | Average Value | Number | Average Value | Number | Average Value | |
| LOANS ORIGINATED | 1,119 | $168,812 | 814 | $175,393 | 3,548 | $190,061 | 193 | $90,720 | 272 | $165,077 | 77 | $89,844 |
| APPLICATIONS APPROVED, NOT ACCEPTED | 58 | $178,000 | 89 | $200,674 | 405 | $195,175 | 24 | $99,625 | 25 | $122,640 | 17 | $92,765 |
| APPLICATIONS DENIED | 303 | $163,604 | 149 | $190,195 | 1,431 | $199,939 | 242 | $39,062 | 120 | $164,375 | 83 | $83,880 |
| APPLICATIONS WITHDRAWN | 133 | $168,684 | 117 | $183,162 | 1,173 | $191,476 | 38 | $118,342 | 74 | $150,095 | 22 | $111,773 |
| FILES CLOSED FOR INCOMPLETENESS | 8 | $139,875 | 13 | $183,231 | 172 | $176,610 | 9 | $130,333 | 14 | $151,500 | 8 | $91,625 |
| Private Mortgage Insurance Companies Aggregated Statistics For Year 2009 (Based on 20 full tracts) | ||||||||
| A) Conventional Home Purchase Loans | B) Refinancings | C) Non-occupant Loans on < 5 Family Dwellings (A & B) | D) Loans On Manufactured Home Dwelling (A & B) | |||||
|---|---|---|---|---|---|---|---|---|
| Number | Average Value | Number | Average Value | Number | Average Value | Number | Average Value | |
| LOANS ORIGINATED | 98 | $253,143 | 122 | $224,434 | 6 | $248,167 | 0 | $0 |
| APPLICATIONS APPROVED, NOT ACCEPTED | 72 | $244,889 | 49 | $248,020 | 9 | $185,222 | 0 | $0 |
| APPLICATIONS DENIED | 19 | $206,842 | 24 | $268,250 | 0 | $0 | 0 | $0 |
| APPLICATIONS WITHDRAWN | 4 | $245,000 | 7 | $258,714 | 1 | $143,000 | 1 | $143,000 |
| FILES CLOSED FOR INCOMPLETENESS | 4 | $230,250 | 6 | $281,500 | 0 | $0 | 0 | $0 |
| Most common first names in Sandoval County, NM among deceased individuals | ||
| Name | Count | Lived (average) |
|---|---|---|
| Jose | 114 | 78.4 years |
| Mary | 109 | 75.8 years |
| John | 105 | 72.2 years |
| Joe | 74 | 73.9 years |
| Juan | 60 | 78.4 years |
| Frank | 57 | 74.9 years |
| James | 55 | 69.1 years |
| Robert | 53 | 69.4 years |
| William | 53 | 73.6 years |
| Margaret | 39 | 77.2 years |
| Most common last names in Sandoval County, NM among deceased individuals | ||
| Last name | Count | Lived (average) |
|---|---|---|
| Garcia | 137 | 73.3 years |
| Montoya | 131 | 75.4 years |
| Chavez | 106 | 71.5 years |
| Sandoval | 103 | 71.1 years |
| Lucero | 97 | 71.4 years |
| Toledo | 73 | 68.8 years |
| Trujillo | 70 | 72.0 years |
| Martinez | 65 | 73.4 years |
| Sanchez | 64 | 76.3 years |
| Gonzales | 58 | 68.4 years |
| Businesses in Sandoval County, NM | ||||
| Name | Count | Name | Count | |
|---|---|---|---|---|
| Albertsons | 1 | Little Caesars Pizza | 1 | |
| AutoZone | 1 | MasterBrand Cabinets | 3 | |
| Burger King | 1 | McDonald's | 3 | |
| Circle K | 2 | Motel 6 | 1 | |
| Cricket Wireless | 1 | Nike | 1 | |
| Curves | 1 | Pizza Hut | 1 | |
| Days Inn | 1 | Quiznos | 1 | |
| Decora Cabinetry | 3 | SONIC Drive-In | 1 | |
| Dennys | 1 | Sprint Nextel | 1 | |
| FedEx | 4 | Starbucks | 1 | |
| Firestone Complete Auto Care | 1 | Super 8 | 1 | |
| GameStop | 1 | Taco Bell | 1 | |
| H&R Block | 2 | True Value | 2 | |
| Holiday Inn | 1 | U-Haul | 5 | |
| IHOP | 1 | UPS | 3 | |
| Jimmy John's | 2 | Walgreens | 2 | |
| KFC | 1 | Walmart | 1 | |
Sandoval County on our top lists:
- #6 on the list of "Top 101 counties with highest percentage of residents voting for 3rd party candidates in the 2012 Presidential Election (pop. 50,000+)"
- #15 on the list of "Top 101 counties with the lowest Particulate Matter (PM10) Annual air pollution readings in 2012 (µg/m3)"
- #18 on the list of "Top 101 counties with the lowest surface withdrawal of fresh water for public supply (pop. 50,000+)"
- #23 on the list of "Top 101 counties with highest percentage of residents voting for 3rd party candidates in the 2012 Presidential Election"
- #61 on the list of "Top 101 counties with the highest percentage of residents that keep firearms around their homes"
- #79 on the list of "Top 101 counties with the largest number of people moving in compared to moving out (pop. 50,000+)"
- #88 on the list of "Top 101 counties with the lowest percentage of residents that drank alcohol in the past 30 days"
- #89 on the list of "Top 101 counties with the lowest percentage of residents that visited a dentist within the past year"
- #93 on the list of "Top 101 counties with the lowest surface withdrawal of fresh water for public supply"
- #94 on the list of "Top 101 counties with the highest percentage of residents that exercised in the past month"