Estimated zip code population in 2022: 44,654
Zip code population in 2010: 40,375
Zip code population in 2000: 41,307
Houses and condos: 17,136
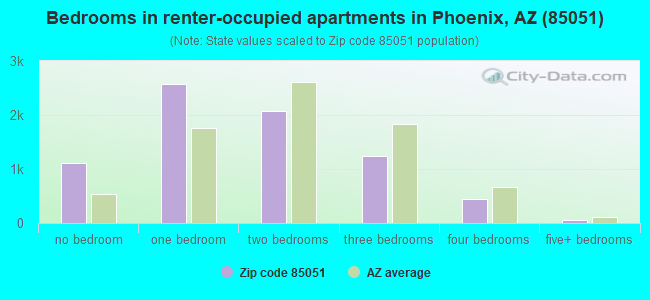
Renter-occupied apartments: 7,475
% of renters here:
46%State:
33%
March 2022 cost of living index in zip code 85051: 99.7
(near average, U.S. average is 100)
Land area: 6.3
sq. mi.
Water area: 0.0
sq. mi.
Population density: 7,069 people per square mile (high).
OSM Map
General Map
Google Map
MSN Map
OSM Map
General Map
Google Map
MSN Map
OSM Map
General Map
Google Map
MSN Map
OSM Map
General Map
Google Map
MSN Map
Please wait while loading the map...
Real estate property taxes paid for housing units in 2022:
This zip code:
0.4% ($1,165)Arizona:
0.4% ($1,786)
Median real estate property taxes paid for housing units with mortgages in 2022: $1,175 (0.4%)
Median real estate property taxes paid for housing units with no mortgage in 2022: $1,149 (0.4%)
Profiles of local businesses
Business Search - 14 Million verified businesses
Males: 22,617 Females: 22,035
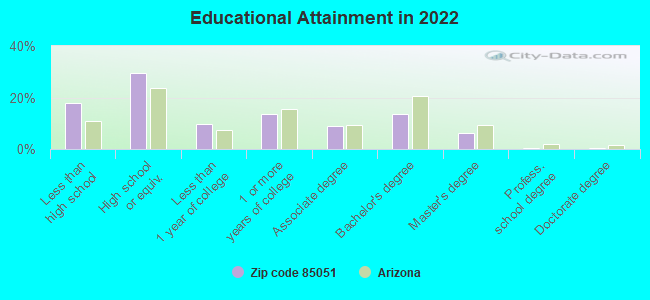
For population 25 years and over in 85051:
High school or higher: 81.9%Bachelor's degree or higher: 20.5%Graduate or professional degree: 7.0%Unemployed: 6.5%Mean travel time to work (commute): 27.3 minutes
For population 15 years and over in 85051:
Never married: 38.4%Now married: 39.4%Separated: 2.9%Widowed: 4.9%Divorced: 14.4%
Zip code 85051 compared to state average:
Length of stay since moving in significantly above state average. House age above state average. Percentage of population with a bachelor's degree or higher below state average. 20,455 45.8% Hispanic or Latino 15,805 35.4% White 3,136 7.0% Black 2,170 4.9% Asian 1,799 4.0% Two or more races 867 1.9% American Indian 355 0.8% Some other race 64 0.1% Native Hawaiian and Other
Data:
Median household income ($)
Median household income (% change since 2000)
Household income diversity
Ratio of average income to average house value (%)
Ratio of average income to average rent
Median household income ($) - White
Median household income ($) - Black or African American
Median household income ($) - Asian
Median household income ($) - Hispanic or Latino
Median household income ($) - American Indian and Alaska Native
Median household income ($) - Multirace
Median household income ($) - Other Race
Median household income for houses/condos with a mortgage ($)
Median household income for apartments without a mortgage ($)
Races - White alone (%)
Races - White alone (% change since 2000)
Races - Black alone (%)
Races - Black alone (% change since 2000)
Races - American Indian alone (%)
Races - American Indian alone (% change since 2000)
Races - Asian alone (%)
Races - Asian alone (% change since 2000)
Races - Hispanic (%)
Races - Hispanic (% change since 2000)
Races - Native Hawaiian and Other Pacific Islander alone (%)
Races - Native Hawaiian and Other Pacific Islander alone (% change since 2000)
Races - Two or more races (%)
Races - Two or more races (% change since 2000)
Races - Other race alone (%)
Races - Other race alone (% change since 2000)
Racial diversity
Unemployment (%)
Unemployment (% change since 2000)
Unemployment (%) - White
Unemployment (%) - Black or African American
Unemployment (%) - Asian
Unemployment (%) - Hispanic or Latino
Unemployment (%) - American Indian and Alaska Native
Unemployment (%) - Multirace
Unemployment (%) - Other Race
Population density (people per square mile)
Population - Males (%)
Population - Females (%)
Population - Males (%) - White
Population - Males (%) - Black or African American
Population - Males (%) - Asian
Population - Males (%) - Hispanic or Latino
Population - Males (%) - American Indian and Alaska Native
Population - Males (%) - Multirace
Population - Males (%) - Other Race
Population - Females (%) - White
Population - Females (%) - Black or African American
Population - Females (%) - Asian
Population - Females (%) - Hispanic or Latino
Population - Females (%) - American Indian and Alaska Native
Population - Females (%) - Multirace
Population - Females (%) - Other Race
Coronavirus confirmed cases (Jun 05, 2024)
Deaths caused by coronavirus (Jun 05, 2024)
Coronavirus confirmed cases (per 100k population) (Jun 05, 2024)
Deaths caused by coronavirus (per 100k population) (Jun 05, 2024)
Daily increase in number of cases (Jun 05, 2024)
Weekly increase in number of cases (Jun 05, 2024)
Cases doubled (in days) (Jun 05, 2024)
Hospitalized patients (Apr 18, 2022)
Negative test results (Apr 18, 2022)
Total test results (Apr 18, 2022)
COVID Vaccine doses distributed (per 100k population) (Sep 19, 2023)
COVID Vaccine doses administered (per 100k population) (Sep 19, 2023)
COVID Vaccine doses distributed (Sep 19, 2023)
COVID Vaccine doses administered (Sep 19, 2023)
Likely homosexual households (%)
Likely homosexual households (% change since 2000)
Likely homosexual households - Lesbian couples (%)
Likely homosexual households - Lesbian couples (% change since 2000)
Likely homosexual households - Gay men (%)
Likely homosexual households - Gay men (% change since 2000)
Cost of living index
Median gross rent ($)
Median contract rent ($)
Median monthly housing costs ($)
Median house or condo value ($)
Median house or condo value ($ change since 2000)
Mean house or condo value by units in structure - 1, detached ($)
Mean house or condo value by units in structure - 1, attached ($)
Mean house or condo value by units in structure - 2 ($)
Mean house or condo value by units in structure by units in structure - 3 or 4 ($)
Mean house or condo value by units in structure - 5 or more ($)
Mean house or condo value by units in structure - Boat, RV, van, etc. ($)
Mean house or condo value by units in structure - Mobile home ($)
Median house or condo value ($) - White
Median house or condo value ($) - Black or African American
Median house or condo value ($) - Asian
Median house or condo value ($) - Hispanic or Latino
Median house or condo value ($) - American Indian and Alaska Native
Median house or condo value ($) - Multirace
Median house or condo value ($) - Other Race
Median resident age
Resident age diversity
Median resident age - Males
Median resident age - Females
Median resident age - White
Median resident age - Black or African American
Median resident age - Asian
Median resident age - Hispanic or Latino
Median resident age - American Indian and Alaska Native
Median resident age - Multirace
Median resident age - Other Race
Median resident age - Males - White
Median resident age - Males - Black or African American
Median resident age - Males - Asian
Median resident age - Males - Hispanic or Latino
Median resident age - Males - American Indian and Alaska Native
Median resident age - Males - Multirace
Median resident age - Males - Other Race
Median resident age - Females - White
Median resident age - Females - Black or African American
Median resident age - Females - Asian
Median resident age - Females - Hispanic or Latino
Median resident age - Females - American Indian and Alaska Native
Median resident age - Females - Multirace
Median resident age - Females - Other Race
Commute - mean travel time to work (minutes)
Travel time to work - Less than 5 minutes (%)
Travel time to work - Less than 5 minutes (% change since 2000)
Travel time to work - 5 to 9 minutes (%)
Travel time to work - 5 to 9 minutes (% change since 2000)
Travel time to work - 10 to 19 minutes (%)
Travel time to work - 10 to 19 minutes (% change since 2000)
Travel time to work - 20 to 29 minutes (%)
Travel time to work - 20 to 29 minutes (% change since 2000)
Travel time to work - 30 to 39 minutes (%)
Travel time to work - 30 to 39 minutes (% change since 2000)
Travel time to work - 40 to 59 minutes (%)
Travel time to work - 40 to 59 minutes (% change since 2000)
Travel time to work - 60 to 89 minutes (%)
Travel time to work - 60 to 89 minutes (% change since 2000)
Travel time to work - 90 or more minutes (%)
Travel time to work - 90 or more minutes (% change since 2000)
Marital status - Never married (%)
Marital status - Now married (%)
Marital status - Separated (%)
Marital status - Widowed (%)
Marital status - Divorced (%)
Median family income ($)
Median family income (% change since 2000)
Median non-family income ($)
Median non-family income (% change since 2000)
Median per capita income ($)
Median per capita income (% change since 2000)
Median family income ($) - White
Median family income ($) - Black or African American
Median family income ($) - Asian
Median family income ($) - Hispanic or Latino
Median family income ($) - American Indian and Alaska Native
Median family income ($) - Multirace
Median family income ($) - Other Race
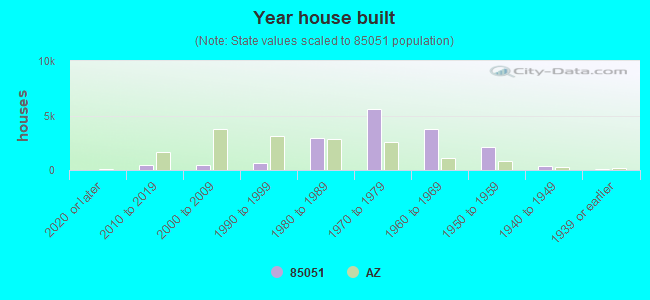
Median year house/condo built
Median year apartment built
Year house built - Built 2005 or later (%)
Year house built - Built 2000 to 2004 (%)
Year house built - Built 1990 to 1999 (%)
Year house built - Built 1980 to 1989 (%)
Year house built - Built 1970 to 1979 (%)
Year house built - Built 1960 to 1969 (%)
Year house built - Built 1950 to 1959 (%)
Year house built - Built 1940 to 1949 (%)
Year house built - Built 1939 or earlier (%)
Average household size
Household density (households per square mile)
Average household size - White
Average household size - Black or African American
Average household size - Asian
Average household size - Hispanic or Latino
Average household size - American Indian and Alaska Native
Average household size - Multirace
Average household size - Other Race
Occupied housing units (%)
Vacant housing units (%)
Owner occupied housing units (%)
Renter occupied housing units (%)
Vacancy status - For rent (%)
Vacancy status - For sale only (%)
Vacancy status - Rented or sold, not occupied (%)
Vacancy status - For seasonal, recreational, or occasional use (%)
Vacancy status - For migrant workers (%)
Vacancy status - Other vacant (%)
Residents with income below the poverty level (%)
Residents with income below 50% of the poverty level (%)
Children below poverty level (%)
Poor families by family type - Married-couple family (%)
Poor families by family type - Male, no wife present (%)
Poor families by family type - Female, no husband present (%)
Poverty status for native-born residents (%)
Poverty status for foreign-born residents (%)
Poverty among high school graduates not in families (%)
Poverty among people who did not graduate high school not in families (%)
Residents with income below the poverty level (%) - White
Residents with income below the poverty level (%) - Black or African American
Residents with income below the poverty level (%) - Asian
Residents with income below the poverty level (%) - Hispanic or Latino
Residents with income below the poverty level (%) - American Indian and Alaska Native
Residents with income below the poverty level (%) - Multirace
Residents with income below the poverty level (%) - Other Race
Air pollution - Air Quality Index (AQI)
Air pollution - CO
Air pollution - NO2
Air pollution - SO2
Air pollution - Ozone
Air pollution - PM10
Air pollution - PM25
Air pollution - Pb
Crime - Murders per 100,000 population
Crime - Rapes per 100,000 population
Crime - Robberies per 100,000 population
Crime - Assaults per 100,000 population
Crime - Burglaries per 100,000 population
Crime - Thefts per 100,000 population
Crime - Auto thefts per 100,000 population
Crime - Arson per 100,000 population
Crime - City-data.com crime index
Crime - Violent crime index
Crime - Property crime index
Crime - Murders per 100,000 population (5 year average)
Crime - Rapes per 100,000 population (5 year average)
Crime - Robberies per 100,000 population (5 year average)
Crime - Assaults per 100,000 population (5 year average)
Crime - Burglaries per 100,000 population (5 year average)
Crime - Thefts per 100,000 population (5 year average)
Crime - Auto thefts per 100,000 population (5 year average)
Crime - Arson per 100,000 population (5 year average)
Crime - City-data.com crime index (5 year average)
Crime - Violent crime index (5 year average)
Crime - Property crime index (5 year average)
1996 Presidential Elections Results (%) - Democratic Party (Clinton)
1996 Presidential Elections Results (%) - Republican Party (Dole)
1996 Presidential Elections Results (%) - Other
2000 Presidential Elections Results (%) - Democratic Party (Gore)
2000 Presidential Elections Results (%) - Republican Party (Bush)
2000 Presidential Elections Results (%) - Other
2004 Presidential Elections Results (%) - Democratic Party (Kerry)
2004 Presidential Elections Results (%) - Republican Party (Bush)
2004 Presidential Elections Results (%) - Other
2008 Presidential Elections Results (%) - Democratic Party (Obama)
2008 Presidential Elections Results (%) - Republican Party (McCain)
2008 Presidential Elections Results (%) - Other
2012 Presidential Elections Results (%) - Democratic Party (Obama)
2012 Presidential Elections Results (%) - Republican Party (Romney)
2012 Presidential Elections Results (%) - Other
2016 Presidential Elections Results (%) - Democratic Party (Clinton)
2016 Presidential Elections Results (%) - Republican Party (Trump)
2016 Presidential Elections Results (%) - Other
2020 Presidential Elections Results (%) - Democratic Party (Biden)
2020 Presidential Elections Results (%) - Republican Party (Trump)
2020 Presidential Elections Results (%) - Other
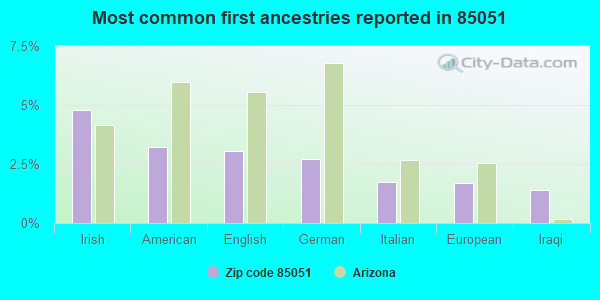
Ancestries Reported - Arab (%)
Ancestries Reported - Czech (%)
Ancestries Reported - Danish (%)
Ancestries Reported - Dutch (%)
Ancestries Reported - English (%)
Ancestries Reported - French (%)
Ancestries Reported - French Canadian (%)
Ancestries Reported - German (%)
Ancestries Reported - Greek (%)
Ancestries Reported - Hungarian (%)
Ancestries Reported - Irish (%)
Ancestries Reported - Italian (%)
Ancestries Reported - Lithuanian (%)
Ancestries Reported - Norwegian (%)
Ancestries Reported - Polish (%)
Ancestries Reported - Portuguese (%)
Ancestries Reported - Russian (%)
Ancestries Reported - Scotch-Irish (%)
Ancestries Reported - Scottish (%)
Ancestries Reported - Slovak (%)
Ancestries Reported - Subsaharan African (%)
Ancestries Reported - Swedish (%)
Ancestries Reported - Swiss (%)
Ancestries Reported - Ukrainian (%)
Ancestries Reported - United States (%)
Ancestries Reported - Welsh (%)
Ancestries Reported - West Indian (%)
Ancestries Reported - Other (%)
Educational Attainment - No schooling completed (%)
Educational Attainment - Less than high school (%)
Educational Attainment - High school or equivalent (%)
Educational Attainment - Less than 1 year of college (%)
Educational Attainment - 1 or more years of college (%)
Educational Attainment - Associate degree (%)
Educational Attainment - Bachelor's degree (%)
Educational Attainment - Master's degree (%)
Educational Attainment - Professional school degree (%)
Educational Attainment - Doctorate degree (%)
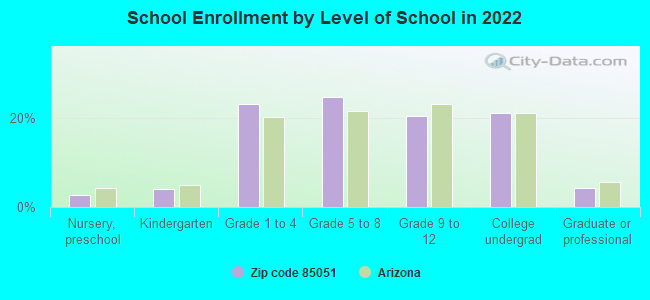
School Enrollment - Nursery, preschool (%)
School Enrollment - Kindergarten (%)
School Enrollment - Grade 1 to 4 (%)
School Enrollment - Grade 5 to 8 (%)
School Enrollment - Grade 9 to 12 (%)
School Enrollment - College undergrad (%)
School Enrollment - Graduate or professional (%)
School Enrollment - Not enrolled in school (%)
School enrollment - Public schools (%)
School enrollment - Private schools (%)
School enrollment - Not enrolled (%)
Median number of rooms in houses and condos
Median number of rooms in apartments
Housing units lacking complete plumbing facilities (%)
Housing units lacking complete kitchen facilities (%)
Density of houses
Urban houses (%)
Rural houses (%)
Households with people 60 years and over (%)
Households with people 65 years and over (%)
Households with people 75 years and over (%)
Households with one or more nonrelatives (%)
Households with no nonrelatives (%)
Population in households (%)
Family households (%)
Nonfamily households (%)
Population in families (%)
Family households with own children (%)
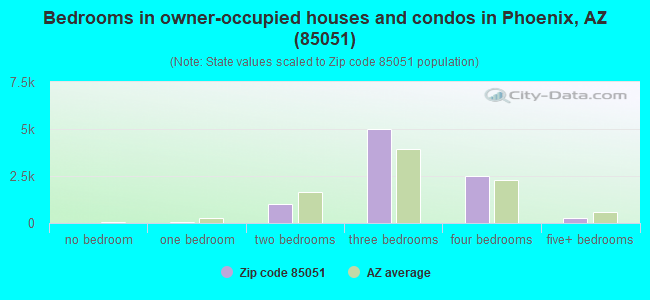
Median number of bedrooms in owner occupied houses
Mean number of bedrooms in owner occupied houses
Median number of bedrooms in renter occupied houses
Mean number of bedrooms in renter occupied houses
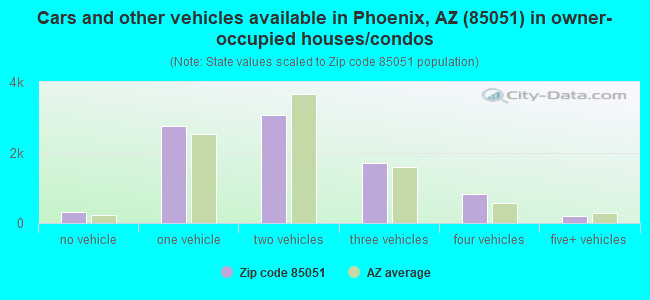
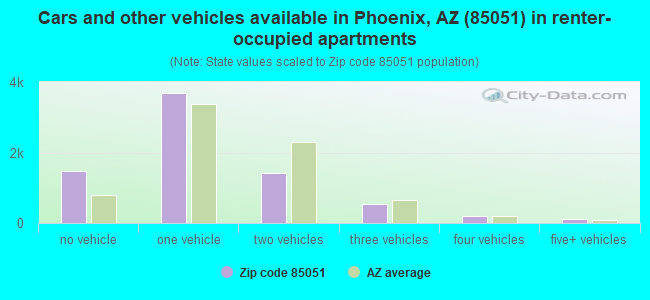
Median number of vehichles in owner occupied houses
Mean number of vehichles in owner occupied houses
Median number of vehichles in renter occupied houses
Mean number of vehichles in renter occupied houses
Mortgage status - with mortgage (%)
Mortgage status - with second mortgage (%)
Mortgage status - with home equity loan (%)
Mortgage status - with both second mortgage and home equity loan (%)
Mortgage status - without a mortgage (%)
Average family size
Average family size - White
Average family size - Black or African American
Average family size - Asian
Average family size - Hispanic or Latino
Average family size - American Indian and Alaska Native
Average family size - Multirace
Average family size - Other Race
Geographical mobility - Same house 1 year ago (%)
Geographical mobility - Moved within same county (%)
Geographical mobility - Moved from different county within same state (%)
Geographical mobility - Moved from different state (%)
Geographical mobility - Moved from abroad (%)
Place of birth - Born in state of residence (%)
Place of birth - Born in other state (%)
Place of birth - Native, outside of US (%)
Place of birth - Foreign born (%)
Housing units in structures - 1, detached (%)
Housing units in structures - 1, attached (%)
Housing units in structures - 2 (%)
Housing units in structures - 3 or 4 (%)
Housing units in structures - 5 to 9 (%)
Housing units in structures - 10 to 19 (%)
Housing units in structures - 20 to 49 (%)
Housing units in structures - 50 or more (%)
Housing units in structures - Mobile home (%)
Housing units in structures - Boat, RV, van, etc. (%)
House/condo owner moved in on average (years ago)
Renter moved in on average (years ago)
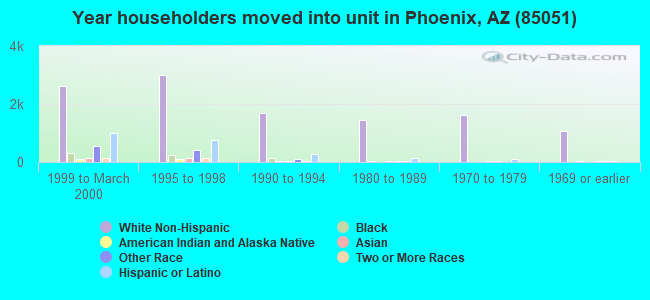
Year householder moved into unit - Moved in 1999 to March 2000 (%)
Year householder moved into unit - Moved in 1995 to 1998 (%)
Year householder moved into unit - Moved in 1990 to 1994 (%)
Year householder moved into unit - Moved in 1980 to 1989 (%)
Year householder moved into unit - Moved in 1970 to 1979 (%)
Year householder moved into unit - Moved in 1969 or earlier (%)
Means of transportation to work - Drove car alone (%)
Means of transportation to work - Carpooled (%)
Means of transportation to work - Public transportation (%)
Means of transportation to work - Bus or trolley bus (%)
Means of transportation to work - Streetcar or trolley car (%)
Means of transportation to work - Subway or elevated (%)
Means of transportation to work - Railroad (%)
Means of transportation to work - Ferryboat (%)
Means of transportation to work - Taxicab (%)
Means of transportation to work - Motorcycle (%)
Means of transportation to work - Bicycle (%)
Means of transportation to work - Walked (%)
Means of transportation to work - Other means (%)
Working at home (%)
Industry diversity
Most Common Industries - Agriculture, forestry, fishing and hunting, and mining (%)
Most Common Industries - Agriculture, forestry, fishing and hunting (%)
Most Common Industries - Mining, quarrying, and oil and gas extraction (%)
Most Common Industries - Construction (%)
Most Common Industries - Manufacturing (%)
Most Common Industries - Wholesale trade (%)
Most Common Industries - Retail trade (%)
Most Common Industries - Transportation and warehousing, and utilities (%)
Most Common Industries - Transportation and warehousing (%)
Most Common Industries - Utilities (%)
Most Common Industries - Information (%)
Most Common Industries - Finance and insurance, and real estate and rental and leasing (%)
Most Common Industries - Finance and insurance (%)
Most Common Industries - Real estate and rental and leasing (%)
Most Common Industries - Professional, scientific, and management, and administrative and waste management services (%)
Most Common Industries - Professional, scientific, and technical services (%)
Most Common Industries - Management of companies and enterprises (%)
Most Common Industries - Administrative and support and waste management services (%)
Most Common Industries - Educational services, and health care and social assistance (%)
Most Common Industries - Educational services (%)
Most Common Industries - Health care and social assistance (%)
Most Common Industries - Arts, entertainment, and recreation, and accommodation and food services (%)
Most Common Industries - Arts, entertainment, and recreation (%)
Most Common Industries - Accommodation and food services (%)
Most Common Industries - Other services, except public administration (%)
Most Common Industries - Public administration (%)
Occupation diversity
Most Common Occupations - Management, business, science, and arts occupations (%)
Most Common Occupations - Management, business, and financial occupations (%)
Most Common Occupations - Management occupations (%)
Most Common Occupations - Business and financial operations occupations (%)
Most Common Occupations - Computer, engineering, and science occupations (%)
Most Common Occupations - Computer and mathematical occupations (%)
Most Common Occupations - Architecture and engineering occupations (%)
Most Common Occupations - Life, physical, and social science occupations (%)
Most Common Occupations - Education, legal, community service, arts, and media occupations (%)
Most Common Occupations - Community and social service occupations (%)
Most Common Occupations - Legal occupations (%)
Most Common Occupations - Education, training, and library occupations (%)
Most Common Occupations - Arts, design, entertainment, sports, and media occupations (%)
Most Common Occupations - Healthcare practitioners and technical occupations (%)
Most Common Occupations - Health diagnosing and treating practitioners and other technical occupations (%)
Most Common Occupations - Health technologists and technicians (%)
Most Common Occupations - Service occupations (%)
Most Common Occupations - Healthcare support occupations (%)
Most Common Occupations - Protective service occupations (%)
Most Common Occupations - Fire fighting and prevention, and other protective service workers including supervisors (%)
Most Common Occupations - Law enforcement workers including supervisors (%)
Most Common Occupations - Food preparation and serving related occupations (%)
Most Common Occupations - Building and grounds cleaning and maintenance occupations (%)
Most Common Occupations - Personal care and service occupations (%)
Most Common Occupations - Sales and office occupations (%)
Most Common Occupations - Sales and related occupations (%)
Most Common Occupations - Office and administrative support occupations (%)
Most Common Occupations - Natural resources, construction, and maintenance occupations (%)
Most Common Occupations - Farming, fishing, and forestry occupations (%)
Most Common Occupations - Construction and extraction occupations (%)
Most Common Occupations - Installation, maintenance, and repair occupations (%)
Most Common Occupations - Production, transportation, and material moving occupations (%)
Most Common Occupations - Production occupations (%)
Most Common Occupations - Transportation occupations (%)
Most Common Occupations - Material moving occupations (%)
People in Group quarters - Institutionalized population (%)
People in Group quarters - Correctional institutions (%)
People in Group quarters - Federal prisons and detention centers (%)
People in Group quarters - Halfway houses (%)
People in Group quarters - Local jails and other confinement facilities (including police lockups) (%)
People in Group quarters - Military disciplinary barracks (%)
People in Group quarters - State prisons (%)
People in Group quarters - Other types of correctional institutions (%)
People in Group quarters - Nursing homes (%)
People in Group quarters - Hospitals/wards, hospices, and schools for the handicapped (%)
People in Group quarters - Hospitals/wards and hospices for chronically ill (%)
People in Group quarters - Hospices or homes for chronically ill (%)
People in Group quarters - Military hospitals or wards for chronically ill (%)
People in Group quarters - Other hospitals or wards for chronically ill (%)
People in Group quarters - Hospitals or wards for drug/alcohol abuse (%)
People in Group quarters - Mental (Psychiatric) hospitals or wards (%)
People in Group quarters - Schools, hospitals, or wards for the mentally retarded (%)
People in Group quarters - Schools, hospitals, or wards for the physically handicapped (%)
People in Group quarters - Institutions for the deaf (%)
People in Group quarters - Institutions for the blind (%)
People in Group quarters - Orthopedic wards and institutions for the physically handicapped (%)
People in Group quarters - Wards in general hospitals for patients who have no usual home elsewhere (%)
People in Group quarters - Wards in military hospitals for patients who have no usual home elsewhere (%)
People in Group quarters - Juvenile institutions (%)
People in Group quarters - Long-term care (%)
People in Group quarters - Homes for abused, dependent, and neglected children (%)
People in Group quarters - Residential treatment centers for emotionally disturbed children (%)
People in Group quarters - Training schools for juvenile delinquents (%)
People in Group quarters - Short-term care, detention or diagnostic centers for delinquent children (%)
People in Group quarters - Type of juvenile institution unknown (%)
People in Group quarters - Noninstitutionalized population (%)
People in Group quarters - College dormitories (includes college quarters off campus) (%)
People in Group quarters - Military quarters (%)
People in Group quarters - On base (%)
People in Group quarters - Barracks, unaccompanied personnel housing (UPH), (Enlisted/Officer), ;and similar group living quarters for military personnel (%)
People in Group quarters - Transient quarters for temporary residents (%)
People in Group quarters - Military ships (%)
People in Group quarters - Group homes (%)
People in Group quarters - Homes or halfway houses for drug/alcohol abuse (%)
People in Group quarters - Homes for the mentally ill (%)
People in Group quarters - Homes for the mentally retarded (%)
People in Group quarters - Homes for the physically handicapped (%)
People in Group quarters - Other group homes (%)
People in Group quarters - Religious group quarters (%)
People in Group quarters - Dormitories (%)
People in Group quarters - Agriculture workers' dormitories on farms (%)
People in Group quarters - Job Corps and vocational training facilities (%)
People in Group quarters - Other workers' dormitories (%)
People in Group quarters - Crews of maritime vessels (%)
People in Group quarters - Other nonhousehold living situations (%)
People in Group quarters - Other noninstitutional group quarters (%)
Residents speaking English at home (%)
Residents speaking English at home - Born in the United States (%)
Residents speaking English at home - Native, born elsewhere (%)
Residents speaking English at home - Foreign born (%)
Residents speaking Spanish at home (%)
Residents speaking Spanish at home - Born in the United States (%)
Residents speaking Spanish at home - Native, born elsewhere (%)
Residents speaking Spanish at home - Foreign born (%)
Residents speaking other language at home (%)
Residents speaking other language at home - Born in the United States (%)
Residents speaking other language at home - Native, born elsewhere (%)
Residents speaking other language at home - Foreign born (%)
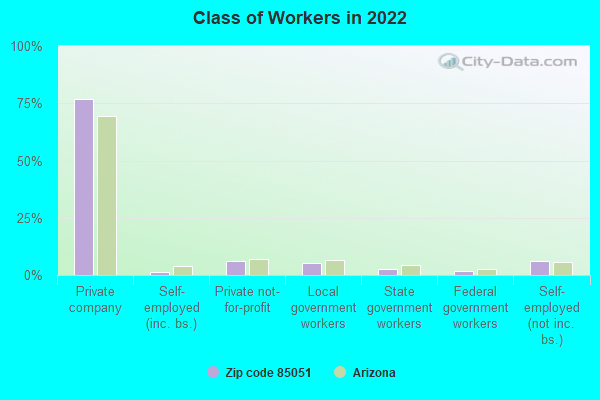
Class of Workers - Employee of private company (%)
Class of Workers - Self-employed in own incorporated business (%)
Class of Workers - Private not-for-profit wage and salary workers (%)
Class of Workers - Local government workers (%)
Class of Workers - State government workers (%)
Class of Workers - Federal government workers (%)
Class of Workers - Self-employed workers in own not incorporated business and Unpaid family workers (%)
House heating fuel used in houses and condos - Utility gas (%)
House heating fuel used in houses and condos - Bottled, tank, or LP gas (%)
House heating fuel used in houses and condos - Electricity (%)
House heating fuel used in houses and condos - Fuel oil, kerosene, etc. (%)
House heating fuel used in houses and condos - Coal or coke (%)
House heating fuel used in houses and condos - Wood (%)
House heating fuel used in houses and condos - Solar energy (%)
House heating fuel used in houses and condos - Other fuel (%)
House heating fuel used in houses and condos - No fuel used (%)
House heating fuel used in apartments - Utility gas (%)
House heating fuel used in apartments - Bottled, tank, or LP gas (%)
House heating fuel used in apartments - Electricity (%)
House heating fuel used in apartments - Fuel oil, kerosene, etc. (%)
House heating fuel used in apartments - Coal or coke (%)
House heating fuel used in apartments - Wood (%)
House heating fuel used in apartments - Solar energy (%)
House heating fuel used in apartments - Other fuel (%)
House heating fuel used in apartments - No fuel used (%)
Armed forces status - In Armed Forces (%)
Armed forces status - Civilian (%)
Armed forces status - Civilian - Veteran (%)
Armed forces status - Civilian - Nonveteran (%)
Fatal accidents locations in years 2005-2021
Fatal accidents locations in 2005
Fatal accidents locations in 2006
Fatal accidents locations in 2007
Fatal accidents locations in 2008
Fatal accidents locations in 2009
Fatal accidents locations in 2010
Fatal accidents locations in 2011
Fatal accidents locations in 2012
Fatal accidents locations in 2013
Fatal accidents locations in 2014
Fatal accidents locations in 2015
Fatal accidents locations in 2016
Fatal accidents locations in 2017
Fatal accidents locations in 2018
Fatal accidents locations in 2019
Fatal accidents locations in 2020
Fatal accidents locations in 2021
Alcohol use - People drinking some alcohol every month (%)
Alcohol use - People not drinking at all (%)
Alcohol use - Average days/month drinking alcohol
Alcohol use - Average drinks/week
Alcohol use - Average days/year people drink much
Audiometry - Average condition of hearing (%)
Audiometry - People that can hear a whisper from across a quiet room (%)
Audiometry - People that can hear normal voice from across a quiet room (%)
Audiometry - Ears ringing, roaring, buzzing (%)
Audiometry - Had a job exposure to loud noise (%)
Audiometry - Had off-work exposure to loud noise (%)
Blood Pressure & Cholesterol - Has high blood pressure (%)
Blood Pressure & Cholesterol - Checking blood pressure at home (%)
Blood Pressure & Cholesterol - Frequently checking blood cholesterol (%)
Blood Pressure & Cholesterol - Has high cholesterol level (%)
Consumer Behavior - Money monthly spent on food at supermarket/grocery store
Consumer Behavior - Money monthly spent on food at other stores
Consumer Behavior - Money monthly spent on eating out
Consumer Behavior - Money monthly spent on carryout/delivered foods
Consumer Behavior - Income spent on food at supermarket/grocery store (%)
Consumer Behavior - Income spent on food at other stores (%)
Consumer Behavior - Income spent on eating out (%)
Consumer Behavior - Income spent on carryout/delivered foods (%)
Current Health Status - General health condition (%)
Current Health Status - Blood donors (%)
Current Health Status - Has blood ever tested for HIV virus (%)
Current Health Status - Left-handed people (%)
Dermatology - People using sunscreen (%)
Diabetes - Diabetics (%)
Diabetes - Had a blood test for high blood sugar (%)
Diabetes - People taking insulin (%)
Diet Behavior & Nutrition - Diet health (%)
Diet Behavior & Nutrition - Milk product consumption (# of products/month)
Diet Behavior & Nutrition - Meals not home prepared (#/week)
Diet Behavior & Nutrition - Meals from fast food or pizza place (#/week)
Diet Behavior & Nutrition - Ready-to-eat foods (#/month)
Diet Behavior & Nutrition - Frozen meals/pizza (#/month)
Drug Use - People that ever used marijuana or hashish (%)
Drug Use - Ever used hard drugs (%)
Drug Use - Ever used any form of cocaine (%)
Drug Use - Ever used heroin (%)
Drug Use - Ever used methamphetamine (%)
Health Insurance - People covered by health insurance (%)
Kidney Conditions-Urology - Avg. # of times urinating at night
Medical Conditions - People with asthma (%)
Medical Conditions - People with anemia (%)
Medical Conditions - People with psoriasis (%)
Medical Conditions - People with overweight (%)
Medical Conditions - Elderly people having difficulties in thinking or remembering (%)
Medical Conditions - People who ever received blood transfusion (%)
Medical Conditions - People having trouble seeing even with glass/contacts (%)
Medical Conditions - People with arthritis (%)
Medical Conditions - People with gout (%)
Medical Conditions - People with congestive heart failure (%)
Medical Conditions - People with coronary heart disease (%)
Medical Conditions - People with angina pectoris (%)
Medical Conditions - People who ever had heart attack (%)
Medical Conditions - People who ever had stroke (%)
Medical Conditions - People with emphysema (%)
Medical Conditions - People with thyroid problem (%)
Medical Conditions - People with chronic bronchitis (%)
Medical Conditions - People with any liver condition (%)
Medical Conditions - People who ever had cancer or malignancy (%)
Mental Health - People who have little interest in doing things (%)
Mental Health - People feeling down, depressed, or hopeless (%)
Mental Health - People who have trouble sleeping or sleeping too much (%)
Mental Health - People feeling tired or having little energy (%)
Mental Health - People with poor appetite or overeating (%)
Mental Health - People feeling bad about themself (%)
Mental Health - People who have trouble concentrating on things (%)
Mental Health - People moving or speaking slowly or too fast (%)
Mental Health - People having thoughts they would be better off dead (%)
Oral Health - Average years since last visit a dentist
Oral Health - People embarrassed because of mouth (%)
Oral Health - People with gum disease (%)
Oral Health - General health of teeth and gums (%)
Oral Health - Average days a week using dental floss/device
Oral Health - Average days a week using mouthwash for dental problem
Oral Health - Average number of teeth
Pesticide Use - Households using pesticides to control insects (%)
Pesticide Use - Households using pesticides to kill weeds (%)
Physical Activity - People doing vigorous-intensity work activities (%)
Physical Activity - People doing moderate-intensity work activities (%)
Physical Activity - People walking or bicycling (%)
Physical Activity - People doing vigorous-intensity recreational activities (%)
Physical Activity - People doing moderate-intensity recreational activities (%)
Physical Activity - Average hours a day doing sedentary activities
Physical Activity - Average hours a day watching TV or videos
Physical Activity - Average hours a day using computer
Physical Functioning - People having limitations keeping them from working (%)
Physical Functioning - People limited in amount of work they can do (%)
Physical Functioning - People that need special equipment to walk (%)
Physical Functioning - People experiencing confusion/memory problems (%)
Physical Functioning - People requiring special healthcare equipment (%)
Prescription Medications - Average number of prescription medicines taking
Preventive Aspirin Use - Adults 40+ taking low-dose aspirin (%)
Reproductive Health - Vaginal deliveries (%)
Reproductive Health - Cesarean deliveries (%)
Reproductive Health - Deliveries resulted in a live birth (%)
Reproductive Health - Pregnancies resulted in a delivery (%)
Reproductive Health - Women breastfeeding newborns (%)
Reproductive Health - Women that had a hysterectomy (%)
Reproductive Health - Women that had both ovaries removed (%)
Reproductive Health - Women that have ever taken birth control pills (%)
Reproductive Health - Women taking birth control pills (%)
Reproductive Health - Women that have ever used Depo-Provera or injectables (%)
Reproductive Health - Women that have ever used female hormones (%)
Sexual Behavior - People 18+ that ever had sex (vaginal, anal, or oral) (%)
Sexual Behavior - Males 18+ that ever had vaginal sex with a woman (%)
Sexual Behavior - Males 18+ that ever performed oral sex on a woman (%)
Sexual Behavior - Males 18+ that ever had anal sex with a woman (%)
Sexual Behavior - Males 18+ that ever had any sex with a man (%)
Sexual Behavior - Females 18+ that ever had vaginal sex with a man (%)
Sexual Behavior - Females 18+ that ever performed oral sex on a man (%)
Sexual Behavior - Females 18+ that ever had anal sex with a man (%)
Sexual Behavior - Females 18+ that ever had any kind of sex with a woman (%)
Sexual Behavior - Average age people first had sex
Sexual Behavior - Average number of female sex partners in lifetime (males 18+)
Sexual Behavior - Average number of female vaginal sex partners in lifetime (males 18+)
Sexual Behavior - Average age people first performed oral sex on a woman (18+)
Sexual Behavior - Average number of woman performed oral sex on in lifetime (18+)
Sexual Behavior - Average number of male sex partners in lifetime (males 18+)
Sexual Behavior - Average number of male anal sex partners in lifetime (males 18+)
Sexual Behavior - Average age people first performed oral sex on a man (18+)
Sexual Behavior - Average number of male oral sex partners in lifetime (18+)
Sexual Behavior - People using protection when performing oral sex (%)
Sexual Behavior - Average number of times people have vaginal or anal sex a year
Sexual Behavior - People having sex without condom (%)
Sexual Behavior - Average number of male sex partners in lifetime (females 18+)
Sexual Behavior - Average number of male vaginal sex partners in lifetime (females 18+)
Sexual Behavior - Average number of female sex partners in lifetime (females 18+)
Sexual Behavior - Circumcised males 18+ (%)
Sleep Disorders - Average hours sleeping at night
Sleep Disorders - People that has trouble sleeping (%)
Smoking-Cigarette Use - People smoking cigarettes (%)
Taste & Smell - People 40+ having problems with smell (%)
Taste & Smell - People 40+ having problems with taste (%)
Taste & Smell - People 40+ that ever had wisdom teeth removed (%)
Taste & Smell - People 40+ that ever had tonsils teeth removed (%)
Taste & Smell - People 40+ that ever had a loss of consciousness because of a head injury (%)
Taste & Smell - People 40+ that ever had a broken nose or other serious injury to face or skull (%)
Taste & Smell - People 40+ that ever had two or more sinus infections (%)
Weight - Average height (inches)
Weight - Average weight (pounds)
Weight - Average BMI
Weight - People that are obese (%)
Weight - People that ever were obese (%)
Weight - People trying to lose weight (%)
100%
urban population.
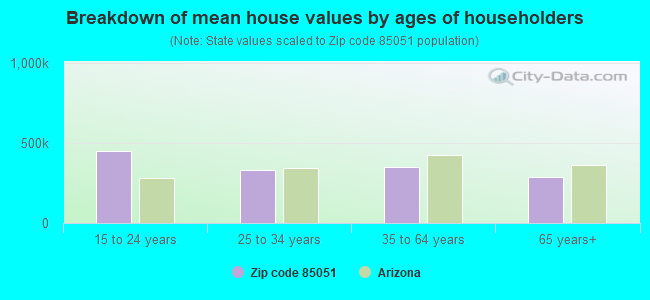
Estimated median house/condo value in 2022: $317,077
85051:
$317,077Arizona:
$402,800
Median resident age: This zip code:
35.0 yearsArizona median age:
38.8 years
Average household size: This zip code:
2.7 peopleArizona:
2.5 people
Averages for the 2020 tax year for zip code 85051, filed in 2021:
Average Adjusted Gross Income (AGI) in 2020: $38,755 (Individual Income Tax Returns) Here:
$38,755State:
$73,499
Salary/wage: $36,532 (reported on 84.7% of returns )Here:
$36,532State:
$59,499
(% of AGI for various income ranges: 1229.6% for AGIs below $25k , 3896.4% for AGIs $25k-50k , 7349.1% for AGIs $50k-75k , 10854.2% for AGIs $75k-100k , 17986.9% for AGIs $100k-200k , 39030.0% for AGIs over 200k ) Taxable interest for individuals: $774 (reported on 10.8% of returns )This zip code:
$774Arizona:
$2,325
(% of AGI for various income ranges: 3.5% for AGIs below $25k , 5.4% for AGIs $25k-50k , 11.8% for AGIs $50k-75k , 28.6% for AGIs $75k-100k , 125.5% for AGIs $100k-200k , 366.7% for AGIs over 200k ) Ordinary dividends: $3,018 (reported on 5.2% of returns )(% of AGI for various income ranges: 6.9% for AGIs below $25k , 7.7% for AGIs $25k-50k , 25.1% for AGIs $50k-75k , 53.3% for AGIs $75k-100k , 163.3% for AGIs $100k-200k , 2123.3% for AGIs over 200k ) Net capital gain/loss in AGI: +$7,178 (reported on 5.1% of returns )Here:
+$7,178State:
+$31,332
(% of AGI for various income ranges: 4.0% for AGIs below $25k , 4.4% for AGIs $25k-50k , 54.6% for AGIs $50k-75k , 80.6% for AGIs $75k-100k , 598.6% for AGIs $100k-200k , 8016.7% for AGIs over 200k ) Profit/loss from business: +$8,803 (reported on 17.0% of returns )Here:
+$8,803State:
+$13,214
(% of AGI for various income ranges: 175.0% for AGIs below $25k , 145.3% for AGIs $25k-50k , 256.8% for AGIs $50k-75k , 244.9% for AGIs $75k-100k , 722.9% for AGIs $100k-200k , 1806.7% for AGIs over 200k ) Taxable individual retirement arrangement distribution: $13,672 (reported on 3.5% of returns )85051:
$13,672Arizona:
$23,364
(% of AGI for various income ranges: 16.7% for AGIs below $25k , 30.8% for AGIs $25k-50k , 84.5% for AGIs $50k-75k , 181.3% for AGIs $75k-100k , 798.8% for AGIs $100k-200k ) Total itemized deductions: $28,529 (reported on 3.1% of returns )Here:
$28,529State:
$36,308
(% of AGI for various income ranges: 19.7% for AGIs below $25k , 78.6% for AGIs $25k-50k , 178.3% for AGIs $50k-75k , 315.0% for AGIs $75k-100k , 632.4% for AGIs $100k-200k , 10263.3% for AGIs over 200k ) Charity contributions: $6,130 (reported on 2.2% of returns )(% of AGI for various income ranges: 1.9% for AGIs below $25k , 8.6% for AGIs $25k-50k , 29.7% for AGIs $50k-75k , 46.7% for AGIs $75k-100k , 160.8% for AGIs $100k-200k , 1540.0% for AGIs over 200k ) Taxes paid: $3,852 (reported on 3.1% of returns )(% of AGI for various income ranges: 1.8% for AGIs below $25k , 8.1% for AGIs $25k-50k , 25.1% for AGIs $50k-75k , 55.0% for AGIs $75k-100k , 136.9% for AGIs $100k-200k , 836.7% for AGIs over 200k ) Earned income credit: $2,545 (reported on 28.2% of returns )(% of AGI for various income ranges: 141.2% for AGIs below $25k , 95.4% for AGIs $25k-50k , 2.4% for AGIs $50k-75k ) Percentage of individuals using paid preparers for their 2020 taxes: 92.6%(% for various income ranges: 91.5% for AGIs below $25k , 93.9% for AGIs $25k-50k , 92.8% for AGIs $50k-75k , 92.7% for AGIs $75k-100k , 92.4% for AGIs $100k-200k , 90.0% for AGIs over 200k )
Averages for the 2012 tax year for zip code 85051, filed in 2013:
Average Adjusted Gross Income (AGI) in 2012: $32,825 (Individual Income Tax Returns) Here:
$32,825State:
$57,644
Salary/wage: $30,410 (reported on 85.8% of returns )Here:
$30,410State:
$47,932
(% of AGI for various income ranges: 79.4% for AGIs below $25k , 86.9% for AGIs $25k-50k , 80.0% for AGIs $50k-75k , 76.8% for AGIs $75k-100k , 69.2% for AGIs $100k-200k , 44.4% for AGIs over 200k ) Taxable interest for individuals: $711 (reported on 16.3% of returns )This zip code:
$711Arizona:
$2,064
(% of AGI for various income ranges: 0.3% for AGIs below $25k , 0.2% for AGIs $25k-50k , 0.5% for AGIs $50k-75k , 0.2% for AGIs $75k-100k , 0.7% for AGIs $100k-200k , 0.3% for AGIs over 200k ) Ordinary dividends: $2,537 (reported on 7.9% of returns )(% of AGI for various income ranges: 0.6% for AGIs below $25k , 0.4% for AGIs $25k-50k , 0.6% for AGIs $50k-75k , 0.7% for AGIs $75k-100k , 1.4% for AGIs $100k-200k ) Net capital gain/loss in AGI: +$2,677 (reported on 4.6% of returns )Here:
+$2,677State:
+$15,530
(% of AGI for various income ranges: 0.5% for AGIs $75k-100k , 0.9% for AGIs $100k-200k , 7.8% for AGIs over 200k ) Profit/loss from business: +$8,706 (reported on 13.8% of returns )Here:
+$8,706State:
+$12,323
(% of AGI for various income ranges: 10.4% for AGIs below $25k , 2.3% for AGIs $25k-50k , 1.5% for AGIs $50k-75k , 1.0% for AGIs $75k-100k , 2.5% for AGIs $100k-200k ) Taxable individual retirement arrangement distribution: $10,517 (reported on 6.3% of returns )85051:
$10,517Arizona:
$18,280
(% of AGI for various income ranges: 1.5% for AGIs below $25k , 1.4% for AGIs $25k-50k , 2.1% for AGIs $50k-75k , 2.1% for AGIs $75k-100k , 4.6% for AGIs $100k-200k ) Total itemized deductions: $16,188 (27% of AGI, reported on 18.0% of returns )Here:
$16,188State:
$23,651
Here:
26.6% of AGIState:
20.6% of AGI
(% of AGI for various income ranges: 5.4% for AGIs below $25k , 7.3% for AGIs $25k-50k , 10.7% for AGIs $50k-75k , 12.4% for AGIs $75k-100k , 12.1% for AGIs $100k-200k , 12.2% for AGIs over 200k ) Charity contributions: $2,851 (reported on 13.9% of returns )(% of AGI for various income ranges: 0.5% for AGIs below $25k , 0.7% for AGIs $25k-50k , 1.3% for AGIs $50k-75k , 2.0% for AGIs $75k-100k , 2.6% for AGIs $100k-200k , 1.8% for AGIs over 200k ) Taxes paid: $3,286 (reported on 17.9% of returns )(% of AGI for various income ranges: 0.7% for AGIs below $25k , 1.3% for AGIs $25k-50k , 2.1% for AGIs $50k-75k , 2.6% for AGIs $75k-100k , 3.2% for AGIs $100k-200k , 3.9% for AGIs over 200k ) Earned income credit: $2,600 (reported on 33.5% of returns )(% of AGI for various income ranges: 9.9% for AGIs below $25k , 1.7% for AGIs $25k-50k ) Percentage of individuals using paid preparers for their 2012 taxes: 55.2%(% for various income ranges: 55.6% for AGIs below $25k , 53.8% for AGIs $25k-50k , 54.7% for AGIs $50k-75k , 56.0% for AGIs $75k-100k , 59.6% for AGIs $100k-200k , 80.0% for AGIs over 200k )
Averages for the 2004 tax year for zip code 85051, filed in 2005:
Average Adjusted Gross Income (AGI) in 2004: $33,157 (Individual Income Tax Returns) Here:
$33,157State:
$50,097
Salary/wage: $30,969 (reported on 87.7% of returns )Here:
$30,969State:
$42,146
(% of AGI for various income ranges: 90.8% for AGIs below $10k , 84.9% for AGIs $10k-25k , 87.9% for AGIs $25k-50k , 83.1% for AGIs $50k-75k , 79.4% for AGIs $75k-100k , 61.0% for AGIs over 100k ) Taxable interest for individuals: $1,378 (reported on 27.9% of returns )This zip code:
$1,378Arizona:
$2,374
(% of AGI for various income ranges: 2.5% for AGIs below $10k , 1.1% for AGIs $10k-25k , 0.7% for AGIs $25k-50k , 0.8% for AGIs $50k-75k , 0.7% for AGIs $75k-100k , 3.3% for AGIs over 100k ) Taxable dividends: $1,706 (reported on 12.3% of returns )(% of AGI for various income ranges: 1.5% for AGIs below $10k , 0.6% for AGIs $10k-25k , 0.4% for AGIs $25k-50k , 0.5% for AGIs $50k-75k , 0.6% for AGIs $75k-100k , 1.3% for AGIs over 100k ) Net capital gain/loss: +$5,776 (reported on 9.4% of returns )Here:
+$5,776State:
+$17,569
(% of AGI for various income ranges: -0.3% for AGIs below $10k , 0.3% for AGIs $10k-25k , 0.3% for AGIs $25k-50k , 0.8% for AGIs $50k-75k , 1.7% for AGIs $75k-100k , 8.8% for AGIs over 100k ) Profit/loss from business: +$6,346 (reported on 11.4% of returns )Here:
+$6,346State:
+$11,088
(% of AGI for various income ranges: 9.2% for AGIs below $10k , 4.2% for AGIs $10k-25k , 1.6% for AGIs $25k-50k , 1.4% for AGIs $50k-75k , 2.4% for AGIs $75k-100k , 0.9% for AGIs over 100k ) IRA payment deduction: $2,483 (reported on 1.7% of returns )85051:
$2,483Arizona:
$3,023
(% of AGI for various income ranges: 0.1% for AGIs $10k-25k , 0.1% for AGIs $25k-50k , 0.2% for AGIs $50k-75k , 0.1% for AGIs $75k-100k , 0.1% for AGIs over 100k ) Self-employed pension: $8,229 (reported on 0.2% of returns )Here:
$8,229Arizona:
$15,785
Total itemized deductions: $14,332 (26% of AGI, reported on 28.6% of returns )Here:
$14,332State:
$19,781
Here:
26.0% of AGIState:
21.8% of AGI
(% of AGI for various income ranges: 9.5% for AGIs below $10k , 8.8% for AGIs $10k-25k , 12.6% for AGIs $25k-50k , 13.5% for AGIs $50k-75k , 14.8% for AGIs $75k-100k , 12.7% for AGIs over 100k ) Charity contributions deductions: $2,308 (4% of AGI, reported on 24.1% of returns )Here:
4.0% of AGIState:
3.5% of AGI
(% of AGI for various income ranges: 0.6% for AGIs below $10k , 0.9% for AGIs $10k-25k , 1.4% for AGIs $25k-50k , 1.9% for AGIs $50k-75k , 2.4% for AGIs $75k-100k , 2.6% for AGIs over 100k ) Total tax: $4,003 (reported on 66.6% of returns )(% of AGI for various income ranges: 2.8% for AGIs below $10k , 3.3% for AGIs $10k-25k , 5.9% for AGIs $25k-50k , 8.5% for AGIs $50k-75k , 10.5% for AGIs $75k-100k , 17.7% for AGIs over 100k ) Earned income credit: $1,826 (reported on 23.6% of returns )Percentage of individuals using paid preparers for their 2004 taxes: 60.9%(% for various income ranges: 56.1% for AGIs below $10k , 65.4% for AGIs $10k-25k , 59.8% for AGIs $25k-50k , 58.5% for AGIs $50k-75k , 58.2% for AGIs $75k-100k , 67.1% for AGIs over 100k )
Estimated median household income in 2022: This zip code:
$58,741Arizona:
$74,568
Nearest zip codes: 85021 ,
85029 ,
85302 ,
85017 ,
85019 ,
85301 .
Phoenix Zip Code Map
Percentage of family households: This zip code:
44.9%Arizona:
43.6%
Percentage of households with unmarried partners: This zip code:
10.2%Arizona:
46.7%
Likely homosexual households (counted as self-reported same-sex unmarried-partner households)
Lesbian couples: 0.3% of all households Gay men: 0.0% of all households
Household received Food Stamps/SNAP in the past 12 months: 3,349Household did not receive Food Stamps/SNAP in the past 12 months: 13,123
Women who had a birth in the past 12 months: 918 (248 now married , 645 unmarried) Women who did not have a birth in the past 12 months: 10,253 (3,983 now married , 6,274 unmarried)
Housing units in zip code 85051 with a mortgage: 6,241 (483
second mortgage , 54
home equity loan , 370
both second mortgage and home equity loan )
Houses without a mortgage: 62
Median monthly owner costs for units with a mortgage: $1,325
Median monthly owner costs for units without a mortgage: $437
Residents with income below the poverty level in 2022:
This zip code:
17.2%Whole state:
12.5%
Residents with income below 50% of the poverty level in 2022:
This zip code:
8.8%Whole state:
6.0%
Median number of rooms in houses and condos: Median number of rooms in apartments: Notable locations in this zip code not listed on our city pages
Click to draw/clear zip code borders Notable locations in zip code 85051: (A) , Deer Valley Water Treatment Plant (B) , Deer Valley Filtration Plant (C) , Phoenix Public Library Cholla Branch (D) , Phoenix Fire Department Station 30 (E) . Display/hide their locations on the map
Shopping Centers: (1) , Dunlap Village Shopping Center (2) , Metrocenter Shopping Center (3) , Palm Glen Shopping Center (4) , Valley Fair Shopping Center (5) , Metro Marketplace Shopping Center (6) . Display/hide their locations on the map
Churches in zip code 85051 include: (A) , Trinity United Methodist Church (B) , Solid Rock Redeemed Christian Church (C) , Romanian Baptist Church (D) , Queen of the Holy Rosary Church (E) , Phoenix Free Presbyterian Church (F) , Orangewood Church of the Nazarene (G) , Orangewood Christian Reformed Church (H) , Mission Drive Baptist Church (I) . Display/hide their locations on the map
Parks in zip code 85051 include: (1) , Hoshoni Park (2) , Mariposa Park (3) , Cortez Park (4) . Display/hide their locations on the map
Tourist attractions (not listed on the city page) :
Year house built (houses)
42 2020 or later468 2010 to 2019474 2000 to 2009608 1990 to 19992,915 1980 to 19895,611 1970 to 19793,776 1960 to 19692,114 1950 to 1959330 1940 to 194985 1939 or earlier
Zip code 85051 household income distribution in 2022 989 Less than $10,000619 $10,000 to $14,999593 $15,000 to $19,999650 $20,000 to $24,999838 $25,000 to $29,9991,220 $30,000 to $34,999789 $35,000 to $39,999999 $40,000 to $44,999506 $45,000 to $49,9991,072 $50,000 to $59,9991,729 $60,000 to $74,9992,326 $75,000 to $99,9991,954 $100,000 to $124,999870 $125,000 to $149,999715 $150,000 to $199,999447 $200,000 or moreEstimate of home value of owner-occupied houses/condos in 2022 in zip code 85051 69 Less than $10,0005 $10,000 to $14,99919 $15,000 to $19,99923 $20,000 to $24,9994 $25,000 to $29,99927 $35,000 to $39,99923 $40,000 to $49,999123 $50,000 to $59,99922 $60,000 to $69,99912 $70,000 to $79,99973 $80,000 to $89,99938 $90,000 to $99,99989 $100,000 to $124,99977 $125,000 to $149,999359 $150,000 to $174,999323 $175,000 to $199,9991,311 $200,000 to $249,9991,082 $250,000 to $299,9992,070 $300,000 to $399,999766 $400,000 to $499,999184 $500,000 to $749,99946 $750,000 to $999,99967 $2,000,000 or moreRent paid by renters in 2022 in zip code 85051 48 $100 to $149254 $200 to $2492 $250 to $299102 $350 to $39930 $450 to $49945 $500 to $54933 $550 to $59955 $600 to $649204 $650 to $699163 $700 to $749503 $750 to $799961 $800 to $899877 $900 to $9991,343 $1,000 to $1,2491,037 $1,250 to $1,499531 $1,500 to $1,99976 $2,000 to $2,49938 $2,500 to $2,99995 No cash rent
Median gross rent in 2022: $1,242.
Median price asked for vacant for-sale houses and condos in 2022: $285,013.
Estimated median house (or condo) value in 2022 for: White Non-Hispanic householders: $319,468Black or African American householders: $314,001American Indian or Alaska Native householders: $295,550Asian householders: $385,412Some other race householders: $306,142Two or more races householders: $341,677Hispanic or Latino householders: $303,751Estimated median house or condo value in 2022: $317,077
85051:
$317,077Arizona:
$402,800
Lower value quartile - upper value quartile: $258,282 - $420,836
Mean price in 2022: Detached houses: $555,228Here:
$555,228State:
$521,408
Townhouses or other attached units: $365,046Here:
$365,046State:
$387,465
In 2-unit structures: $317,838Here:
$317,838State:
$1,060,724
In 3-to-4-unit structures: $313,141Here:
$313,141State:
$342,505
In 5-or-more-unit structures: $491,950Here:
$491,950State:
$371,286
Mobile homes: $100,620Here:
$100,620State:
$141,516
Occupied boats, RVs, vans, etc.: $68,114Here:
$68,114State:
$60,504
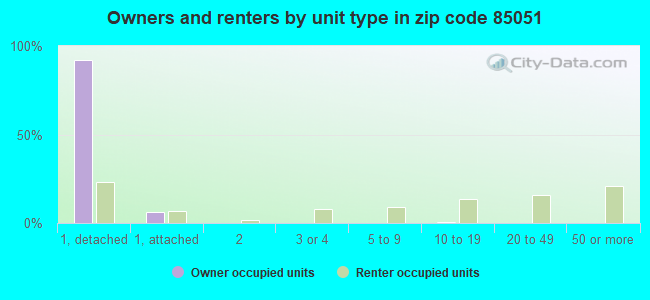
Housing units in structures:
One, detached: 10,245One, attached: 1,162Two: 1523 or 4: 6185 to 9: 78610 to 19: 1,17620 to 49: 1,15550 or more: 1,807Mobile homes: 115Boats, RVs, vans, etc.: 5Unemployment : 6.5%
Means of transportation to work in zip code 85051 61.7% 13,151 Drove a car alone18.0% 3,833 Carpooled2.0% 427 Bus or trolley bus0.1% 21 Railroad0.3% 73 Motorcycle0.6% 133 Bicycle1.0% 218 Walked3.8% 806 Other means9.6% 2,035 Worked at homeTravel time to work (commute) in zip code 85051 354 Less than 5 minutes971 5 to 9 minutes1,359 10 to 14 minutes3,038 15 to 19 minutes2,636 20 to 24 minutes1,234 25 to 29 minutes3,524 30 to 34 minutes712 35 to 39 minutes1,426 40 to 44 minutes2,295 45 to 59 minutes866 60 to 89 minutes240 90 or more minutes
Neighborhoods in zip code 85051: Percentage of zip code residents living and working in this county: 99.3%
Household type by relationship:
Households: 44,654
Male householders: 7,926 (2,678 living alone ), Female householders: 8,516 (2,467 living alone )5,796 spouses (5,749 opposite-sex spouses ), 1,863 unmarried partners , (1,736 opposite-sex unmarried partners ), 12,632 children (11,708 natural , 187 adopted , 731 stepchildren ), 1,841 grandchildren , 946 brothers or sisters , 1,180 parents , 0 foster children , 1,685 other relatives , 1,877 non-relatives In group quarters: 357 (-1 institutionalized population )
Size of family households: 2,815 2-persons , 2,920 3-persons , 1,843 4-persons , 1,295 5-persons , 494 6-persons , 411 7-or-more-persons
Size of nonfamily households: 5,149 1-person , 1,312 2-persons , 120 3-persons , 12 4-persons , 54 5-persons , 8 7-or-more-persons
3,986 married couples with children. single-parent households (789 men , 2,933 women ).
61.1% of residents of 85051 zip code speak English at home. of residents speak Spanish at home (66% very well, 20% well, 10% not well, 5% not at all ).of residents speak other Indo-European language at home (79% very well, 12% well, 4% not well, 6% not at all ).of residents speak Asian or Pacific Island language at home (53% very well, 22% well, 21% not well, 4% not at all ).of residents speak other language at home (56% very well, 38% well, 6% not well ).
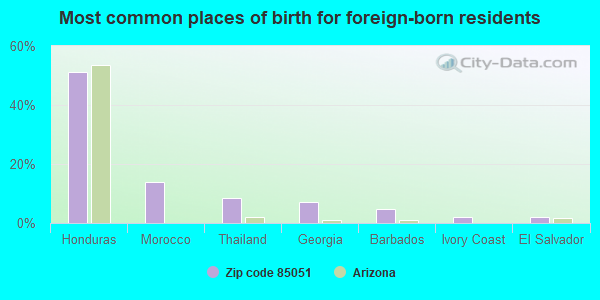
Foreign born population: 7,955 (17.8%)
(53.4%
of them are naturalized citizens )
This zip code:
17.8%Whole state:
13.1%
51% Honduras 14% Morocco 8% Thailand 7% Georgia 5% Barbados 2% Ivory Coast 2% El Salvador 5% Irish 3% American 3% English 3% German 2% Italian 2% European 1% Iraqi
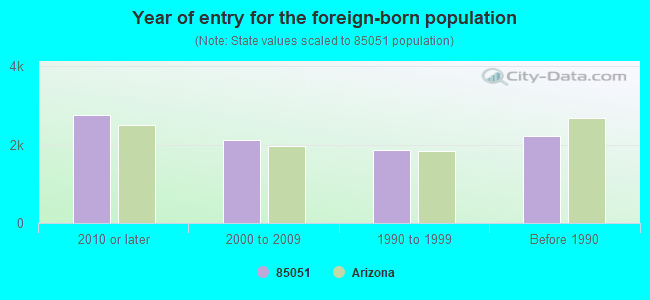
Year of entry for the foreign-born population
2,758 2010 or later 2,117 2000 to 2009 1,876 1990 to 1999 2,226 Before 1990
There are
212 Medical Specialists in Zip Code 85051 .
Major facilities with environmental interests located in this zip code:
CORTEZ HIGH SCHOOL (8828 N 31ST AVENUE in PHOENIX, AZ)
(Geographic Names Information System) (National Center for Education Statistics) - STATE ID-204 Conditionally Exempt Small Quantity Generators, less than 100 kg/month of hazardous waste (Resource Conservation and Recovery Act (tracking hazardous waste)) - notification Organizations: GLENDALE UNION HS DIST (CONTACT/OWNER)
, GLENDALE UNION HIGH SCHOOL DISTRICT (SCHOOL DISTRICT)
WASHINGTON ELEMENTARY SCHOOL (8033 N 27TH AVE in PHOENIX, AZ)
(Geographic Names Information System) (National Center for Education Statistics) - STATE ID-168 Organizations: WASHINGTON ELEMENTARY DISTRICT (SCHOOL DISTRICT)
ABRAHAM LINCOLN TRADITIONAL SCHOOL (10444 N 39TH AVENUE in PHOENIX, AZ)
(National Center for Education Statistics) - STATE ID-167 Organizations: WASHINGTON ELEMENTARY DISTRICT (SCHOOL DISTRICT)
ALTA VISTA ELEMENTARY SCHOOL (8710 N 31ST AVE in PHOENIX, AZ)
(National Center for Education Statistics) - STATE ID-116 Organizations: WASHINGTON ELEMENTARY DISTRICT (SCHOOL DISTRICT)
CACTUS WREN ELEMENTARY SCHOOL (9650 N 39TH AVE in PHOENIX, AZ)
(National Center for Education Statistics) - STATE ID-120 Organizations: WASHINGTON ELEMENTARY DISTRICT (SCHOOL DISTRICT)
CORTEZ PARK CHARTER ELEMENTARY SCHOOL (3535 W. DUNLAP AVE. in PHOENIX, AZ)
(National Center for Education Statistics) - STATE ID-101 Organizations: PATHFINDER CHARTER SCHOOL FOUNDATION (SCHOOL DISTRICT)
CORTEZ PARK CHARTER MIDDLE SCHOOL (3535 WEST DUNLAP AVENUE in PHOENIX, AZ)
(National Center for Education Statistics) - STATE ID-101 Organizations: CORTEZ PARK CHARTER MIDDLE SCHOOL, INC., DBA CORTEZ PARK CHA (SCHOOL DISTRICT)
EDUPRENEURSHIP STUDENT CENTER (ESC) PHOENIX (7310 N. 27TH AVE. in PHOENIX, AZ)
(National Center for Education Statistics) - STATE ID-102 Organizations: EDUPRENEURSHIP, INC. (SCHOOL DISTRICT)
NORTH POINTE PREPARATORY (10215 NORTH 43RD AVENUE in PHOENIX, AZ)
(National Center for Education Statistics) - STATE ID-001 Organizations: POINTE EDUCATIONAL SERVICES (SCHOOL DISTRICT)
PALO VERDE MIDDLE SCHOOL (7502 N 39TH AVE in PHOENIX, AZ)
(National Center for Education Statistics) - STATE ID-148 Organizations: WASHINGTON ELEMENTARY DISTRICT (SCHOOL DISTRICT)
VISTA CHARTER SCHOOL (7812 NORTH 27TH AVENUE in PHOENIX, AZ)
(National Center for Education Statistics) - STATE ID-001
AUTO GIANT (9201 N 29TH AVE in PHOENIX, AZ)
(Resource Conservation and Recovery Act (tracking hazardous waste)) Organizations: A G AUTOMOTIVE WAREHOUSE (CONTACT/OWNER)
FAST 1 HOUR FOTO (9858A METRO PARKWAY E #2121 in PHOENIX, AZ)
(Resource Conservation and Recovery Act (tracking hazardous waste)) Organizations: FAST FOTO INC (CONTACT/OWNER)
Housing units lacking complete plumbing facilities: 0.6%
Housing units lacking complete kitchen facilities: 2.2%
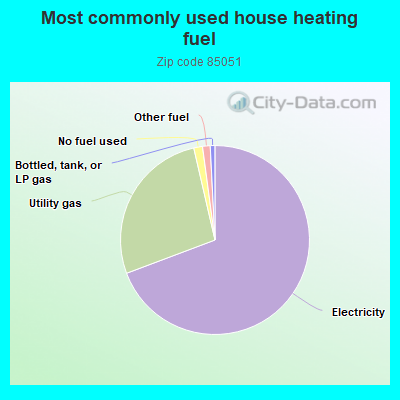
69.2% Electricity 27.1% Utility gas 1.5% No fuel used 1.3% Other fuel 0.8% Bottled, tank, or LP gas
Population in 1990: 35,671. Population change in the 1990s: +5,636 (+15.8%).
Place of birth for U.S.-born residents:
This state: 20,905Northeast: 1,802Midwest: 3,895South: 2,472West: 6,747
47% of the 85051 zip code residents lived in the same house 5 years ago.
Out of people who lived in different houses, 71% lived in this county.
Out of people who lived in different counties, 50% lived in Arizona.
88% of the 85051 zip code residents lived in the same house 1 year ago.
Out of people who lived in different houses, 74% moved from this county.
Out of people who lived in different houses, 5% moved from different county within same state.
Out of people who lived in different houses, 15% moved from different state.
Out of people who lived in different houses, 4% moved from abroad.
Private vs. public school enrollment:
Students in private schools in grades 1 to 8 (elementary and middle school): 396
Students in private schools in grades 9 to 12 (high school): 161
Students in private undergraduate colleges: 584
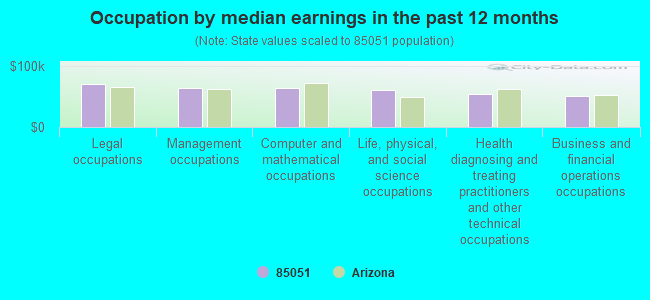
Occupation by median earnings in the past 12 months ($)
71,225 Legal occupations 64,917 Management occupations 64,082 Computer and mathematical occupations 60,365 Life, physical, and social science occupations 54,265 Health diagnosing and treating practitioners and other technical occupations 50,724 Business and financial operations occupations
Companies with federal contracts located in this zip code:
FOUR POINTS BARCELO HOTEL PHOE (10220 N METRO PARKWAY EAS in PHOENIX, AZ) in 13 contracts from 2001 to 2006
Contracts for Program Management/Support Services, Lodging - Hotel/Motel by Office of Justice Programs, Army, U.S. Army Corps of Engineers - civil program financing onlySigned by year: 2000: $0; 2001: $183,000; 2002: $16,000; 2003: $0; 2004: $5,990; 2005: $13,205; 2006: -$2,065.
Biggest contracts: with Office of Justice Programs for Program Management/Support Services. Signed on 2001-06-15. Completion date: 2001-06-15.
with Office of Justice Programs for Lodging - Hotel/Motel. Signed on 2001-09-15. Completion date: 2001-10-15.
, same as above. Signed on 2001-08-15. Completion date: 2002-01-15.
, same as above. Signed on 2002-12-15. Completion date: 2002-12-15.
COMPUSA INC (9630 NMETRO PKWY WEST in PHOENIX, AZ)
$6,893 with Army for ADP Support Equipment. Taking place in NM. Signed on 2004-07-01. Completion date: 2004-07-31.
Top industries in this zip code by the number of employees in 2005:
Accommodation and Food Services: Full-Service Restaurants (100-249 employees: 1 establishment, 50-99 employees: 3 establishments, 20-49 employees: 3 establishments, 10-19 employees: 2 establishments, 5-9 employees: 3 establishments, 1-4 employees: 4 establishments)Educational Services: Elementary and Secondary Schools (250-499: 1, 50-99: 1, 20-49: 1, 10-19: 1, 5-9: 1)Accommodation and Food Services: Limited-Service Restaurants (50-99: 1, 20-49: 7, 10-19: 8, 5-9: 8, 1-4: 3)Administrative and Support and Waste Management and Remediation Services: Temporary Help Services (100-249: 1, 50-99: 1)Professional, Scientific, and Technical Services: Administrative Management and General Management Consulting Services (100-249: 1, 20-49: 1, 10-19: 1, 1-4: 7)Real Estate and Rental and Leasing: Residential Property Managers (100-249: 1, 5-9: 3, 1-4: 2)Finance and Insurance: Other Activities Related to Credit Intermediation (100-249: 1, 5-9: 2, 1-4: 3)Management of Companies and Enterprises: Corporate, Subsidiary, and Regional Managing Offices (100-249: 1, 5-9: 2)
People in group quarters in 2010:
50 people in emergency and transitional shelters (with sleeping facilities) for people experiencing homelessness
48 people in group homes intended for adults
39 people in residential treatment centers for adults
27 people in workers' group living quarters and job corps centers
People in group quarters in 2000:
68 people in other noninstitutional group quarters
30 people in other group homes
28 people in nursing homes
27 people in homes for the mentally ill
6 people in homes or halfway houses for drug/alcohol abuse
4 people in schools, hospitals, or wards for the intellectually disabled
Fatal accident statistics in 2014:
Fatal accident count: 10Vehicles involved in fatal accidents: 15Fatal accidents caused by drunken drivers: 2Fatalities: 10Persons involved in fatal accidents: 24Pedestrians involved in fatal accidents: 4
Fatal accident statistics in 2013:
Fatal accident count: 4Vehicles involved in fatal accidents: 5Fatal accidents caused by drunken drivers: 1Fatalities: 4Persons involved in fatal accidents: 6Pedestrians involved in fatal accidents: 3
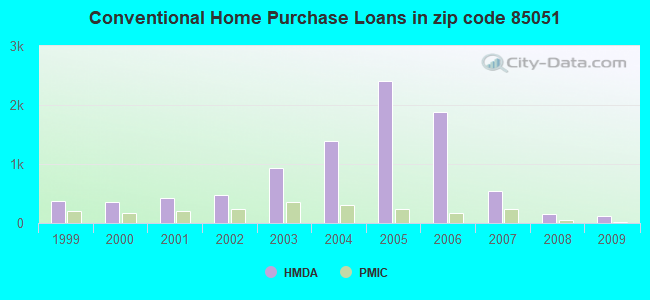
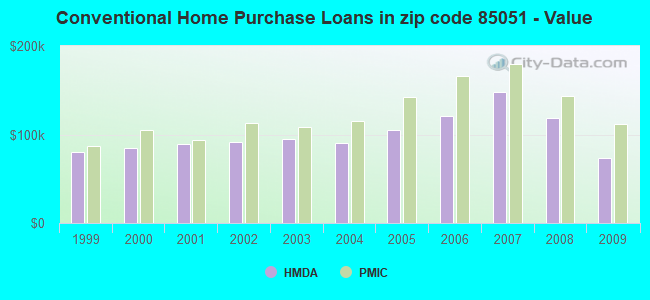
Home Mortgage Disclosure Act Aggregated Statistics For Year 2009(Based on 11 full and 4 partial tracts) A) FHA, FSA/RHS & VA B) Conventional C) Refinancings D) Home Improvement Loans E) Loans on Dwellings For 5+ Families F) Non-occupant Loans on Number Average Value Number Average Value Number Average Value Number Average Value Number Average Value Number Average Value
LOANS ORIGINATED 317 $96,627 123 $74,011 329 $130,508 11 $49,485 0 $0 56 $71,435 APPLICATIONS APPROVED, NOT ACCEPTED 25 $116,681 15 $111,214 55 $119,130 4 $18,000 0 $0 4 $77,155 APPLICATIONS DENIED 62 $95,995 36 $85,080 284 $129,127 34 $53,692 2 $499,900 34 $82,878 APPLICATIONS WITHDRAWN 38 $96,588 16 $81,559 100 $131,559 7 $34,459 0 $0 12 $95,958 FILES CLOSED FOR INCOMPLETENESS 11 $93,080 7 $98,840 39 $124,094 7 $77,896 0 $0 4 $156,825
Aggregated Statistics For Year 2008(Based on 11 full and 4 partial tracts) A) FHA, FSA/RHS & VA B) Conventional C) Refinancings D) Home Improvement Loans E) Loans on Dwellings For 5+ Families F) Non-occupant Loans on G) Loans On Manufactured Number Average Value Number Average Value Number Average Value Number Average Value Number Average Value Number Average Value Number Average Value
LOANS ORIGINATED 247 $143,184 147 $118,949 586 $142,864 76 $70,506 5 $1,443,706 104 $119,146 0 $0 APPLICATIONS APPROVED, NOT ACCEPTED 16 $177,295 34 $122,609 147 $136,952 23 $82,580 0 $0 30 $133,417 4 $59,995 APPLICATIONS DENIED 46 $141,201 90 $147,486 753 $163,359 87 $75,420 0 $0 86 $114,542 7 $45,424 APPLICATIONS WITHDRAWN 30 $146,243 35 $173,771 185 $155,122 21 $90,744 2 $220,955 16 $134,192 0 $0 FILES CLOSED FOR INCOMPLETENESS 7 $133,377 20 $140,015 71 $163,671 7 $53,283 0 $0 6 $151,953 0 $0
Aggregated Statistics For Year 2007(Based on 11 full and 4 partial tracts) A) FHA, FSA/RHS & VA B) Conventional C) Refinancings D) Home Improvement Loans E) Loans on Dwellings For 5+ Families F) Non-occupant Loans on G) Loans On Manufactured Number Average Value Number Average Value Number Average Value Number Average Value Number Average Value Number Average Value Number Average Value
LOANS ORIGINATED 32 $163,583 544 $148,129 1,479 $150,877 200 $88,324 6 $6,784,995 192 $150,701 1 $69,360 APPLICATIONS APPROVED, NOT ACCEPTED 2 $155,000 140 $147,600 310 $152,267 47 $64,107 0 $0 48 $147,646 7 $101,550 APPLICATIONS DENIED 16 $185,086 347 $149,483 1,318 $170,427 283 $112,000 3 $1,886,213 148 $153,589 6 $44,518 APPLICATIONS WITHDRAWN 6 $184,027 98 $152,238 446 $156,217 40 $94,897 2 $2,357,530 47 $141,830 0 $0 FILES CLOSED FOR INCOMPLETENESS 0 $0 59 $143,731 181 $172,138 21 $132,805 0 $0 10 $159,025 0 $0
Aggregated Statistics For Year 2006(Based on 11 full and 4 partial tracts) A) FHA, FSA/RHS & VA B) Conventional C) Refinancings D) Home Improvement Loans E) Loans on Dwellings For 5+ Families F) Non-occupant Loans on G) Loans On Manufactured Number Average Value Number Average Value Number Average Value Number Average Value Number Average Value Number Average Value Number Average Value
LOANS ORIGINATED 40 $168,304 1,877 $120,637 2,193 $147,968 309 $78,413 7 $2,564,637 444 $140,766 6 $24,233 APPLICATIONS APPROVED, NOT ACCEPTED 2 $129,000 376 $129,682 428 $148,102 66 $96,486 0 $0 118 $143,977 3 $31,533 APPLICATIONS DENIED 11 $171,535 945 $120,832 1,091 $154,908 265 $87,638 4 $174,965 183 $117,273 11 $60,609 APPLICATIONS WITHDRAWN 3 $157,667 477 $118,059 745 $149,386 57 $103,688 1 $101,000 108 $126,333 0 $0 FILES CLOSED FOR INCOMPLETENESS 0 $0 104 $131,105 280 $155,643 12 $97,231 0 $0 16 $162,183 0 $0
Aggregated Statistics For Year 2005(Based on 11 full and 4 partial tracts) A) FHA, FSA/RHS & VA B) Conventional C) Refinancings D) Home Improvement Loans E) Loans on Dwellings For 5+ Families F) Non-occupant Loans on G) Loans On Manufactured Number Average Value Number Average Value Number Average Value Number Average Value Number Average Value Number Average Value Number Average Value
LOANS ORIGINATED 79 $125,043 2,403 $105,415 2,365 $125,497 248 $78,045 5 $2,711,254 705 $111,934 0 $0 APPLICATIONS APPROVED, NOT ACCEPTED 6 $114,468 318 $98,650 377 $113,589 60 $62,527 0 $0 86 $104,484 9 $62,507 APPLICATIONS DENIED 11 $125,254 762 $101,369 1,149 $124,345 231 $60,684 3 $1,669,680 182 $104,464 17 $82,714 APPLICATIONS WITHDRAWN 9 $124,196 496 $115,227 723 $128,355 90 $90,514 0 $0 141 $119,170 0 $0 FILES CLOSED FOR INCOMPLETENESS 2 $103,185 91 $114,779 370 $135,274 17 $58,021 0 $0 22 $95,448 0 $0
Aggregated Statistics For Year 2004(Based on 11 full and 4 partial tracts) A) FHA, FSA/RHS & VA B) Conventional C) Refinancings D) Home Improvement Loans E) Loans on Dwellings For 5+ Families F) Non-occupant Loans on G) Loans On Manufactured Number Average Value Number Average Value Number Average Value Number Average Value Number Average Value Number Average Value Number Average Value
LOANS ORIGINATED 227 $118,571 1,383 $90,890 1,509 $96,324 171 $34,848 10 $1,573,014 369 $92,717 1 $10,540 APPLICATIONS APPROVED, NOT ACCEPTED 8 $115,870 217 $93,079 334 $98,619 41 $41,056 0 $0 54 $90,631 5 $46,552 APPLICATIONS DENIED 27 $106,126 443 $84,136 858 $101,508 208 $30,691 1 $34,270 86 $82,402 22 $48,363 APPLICATIONS WITHDRAWN 21 $122,809 178 $100,853 600 $104,151 39 $38,263 0 $0 44 $106,612 0 $0 FILES CLOSED FOR INCOMPLETENESS 3 $138,083 30 $97,421 155 $106,690 4 $37,500 0 $0 10 $91,986 0 $0
Aggregated Statistics For Year 2003(Based on 11 full and 4 partial tracts) A) FHA, FSA/RHS & VA B) Conventional C) Refinancings D) Home Improvement Loans E) Loans on Dwellings For 5+ Families F) Non-occupant Loans on Number Average Value Number Average Value Number Average Value Number Average Value Number Average Value Number Average Value
LOANS ORIGINATED 371 $106,968 924 $94,377 2,947 $89,030 97 $21,577 9 $2,505,269 383 $90,660 APPLICATIONS APPROVED, NOT ACCEPTED 11 $96,600 131 $100,785 501 $92,052 23 $28,175 0 $0 73 $105,393 APPLICATIONS DENIED 48 $111,270 298 $95,073 1,131 $91,140 108 $25,167 1 $690,980 137 $93,358 APPLICATIONS WITHDRAWN 29 $96,836 147 $101,524 839 $94,143 13 $35,761 0 $0 79 $96,387 FILES CLOSED FOR INCOMPLETENESS 6 $108,117 21 $111,645 140 $100,925 5 $30,174 0 $0 13 $84,428
Aggregated Statistics For Year 2002(Based on 7 full and 4 partial tracts) A) FHA, FSA/RHS & VA B) Conventional C) Refinancings D) Home Improvement Loans E) Loans on Dwellings For 5+ Families F) Non-occupant Loans on Number Average Value Number Average Value Number Average Value Number Average Value Number Average Value Number Average Value
LOANS ORIGINATED 231 $111,432 474 $91,870 1,484 $93,327 60 $29,677 8 $1,222,452 180 $81,217 APPLICATIONS APPROVED, NOT ACCEPTED 10 $123,651 78 $94,151 269 $86,895 24 $21,982 0 $0 23 $108,130 APPLICATIONS DENIED 18 $107,736 103 $88,161 540 $88,445 105 $23,397 0 $0 27 $85,607 APPLICATIONS WITHDRAWN 27 $106,710 49 $108,252 344 $99,875 18 $30,758 0 $0 23 $90,866 FILES CLOSED FOR INCOMPLETENESS 2 $80,285 26 $93,176 82 $104,320 1 $65,000 0 $0 5 $127,146
Aggregated Statistics For Year 2001(Based on 7 full and 4 partial tracts) A) FHA, FSA/RHS & VA B) Conventional C) Refinancings D) Home Improvement Loans E) Loans on Dwellings For 5+ Families F) Non-occupant Loans on Number Average Value Number Average Value Number Average Value Number Average Value Number Average Value Number Average Value
LOANS ORIGINATED 320 $110,652 422 $89,022 1,294 $85,772 93 $17,390 6 $374,228 125 $79,760 APPLICATIONS APPROVED, NOT ACCEPTED 7 $98,096 67 $84,092 189 $85,690 27 $16,904 1 $448,120 15 $88,809 APPLICATIONS DENIED 37 $107,026 125 $79,477 619 $77,025 99 $22,248 0 $0 41 $72,532 APPLICATIONS WITHDRAWN 19 $112,619 64 $108,431 347 $90,620 17 $26,118 0 $0 19 $85,712 FILES CLOSED FOR INCOMPLETENESS 2 $77,580 25 $96,409 50 $93,437 0 $0 1 $790,800 4 $101,702
Aggregated Statistics For Year 2000(Based on 7 full and 4 partial tracts) A) FHA, FSA/RHS & VA B) Conventional C) Refinancings D) Home Improvement Loans E) Loans on Dwellings For 5+ Families F) Non-occupant Loans on Number Average Value Number Average Value Number Average Value Number Average Value Number Average Value Number Average Value
LOANS ORIGINATED 238 $103,378 348 $84,298 373 $66,833 123 $18,608 5 $1,227,000 75 $70,098 APPLICATIONS APPROVED, NOT ACCEPTED 8 $92,422 33 $80,733 109 $71,081 90 $20,020 0 $0 7 $66,484 APPLICATIONS DENIED 32 $89,189 104 $66,419 340 $65,180 118 $22,727 1 $101,220 25 $77,838 APPLICATIONS WITHDRAWN 21 $105,154 41 $71,139 147 $67,995 26 $27,904 0 $0 11 $64,759 FILES CLOSED FOR INCOMPLETENESS 5 $77,050 12 $96,782 88 $89,106 1 $21,620 0 $0 1 $80,000
Aggregated Statistics For Year 1999(Based on 5 full and 3 partial tracts) A) FHA, FSA/RHS & VA B) Conventional C) Refinancings D) Home Improvement Loans E) Loans on Dwellings For 5+ Families F) Non-occupant Loans on Number Average Value Number Average Value Number Average Value Number Average Value Number Average Value Number Average Value
LOANS ORIGINATED 387 $84,038 378 $80,715 729 $65,096 129 $18,556 3 $273,627 91 $60,472 APPLICATIONS APPROVED, NOT ACCEPTED 17 $84,064 57 $69,488 198 $64,208 58 $19,519 0 $0 20 $66,956 APPLICATIONS DENIED 34 $89,120 148 $72,160 366 $60,032 191 $16,115 1 $380,990 30 $51,098 APPLICATIONS WITHDRAWN 28 $80,175 59 $78,941 228 $67,662 22 $24,966 1 $928,990 13 $60,982 FILES CLOSED FOR INCOMPLETENESS 9 $72,101 23 $86,870 115 $70,070 7 $20,457 0 $0 6 $61,688
Private Mortgage Insurance Companies Aggregated Statistics For Year 2009(Based on 9 full and 4 partial tracts) A) Conventional B) Refinancings C) Non-occupant Loans on Number Average Value Number Average Value Number Average Value
LOANS ORIGINATED 16 $111,620 3 $113,287 2 $57,910 APPLICATIONS APPROVED, NOT ACCEPTED 5 $99,196 0 $0 2 $134,000 APPLICATIONS DENIED 3 $79,650 0 $0 0 $0 APPLICATIONS WITHDRAWN 0 $0 0 $0 0 $0 FILES CLOSED FOR INCOMPLETENESS 1 $174,000 0 $0 1 $174,000
Aggregated Statistics For Year 2008(Based on 11 full and 4 partial tracts) A) Conventional B) Refinancings C) Non-occupant Loans on Number Average Value Number Average Value Number Average Value
LOANS ORIGINATED 57 $143,291 48 $166,540 4 $132,122 APPLICATIONS APPROVED, NOT ACCEPTED 56 $171,198 33 $193,302 6 $129,345 APPLICATIONS DENIED 12 $145,511 3 $178,637 1 $155,000 APPLICATIONS WITHDRAWN 6 $203,033 6 $200,918 0 $0 FILES CLOSED FOR INCOMPLETENESS 4 $169,815 2 $170,500 2 $205,500
Aggregated Statistics For Year 2007(Based on 11 full and 4 partial tracts) A) Conventional B) Refinancings C) Non-occupant Loans on Number Average Value Number Average Value Number Average Value
LOANS ORIGINATED 238 $179,331 138 $189,421 36 $167,414 APPLICATIONS APPROVED, NOT ACCEPTED 42 $210,542 18 $190,689 7 $225,789 APPLICATIONS DENIED 10 $186,303 5 $166,000 3 $205,000 APPLICATIONS WITHDRAWN 11 $214,770 11 $263,397 2 $223,000 FILES CLOSED FOR INCOMPLETENESS 0 $0 0 $0 0 $0
Aggregated Statistics For Year 2006(Based on 11 full and 4 partial tracts) A) Conventional B) Refinancings C) Non-occupant Loans on D) Loans On Manufactured Number Average Value Number Average Value Number Average Value Number Average Value
LOANS ORIGINATED 168 $165,927 65 $186,436 15 $151,883 0 $0 APPLICATIONS APPROVED, NOT ACCEPTED 20 $164,091 22 $152,196 4 $98,415 1 $234,000 APPLICATIONS DENIED 24 $171,690 2 $228,545 6 $53,990 0 $0 APPLICATIONS WITHDRAWN 11 $178,225 5 $208,740 1 $248,500 0 $0 FILES CLOSED FOR INCOMPLETENESS 1 $205,000 1 $83,820 0 $0 0 $0
Aggregated Statistics For Year 2005(Based on 11 full and 4 partial tracts) A) Conventional B) Refinancings C) Non-occupant Loans on Number Average Value Number Average Value Number Average Value
LOANS ORIGINATED 238 $142,618 108 $144,383 56 $119,662 APPLICATIONS APPROVED, NOT ACCEPTED 30 $138,278 20 $129,921 12 $126,202 APPLICATIONS DENIED 1 $219,000 1 $119,000 1 $148,000 APPLICATIONS WITHDRAWN 3 $141,667 4 $174,645 0 $0 FILES CLOSED FOR INCOMPLETENESS 2 $54,990 1 $120,000 0 $0
Aggregated Statistics For Year 2004(Based on 11 full and 4 partial tracts) A) Conventional B) Refinancings C) Non-occupant Loans on Number Average Value Number Average Value Number Average Value
LOANS ORIGINATED 302 $115,005 157 $117,474 51 $99,597 APPLICATIONS APPROVED, NOT ACCEPTED 42 $116,326 72 $116,697 15 $105,003 APPLICATIONS DENIED 10 $102,310 0 $0 4 $71,985 APPLICATIONS WITHDRAWN 13 $109,415 7 $104,469 3 $103,930 FILES CLOSED FOR INCOMPLETENESS 5 $103,392 5 $117,380 0 $0
Aggregated Statistics For Year 2003(Based on 11 full and 4 partial tracts) A) Conventional B) Refinancings C) Non-occupant Loans on Number Average Value Number Average Value Number Average Value
LOANS ORIGINATED 362 $108,787 338 $107,072 91 $98,782 APPLICATIONS APPROVED, NOT ACCEPTED 33 $119,404 92 $108,888 11 $109,476 APPLICATIONS DENIED 13 $127,674 3 $62,520 4 $141,032 APPLICATIONS WITHDRAWN 17 $120,229 14 $102,675 4 $147,420 FILES CLOSED FOR INCOMPLETENESS 1 $275,200 0 $0 1 $275,200
Aggregated Statistics For Year 2002(Based on 7 full and 4 partial tracts) A) Conventional B) Refinancings C) Non-occupant Loans on Number Average Value Number Average Value Number Average Value
LOANS ORIGINATED 231 $112,986 190 $114,947 42 $100,618 APPLICATIONS APPROVED, NOT ACCEPTED 24 $126,814 55 $113,372 1 $49,560 APPLICATIONS DENIED 5 $118,740 12 $116,737 5 $109,972 APPLICATIONS WITHDRAWN 1 $132,000 8 $105,990 0 $0 FILES CLOSED FOR INCOMPLETENESS 0 $0 0 $0 0 $0
Aggregated Statistics For Year 2001(Based on 7 full and 4 partial tracts) A) Conventional B) Refinancings C) Non-occupant Loans on Number Average Value Number Average Value Number Average Value
LOANS ORIGINATED 197 $94,173 198 $107,164 27 $79,629 APPLICATIONS APPROVED, NOT ACCEPTED 31 $85,553 40 $111,766 14 $91,741 APPLICATIONS DENIED 12 $116,912 13 $94,562 11 $107,653 APPLICATIONS WITHDRAWN 4 $98,410 4 $81,690 0 $0 FILES CLOSED FOR INCOMPLETENESS 1 $114,000 0 $0 0 $0
Aggregated Statistics For Year 2000(Based on 7 full and 4 partial tracts) A) Conventional B) Refinancings C) Non-occupant Loans on Number Average Value Number Average Value Number Average Value
LOANS ORIGINATED 165 $105,015 42 $103,980 18 $71,873 APPLICATIONS APPROVED, NOT ACCEPTED 25 $84,720 6 $91,445 4 $47,990 APPLICATIONS DENIED 12 $92,332 3 $102,653 4 $62,710 APPLICATIONS WITHDRAWN 6 $78,613 1 $41,650 1 $54,830 FILES CLOSED FOR INCOMPLETENESS 1 $81,000 0 $0 0 $0
Aggregated Statistics For Year 1999(Based on 5 full and 3 partial tracts) A) Conventional B) Refinancings C) Non-occupant Loans on Number Average Value Number Average Value Number Average Value
LOANS ORIGINATED 195 $87,460 93 $84,627 32 $88,839 APPLICATIONS APPROVED, NOT ACCEPTED 16 $82,124 13 $99,895 3 $94,463 APPLICATIONS DENIED 18 $85,969 6 $89,285 8 $83,749 APPLICATIONS WITHDRAWN 10 $92,238 7 $85,770 1 $71,000 FILES CLOSED FOR INCOMPLETENESS 2 $87,205 4 $60,902 3 $50,283
Most common first names in zip code 85051 among deceased individuals Name Count Lived (average)
Mary 135 79.7 years John 115 74.9 years Robert 103 68.8 years William 91 72.0 years James 88 67.3 years Joseph 57 74.0 years Richard 56 67.0 years Dorothy 53 78.5 years Margaret 52 81.1 years Helen 51 81.8 years
Most common last names in zip code 85051 among deceased individuals Last name Count Lived (average)
Smith 39 76.2 years Brown 29 77.7 years Jones 27 70.0 years Johnson 27 76.8 years Miller 25 78.1 years Williams 23 74.3 years Young 21 74.9 years Phillips 19 77.0 years Allen 15 72.4 years Clark 15 72.6 years
Businesses in zip code 85051
Name Count Name Count
24 Hour Fitness 1 Little Caesars Pizza 1 7-Eleven 1 Long John Silver's 1 AT&T 1 Marriott 1 Aeropostale 1 McDonald's 1 American Eagle Outfitters 1 Men's Wearhouse 1 Barnes & Noble 1 Motel 6 1 Bath & Body Works 1 Motherhood Maternity 1 Bed Bath & Beyond 1 New Balance 3 Blockbuster 1 Nike 6 CVS 1 OfficeMax 1 Catherines 1 Old Country Buffet 1 Charlotte Russe 1 Olive Garden 1 Chuck E. Cheese's 1 Papa John's Pizza 1 Cinnabon 2 Payless 1 ColorTyme 1 PetSmart 1 Cricket Wireless 7 RadioShack 2 Dairy Queen 3 Red Lobster 1 Deb 1 SAS Shoes 1 Dennys 1 Safeway 1 Discount Tire 1 Sears 4 Domino's Pizza 2 Spencer Gifts 1 Famous Footwear 1 Sprint Nextel 2 FedEx 2 Starbucks 1 Finish Line 1 Subway 4 Foot Locker 1 Super 8 1 Fredericks Of Hollywood 1 T-Mobile 5 GNC 1 Torrid 1 GameStop 2 Toys"R"Us 1 H&R Block 3 U-Haul 1 Hot Topic 1 UPS 2 Jack In The Box 2 Vans 6 Jones New York 2 Verizon Wireless 2 Journeys 1 Victoria's Secret 1 Kmart 1 Vons 1 Lane Furniture 1 Walgreens 3 LensCrafters 1 Wet Seal 1

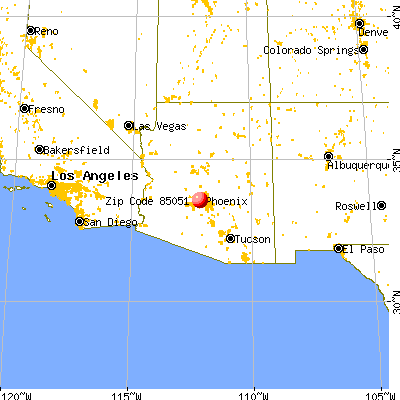


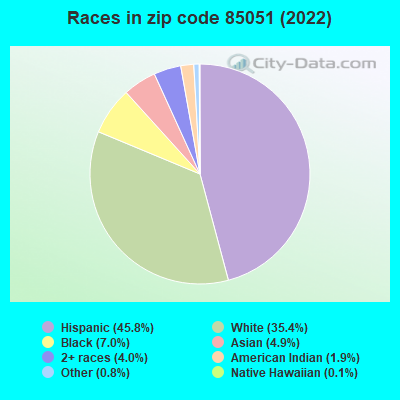


 Nearest zip codes: 85021, 85029, 85302, 85017, 85019, 85301.