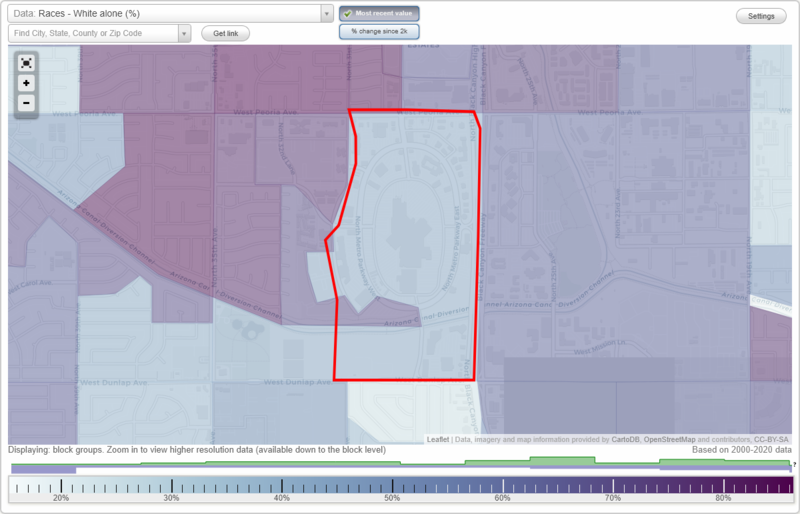
Metrocenter neighborhood in Phoenix, Arizona (AZ), 85051 detailed profile
Settings
X

Business Search - 14 Million verified businesses
Area: 0.506 square miles
Population: 1,257
Population density:
| Metrocenter: | 2,483 people per square mile |
| Phoenix: | 3,463 people per square mile |

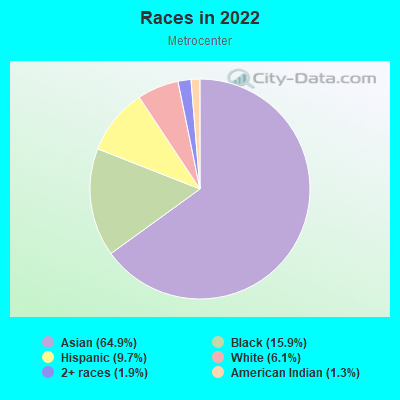
- 3,36864.9%Asian
- 82615.9%Black
- 5029.7%Hispanic or Latino
- 3176.1%White
- 981.9%Two or more races
- 691.3%American Indian
- 50.10%Native Hawaiian and Other
Pacific Islander - 20.04%Some other race
Median household income in 2022:
| Metrocenter: | $70,738 |
| Phoenix: | $75,969 |
Distribution of median household income
![Distribution of median household income]()
- 427Less than $10,000
- 704$10,000 to $19,999
- 1,187$20,000 to $29,999
- 88$30,000 to $39,999
- 47$40,000 to $49,999
- 291$50,000 to $59,999
- 67$60,000 to $74,999
- 101$75,000 to $99,999
- 24$100,000 to $124,999
- 246$125,000 to $149,999
- 925$150,000 to $199,999
- 15$200,000 or more

Distribution of owner-occupied house/condo value
![Distribution of owner-occupied house/condo value]()
- 19Less than $50,000
- 226$50,000 to $99,999
- 137$100,000 to $149,999
- 661$150,000 to $199,999
- 51$200,000 to $249,999
- 40$250,000 to $299,999
- 255$300,000 to $399,999
- 66$400,000 to $499,999
- 16$750,000 to $999,999

Distribution of rent paid by renters
![Distribution of rent paid by renters]()
- 228$200 to $299
- 13$300 to $399
- 62$500 to $599
- 10$600 to $699
- 1,125$700 to $799
- 1,203$800 to $899
- 1,230$900 to $999
- 214$1,000 to $1,249
- 312$1,250 to $1,499
- 4$1,500 to $1,999
- 6$2,000 or more

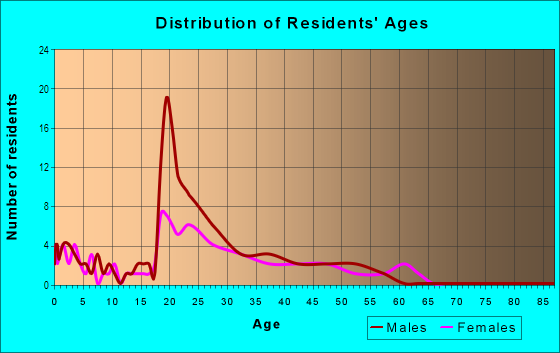
| Males: | 565 |
| Females: | 692 |
Males:
| This neighborhood: | 29.5 years |
| Whole city: | 34.5 years |
| This neighborhood: | 40.0 years |
| Whole city: | 35.5 years |
Average household size:
| Metrocenter: | 3.0 people |
| Phoenix: | 2.6 people |
Percentage of family households:
| Metrocenter: | 41.5% |
| Phoenix: | 47.6% |
| Here: | 21.0% |
| Phoenix: | 40.6% |
Percentage of married-couple families with children (among all households):
| Metrocenter: | 3.1% |
| Phoenix: | 23.4% |
Percentage of single-mother households (among all households):
| Metrocenter: | 28.8% |
| Phoenix: | 9.9% |
Percentage of never married males 15 years old and over:
Percentage of never married females 15 years old and over:
| Metrocenter: | 21.9% |
| Phoenix: | 21.5% |
Percentage of never married females 15 years old and over:
| Metrocenter: | 17.8% |
| city: | 19.5% |
Percentage of people that speak English not well or not at all:
| Metrocenter: | 0.7% |
| Phoenix: | 7.7% |
Percentage of people born in this state:
Percentage of people born in another U.S. state:
Percentage of native residents but born outside the U.S.:
Percentage of foreign born residents:
| Here: | 37.0% |
| Phoenix: | 41.1% |
Percentage of people born in another U.S. state:
| Metrocenter: | 44.8% |
| Phoenix: | 37.7% |
Percentage of native residents but born outside the U.S.:
| Here: | 5.3% |
| city: | 1.5% |
Percentage of foreign born residents:
| Here: | 13.0% |
| Phoenix: | 19.6% |
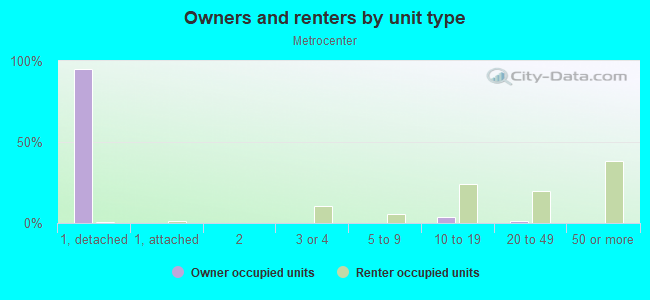
Owner-occupied
Renter-occupied

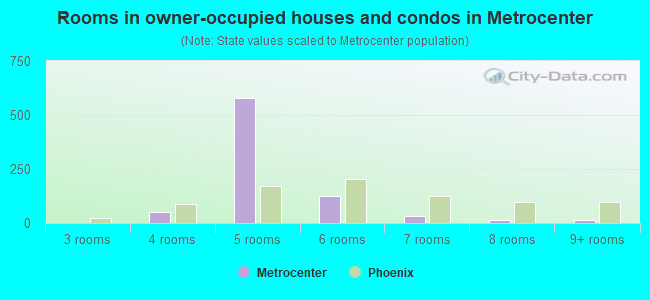
- Rooms in owner-occupied houses and condos in Metrocenter
- 01 room
- 02 rooms
- 23 rooms
- 514 rooms
- 5795 rooms
- 1276 rooms
- 317 rooms
- 158 rooms
- 129+ rooms
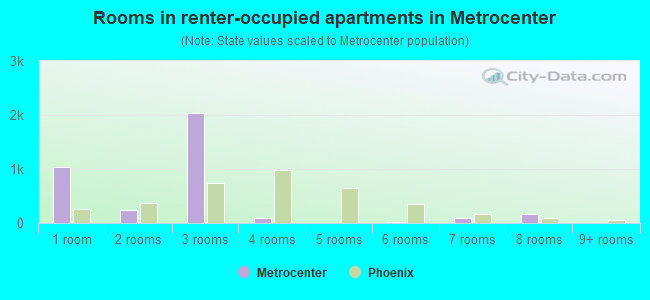
- Rooms in renter-occupied apartments in Metrocenter
- 1,0411 room
- 2402 rooms
- 2,0363 rooms
- 904 rooms
- 45 rooms
- 146 rooms
- 947 rooms
- 1698 rooms
- 39+ rooms
Owner-occupied
Renter-occupied
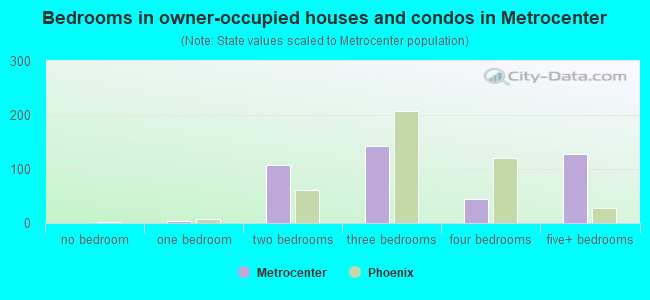
- Bedrooms in owner-occupied houses and condos in Metrocenter
- 0no bedroom
- 31 bedroom
- 1082 bedrooms
- 1423 bedrooms
- 454 bedrooms
- 1275+ bedrooms
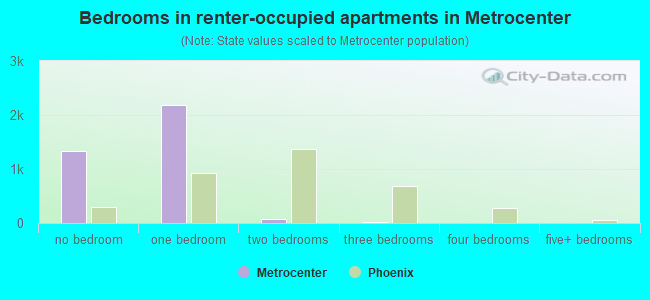
- Bedrooms in renter-occupied apartments in Metrocenter
- 1,332no bedroom
- 2,1771 bedroom
- 782 bedrooms
- 153 bedrooms
- 34 bedrooms
- 05+ bedrooms
Average number of cars or other vehicles available in houses/condos:
Average number of cars or other vehicles available in apartments:
| This neighborhood: | 1.9 |
| Phoenix: | 2.1 |
Average number of cars or other vehicles available in apartments:
| Here: | 0.8 |
| city: | 1.5 |
Percentage of units with a mortgage:
| Metrocenter: | 62.0% |
| Phoenix: | 66.1% |
Average estimated value of detached houses in 2022 (37.9% of all units):
| Metrocenter: | $293,916 |
| Phoenix: | $555,228 |
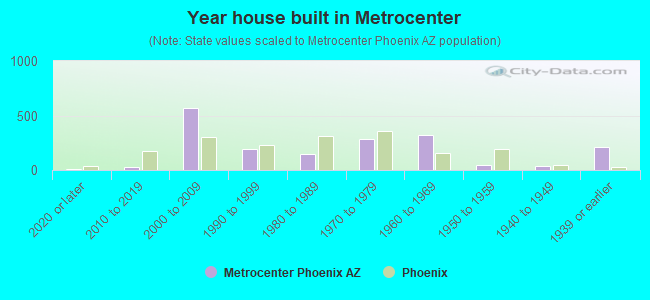
- Year house built in Metrocenter
- 52020 or later
- 282010 to 2019
- 5682000 to 2009
- 1901990 to 1999
- 1461980 to 1989
- 2841970 to 1979
- 3251960 to 1969
- 421950 to 1959
- 411940 to 1949
- 2131939 or earlier
City-data.com crime index for city in 2020 (higher means more crime):
| City: | 386.0 |
| U.S. average: | 219.5 |
Travel time to work (commute)
![Travel time to work (commute)]()
- 8Less than 5 minutes
- 545 to 9 minutes
- 2610 to 14 minutes
- 10315 to 19 minutes
- 12020 to 24 minutes
- 1625 to 29 minutes
- 9330 to 34 minutes
- 5535 to 39 minutes
- 3040 to 44 minutes
- 9745 to 59 minutes
- 5560 to 89 minutes
- 1590 or more minutes

Means of transportation to work
![Means of transportation to work]()
- 73.5%412Drove a car alone
- 8.0%45Carpooled
- 51.7%290Bus
- 10.0%56Motorcycle
- 3.6%20Bicycle
- 85.1%477Walked
- 10.2%57Other means
- 27.7%155Worked at home

Time leaving home to go to work
![Time leaving home to go to work]()
- 6912:00 a.m. to 4:59 a.m.
- 225:00 a.m. to 5:29 a.m.
- 685:30 a.m. to 5:59 a.m.
- 736:00 a.m. to 6:29 a.m.
- 596:30 a.m. to 6:59 a.m.
- 947:00 a.m. to 7:29 a.m.
- 887:30 a.m. to 7:59 a.m.
- 428:00 a.m. to 8:29 a.m.
- 318:30 a.m. to 8:59 a.m.
- 429:00 a.m. to 9:59 a.m.
- 1510:00 a.m. to 10:59 a.m.
- 3012:00 p.m. to 3:59 p.m.
- 744:00 p.m. to 11:59 p.m.

Occupations of males:
- Percentage of males in architecture and engineering occupations:
Here: 6.0% city: 3.0%
- Percentage of males in life, physical, and social science occupations:
Here: 4.1% city: 0.6%
- Percentage of males in education, training, and library occupations:
Here: 4.4% city: 2.3%
- Percentage of males in arts, design, entertainment, sports, and media occupations:
Here: 3.0% city: 2.0%
- Percentage of males in healthcare practitioners and technical occupations:
Here: 7.1% city: 3.1%
- Percentage of males in service occupations:
Here: 13.8% city: 15.1%
- Percentage of males in sales and office occupations:
Here: 33.8% city: 16.9%
- Percentage of males in construction, extraction, and maintenance occupations:
Here: 23.3% city: 11.6%
- Percentage of males in material moving occupations:
Here: 6.0% city: 5.8%
Occupations of females:
- Percentage of females in management occupations (except farmers):
Here: 12.3% city: 10.0%
- Percentage of females in legal occupations:
Here: 2.6% city: 1.6%
- Percentage of females in education, training, and library occupations:
Here: 1.4% city: 6.9%
- Percentage of females in healthcare practitioners and technical occupations:
Here: 21.5% city: 8.4%
- Percentage of females in service occupations:
Here: 11.6% city: 20.7%
- Percentage of females in sales and office occupations:
Here: 41.7% city: 29.2%
- Percentage of females in production occupations:
Here: 3.5% city: 2.6%
- Percentage of females in transportation occupations:
Here: 8.0% city: 1.4%
- Percentage of females in material moving occupations:
Here: 1.5% city: 3.0%
Percentage of people 16-64 in Armed Forces:
| Metrocenter: | 0.0% |
| Phoenix: | 0.1% |
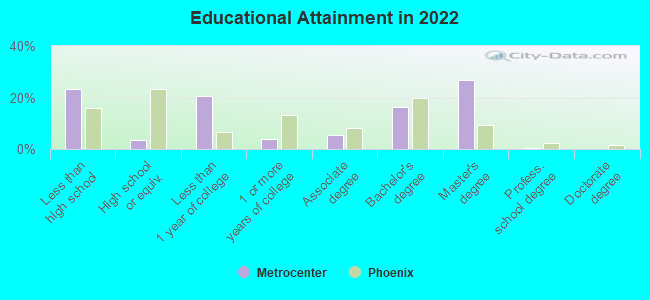
Education in this neighborhood (subdivision or community):
- Percentage of people 3 years and older in K-12 schools:
Metrocenter: 102.8% Phoenix: 17.9%
- Percentage of people 3 years and older in undergraduate colleges:
Metrocenter: 6.6% Phoenix: 4.8%
- Percentage of people 3 years and older in grad. or professional schools:
Metrocenter: 11.9% Phoenix: 1.2%
- Percentage of students K-12 enrolled in private schools:
Metrocenter: 21.2% Phoenix: 8.5%
Percentage of population below poverty level:
| Metrocenter: | 24.3% |
| Phoenix: | 13.9% |
Median year owner moved in (as recorded in 2022):
| Metrocenter: | 2008 |
| Phoenix: | 2013 |
Percentage of married-couple families with both working:
| Metrocenter: | 8657.1% |
| Phoenix: | 61.2% |
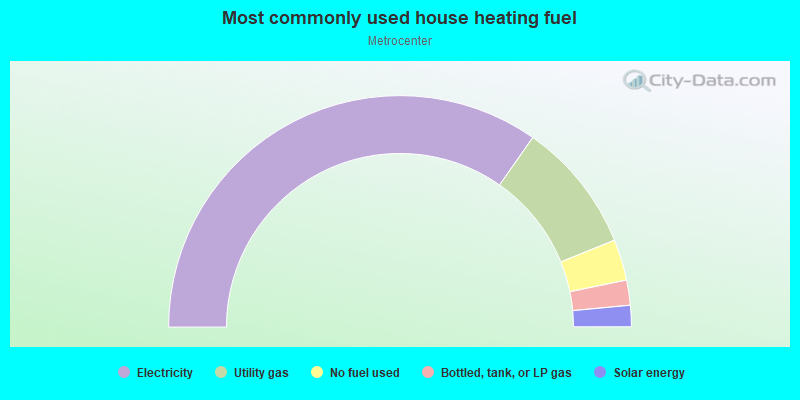
- 69.4%Electricity
- 18.3%Utility gas
- 5.7%No fuel used
- 3.5%Bottled, tank, or LP gas
- 3.0%Solar energy
Limited-access highways (interstate or state) in this neighborhood:
I- 17 (Black Canyon Fwy)
Length: 0.41 miles
Direction: N-S
Direction: N-S
Roads and streets:
Metro Park W
Length: 0.88 miles
Directions: E-W, N-S, SE-NW, SW-NE
Address range: 9200 to 10299
Directions: E-W, N-S, SE-NW, SW-NE
Address range: 9200 to 10299
Metro Park E
Length: 0.83 miles
Directions: E-W, N-S, SE-NW, SW-NE
Address range: 9200 to 10299
Directions: E-W, N-S, SE-NW, SW-NE
Address range: 9200 to 10299
N Black Canyon Hwy
Length: 0.78 miles
Direction: N-S
Address range: 9348 to 10598
Direction: N-S
Address range: 9348 to 10598
Arizona Canal
Length: 0.52 miles
Direction: E-W
Direction: E-W
W Peoria Ave
Length: 0.45 miles
Direction: E-W
Address range: 2711 to 3049
Direction: E-W
Address range: 2711 to 3049
N 29th Ave
Length: 0.27 miles
Direction: N-S
Address range: 9000 to 9299
Direction: N-S
Address range: 9000 to 9299
N 31st Ave
Length: 0.26 miles
Directions: E-W, N-S, SE-NW
Address range: 9400 to 9749
Directions: E-W, N-S, SE-NW
Address range: 9400 to 9749
W North Ln
Length: 0.26 miles
Directions: E-W, N-S, SE-NW, SW-NE
Address range: 2700 to 2799
Directions: E-W, N-S, SE-NW, SW-NE
Address range: 2700 to 2799
W Cheryl Dr
Length: 0.13 miles
Direction: E-W
Address range: 2700 to 2899
Direction: E-W
Address range: 2700 to 2899
N 28th Dr
Length: 0.13 miles
Direction: N-S
Address range: 10200 to 10613
Direction: N-S
Address range: 10200 to 10613
N Metro Pkwy
Length: 0.13 miles
Direction: N-S
Address range: 10201 to 10237
Direction: N-S
Address range: 10201 to 10237
W Mission Ln
Length: 0.11 miles
Directions: E-W, SW-NE
Address range: 3000 to 3099
Directions: E-W, SW-NE
Address range: 3000 to 3099
N 27th Dr
Length: 0.07 miles
Direction: N-S
Address range: 10400 to 10499
Direction: N-S
Address range: 10400 to 10499
N 27th Ave
Length: 0.06 miles
Direction: SW-NE
Address range: 10200 to 10299
Direction: SW-NE
Address range: 10200 to 10299
Other features:
Arizona Cnl
Length: 0.53 miles
Direction: E-W
Direction: E-W