Estimated zip code population in 2022: 2,485 Zip code population in 2010: 2,707 Zip code population in 2000: 3,671
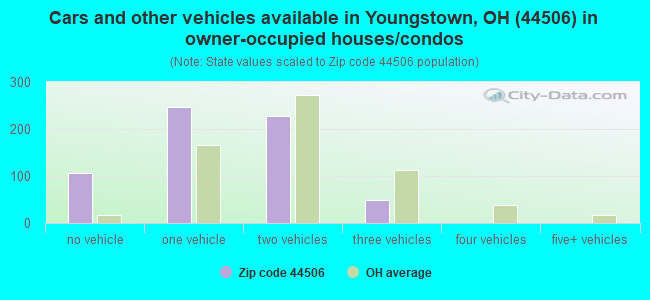
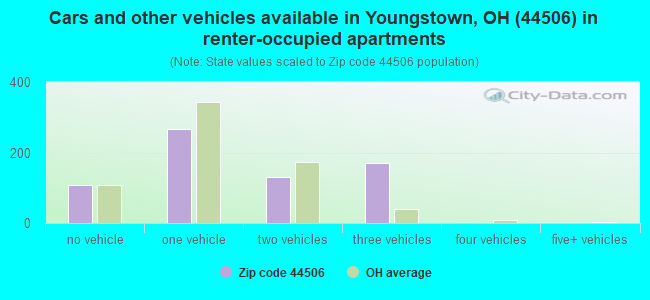
Houses and condos: 1,481 Renter-occupied apartments: 676
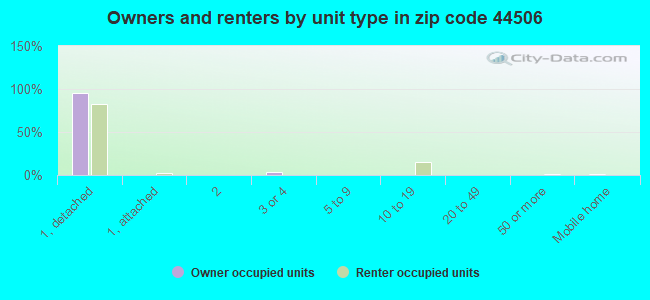
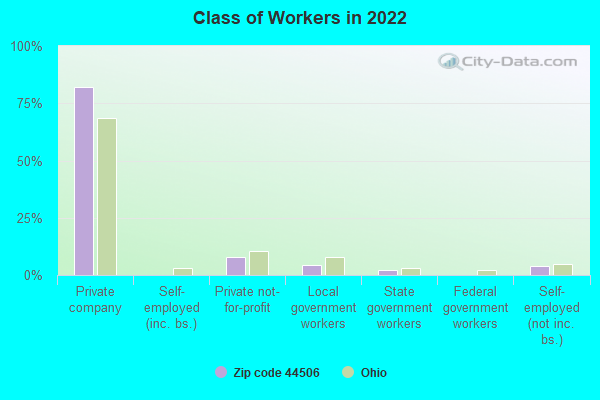
% of renters here:
52%
State:
33%
March 2022 cost of living index in zip code 44506: 87.4 (less than average, U.S. average is 100)
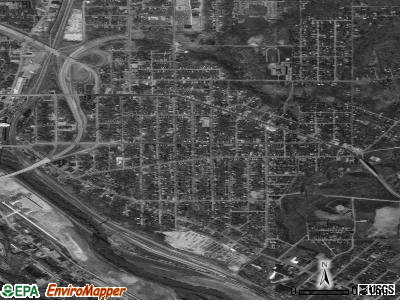
Land area: 1.8 sq. mi. Water area: 0.1 sq. mi.
Population density: 1,380 people per square mile
(low).
OSM Map
General Map
Google Map
MSN Map
OSM Map
General Map
Google Map
MSN Map
OSM Map
General Map
Google Map
MSN Map
OSM Map
General Map
Google Map
MSN Map
Please wait while loading the map...
Real estate property taxes paid for housing units in 2022:
This zip code:
3.3% ($784)
Ohio:
1.3% ($2,639)
Median real estate property taxes paid for housing units with mortgages in 2022: $200 (0.3%) Median real estate property taxes paid for housing units with no mortgage in 2022: $255 (0.6%)
Business Search- 14 Million verified businesses
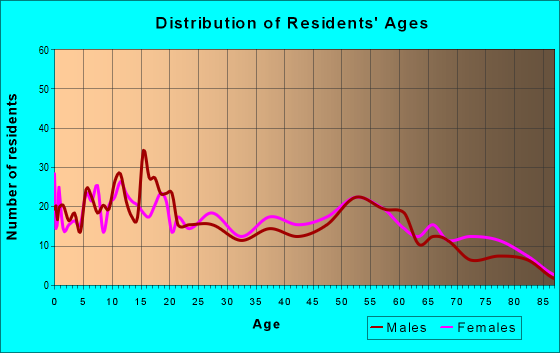
Males: 1,155
(46.5%)
Females: 1,329
(53.5%)
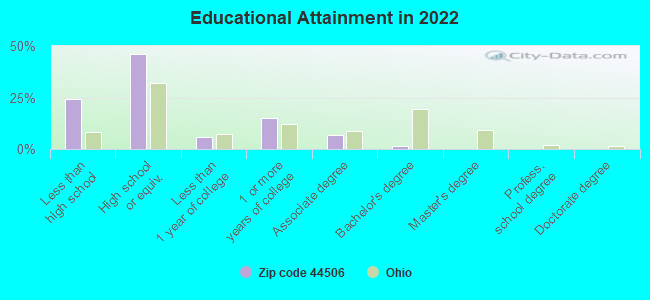
For population 25 years and over in 44506:
High school or higher: 74.1%
Bachelor's degree or higher: 1.6%
Graduate or professional degree: 0.0%
Unemployed: 24.5%
Mean travel time to work (commute): 17.5 minutes
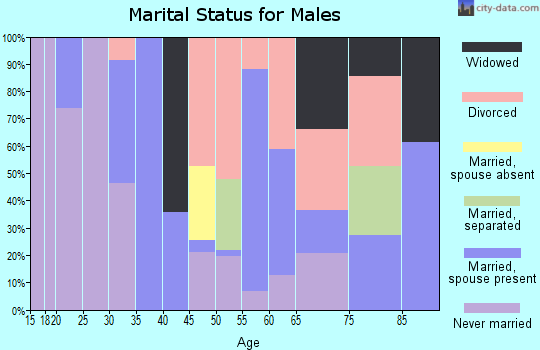
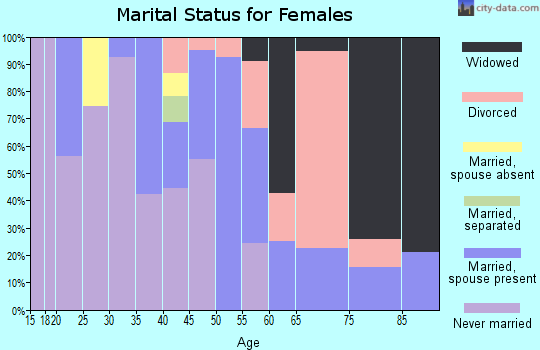
For population 15 years and over in 44506:
Never married: 50.7%
Now married: 28.1%
Separated: 3.0%
Widowed: 10.5%
Divorced: 7.8%
Zip code 44506 compared to state average:
Median household income significantly below state average.
Median house value significantly below state average.
Unemployed percentage significantly above state average.
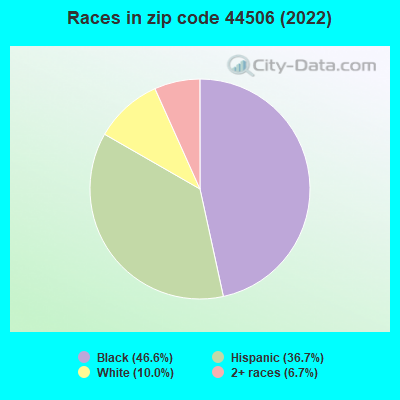
Black race population percentage significantly above state average.
Hispanic race population percentage significantly above state average.
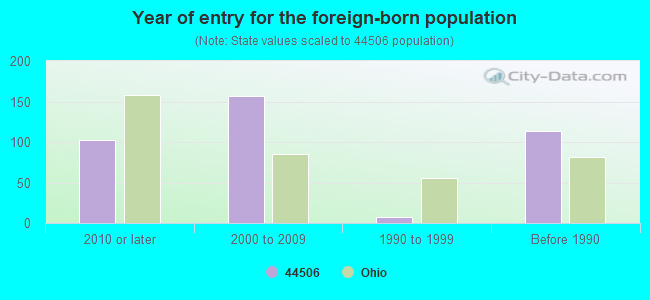
Foreign-born population percentage significantly below state average.
Renting percentage above state average.
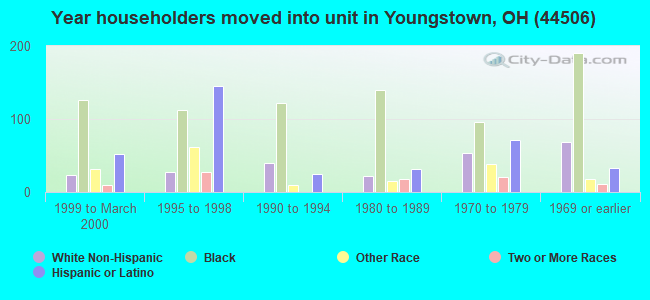
Length of stay since moving in significantly below state average.
House age above state average.
Number of college students below state average.
Percentage of population with a bachelor's degree or higher significantly below state average.
Averages for the 2020 tax year for zip code 44506, filed in 2021:
Average Adjusted Gross Income (AGI) in 2020: $24,513 (Individual Income Tax Returns)
Here:
$24,513
State:
$67,288
Salary/wage: $21,812 (reported on 83.9% of returns)
Here:
$21,812
State:
$55,628
(% of AGI for various income ranges: 1043.6% for AGIs below $25k, 3054.2% for AGIs $25k-50k, 4512.0% for AGIs $50k-75k)
Taxable interest for individuals: $180 (reported on 5.7% of returns)
This zip code:
$180
Ohio:
$1,518
(% of AGI for various income ranges: 0.9% for AGIs below $25k, 2.1% for AGIs $25k-50k)
Profit/loss from business: +$5,900 (reported on 11.5% of returns)
Here:
+$5,900
State:
+$13,744
(% of AGI for various income ranges: 104.0% for AGIs below $25k, 50.8% for AGIs $25k-50k)
Earned income credit: $2,858 (reported on 43.7% of returns)
Here:
$2,858
State:
$2,304
(% of AGI for various income ranges: 170.0% for AGIs below $25k, 133.8% for AGIs $25k-50k)
Percentage of individuals using paid preparers for their 2020 taxes: 95.4%
Here:
95%
State:
94%
(% for various income ranges: 94.2% for AGIs below $25k, 96.4% for AGIs $25k-50k, 100.0% for AGIs $50k-75k, 100.0% for AGIs $75k-100k)
Averages for the 2012 tax year for zip code 44506, filed in 2013:
Average Adjusted Gross Income (AGI) in 2012: $20,540 (Individual Income Tax Returns)
Here:
$20,540
State:
$54,926
Salary/wage: $18,678 (reported on 86.0% of returns)
Here:
$18,678
State:
$45,869
(% of AGI for various income ranges: 77.5% for AGIs below $25k, 81.3% for AGIs $25k-50k, 75.0% for AGIs $50k-75k)
Taxable interest for individuals: $286 (reported on 7.5% of returns)
This zip code:
$286
Ohio:
$1,297
(% of AGI for various income ranges: 0.2% for AGIs below $25k)
Ordinary dividends: $700 (reported on 3.2% of returns)
Here:
$700
State:
$5,821
(% of AGI for various income ranges: 0.2% for AGIs below $25k)
Profit/loss from business: +$8,225 (reported on 12.9% of returns)
Here:
+$8,225
State:
+$12,773
(% of AGI for various income ranges: 11.6% for AGIs below $25k)
Total itemized deductions: $12,067 (24% of AGI, reported on 3.2% of returns)
Here:
$12,067
State:
$21,278
Here:
24.5% of AGI
State:
18.8% of AGI
(% of AGI for various income ranges: 5.8% for AGIs $25k-50k)
Taxes paid: $2,700 (reported on 3.2% of returns)
44506:
$2,700
State:
$9,568
(% of AGI for various income ranges: 1.3% for AGIs $25k-50k)
Earned income credit: $2,893 (reported on 49.5% of returns)
Here:
$2,893
State:
$2,285
(% of AGI for various income ranges: 13.9% for AGIs below $25k, 2.4% for AGIs $25k-50k)
Percentage of individuals using paid preparers for their 2012 taxes: 50.5%
Here:
51%
State:
51%
(% for various income ranges: 47.1% for AGIs below $25k, 61.1% for AGIs $25k-50k, 57.1% for AGIs $50k-75k)
Averages for the 2004 tax year for zip code 44506, filed in 2005:
Average Adjusted Gross Income (AGI) in 2004: $18,347 (Individual Income Tax Returns)
Here:
$18,347
State:
$44,480
Salary/wage: $17,425 (reported on 88.4% of returns)
Here:
$17,425
State:
$39,198
(% of AGI for various income ranges: 81.1% for AGIs below $10k, 86.0% for AGIs $10k-25k, 84.6% for AGIs $25k-50k, 86.0% for AGIs $50k-75k, 68.9% for AGIs $75k-100k)
Taxable interest for individuals: $980 (reported on 14.0% of returns)
This zip code:
$980
Ohio:
$1,532
(% of AGI for various income ranges: 1.3% for AGIs below $10k, 0.6% for AGIs $10k-25k, 1.2% for AGIs $25k-50k, 0.1% for AGIs $50k-75k)
Taxable dividends: $512 (reported on 4.0% of returns)
Here:
$512
State:
$3,496
Profit/loss from business: +$5,847 (reported on 5.5% of returns)
Here:
+$5,847
State:
+$10,813
Total itemized deductions: $10,892 (20% of AGI, reported on 3.4% of returns)
Here:
$10,892
State:
$17,503
Here:
19.6% of AGI
State:
20.8% of AGI
Charity contributions deductions: $3,656 (7% of AGI, reported on 3.0% of returns)
Here:
$3,656
State:
$3,087
Here:
7.2% of AGI
State:
3.4% of AGI
Total tax: $2,267 (reported on 45.3% of returns)
44506:
$2,267
State:
$6,781
(% of AGI for various income ranges: 1.3% for AGIs below $10k, 2.8% for AGIs $10k-25k, 6.1% for AGIs $25k-50k, 10.4% for AGIs $50k-75k, 14.2% for AGIs $75k-100k)
Earned income credit: $2,035 (reported on 48.5% of returns)
Here:
$2,035
State:
$1,696
Percentage of individuals using paid preparers for their 2004 taxes: 57.6%
Here:
58%
State:
55%
(% for various income ranges: 52.8% for AGIs below $10k, 62.0% for AGIs $10k-25k, 55.8% for AGIs $25k-50k, 81.8% for AGIs $50k-75k)
Household received Food Stamps/SNAP in the past 12 months: 482 Household did not receive Food Stamps/SNAP in the past 12 months: 830
Women who had a birth in the past 12 months: 18 (0 now married, 18 unmarried) Women who did not have a birth in the past 12 months: 476 (108 now married, 367 unmarried)
Housing units in zip code 44506 with a mortgage: 168 (6 second mortgage, 7 both second mortgage and home equity loan) Houses without a mortgage: 33
Median monthly owner costs for units with a mortgage: $772 Median monthly owner costs for units without a mortgage: $375
Residents with income below the poverty level in 2022:
This zip code:
36.1%
Whole state:
13.4%
Residents with income below 50% of the poverty level in 2022:
This zip code:
28.4%
Whole state:
7.0%
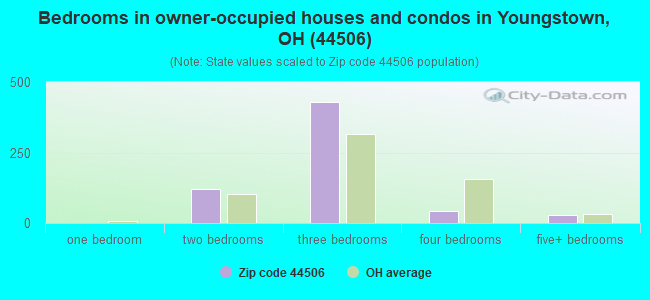
Median number of rooms in houses and condos:
Here:
6.0
State:
6.7
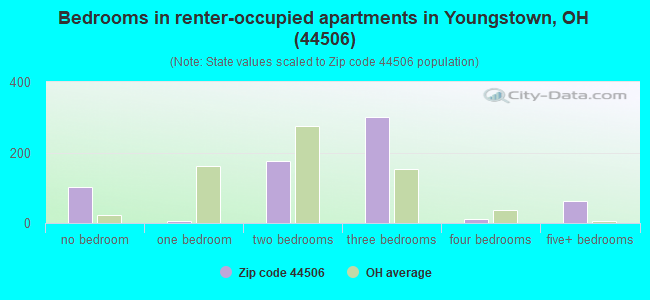
Median number of rooms in apartments:
Here:
5.5
State:
4.4
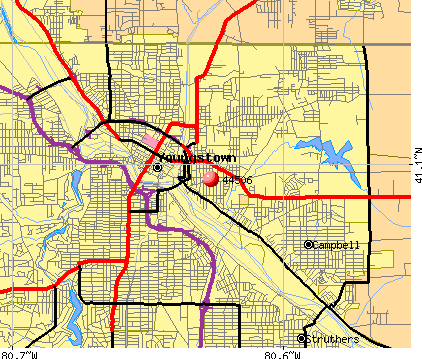
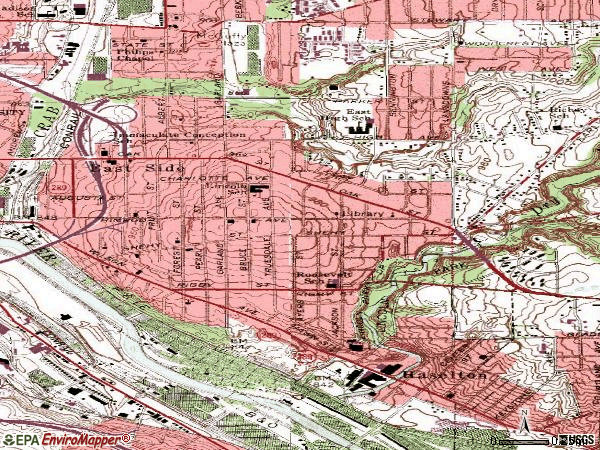
Notable locations in this zip code not listed on our city pages
Notable locations in zip code 44506: United Methodist Community Center (A), City of Youngstown Fire Department Station 6 (B). Display/hide their locations on the map
Churches in zip code 44506 include: Elizabeth Baptist Church (A), Church of God (B), Canaan Missionary Baptist Church (C), Bible Baptist Church (D), Refuge Apostolic Temple (E), Sacred Heart Catholic Church (F), Friends House Chapel Church (G), New Zion Gospel Church (H), Fellowship Baptist Church (I). Display/hide their locations on the map
Size of family households: 242 2-persons, 330 3-persons, 124 4-persons
Size of nonfamily households: 552 1-person, 52 2-persons
66 married couples with children.
420 single-parent households (107 men, 313 women).
67.3% of residents of 44506 zip code speak English at home.
32.7% of residents speak Spanish at home (33% very well, 14% well, 34% not well, 18% not at all).
1.7% of residents speak other Indo-European language at home (10% very well, 90% not well).
Housing units lacking complete plumbing facilities: 5.3% Housing units lacking complete kitchen facilities: 5.6%
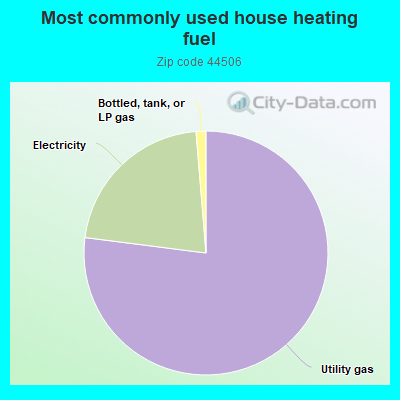
77.1%Utility gas
21.7%Electricity
1.3%Bottled, tank, or LP gas
Population in 1990: 5,619.
Place of birth for U.S.-born residents:
This state: 1,722
Northeast: 195
Midwest: 79
South: 92
West: 14
69% of the 44506 zip code residents lived in the same house 5 years ago. Out of people who lived in different houses, 74% lived in this county. Out of people who lived in different counties, 50% lived in Ohio.
91% of the 44506 zip code residents lived in the same house 1 year ago. Out of people who lived in different houses, 44% moved from this county. Out of people who lived in different houses, 27% moved from different county within same state. Out of people who lived in different houses, 7% moved from different state. Out of people who lived in different houses, 29% moved from abroad.
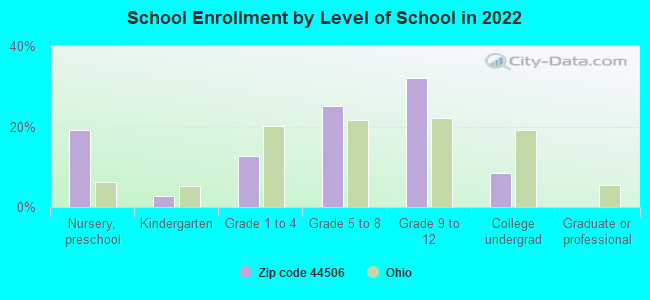
Private vs. public school enrollment:
Students in private schools in grades 1 to 8 (elementary and middle school):
Here:
0.0%
Ohio:
16.0%
Students in private schools in grades 9 to 12 (high school): 58
Here:
35.1%
Ohio:
13.1%
Students in private undergraduate colleges:
Here:
0.0%
Ohio:
22.3%
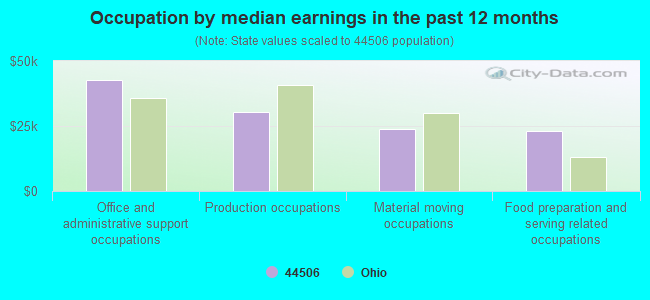
Occupation by median earnings in the past 12 months ($)
42,689Office and administrative support occupations
30,508Production occupations
23,675Material moving occupations
22,922Food preparation and serving related occupations
Top industries in this zip code by the number of employees in 2005:
Other Services (except Public Administration): Religious Organizations (20-49 employees: 1 establishment, 5-9 employees: 1 establishment, 1-4 employees: 3 establishments)
Educational Services: Elementary and Secondary Schools (10-19: 1, 5-9: 1)
Construction: Other Building Finishing Contractors (10-19: 1)
People in group quarters in 2010:
54 people in other noninstitutional facilities
People in group quarters in 2000:
3 people in homes or halfway houses for drug/alcohol abuse
Fatal accident statistics in 2013:
Fatal accident count: 1
Vehicles involved in fatal accidents: 1
Fatal accidents caused by drunken drivers: 0
Fatalities: 1
Persons involved in fatal accidents: 2
Pedestrians involved in fatal accidents: 0
Fatal accident statistics in 2011:
Fatal accident count: 1
Vehicles involved in fatal accidents: 1
Fatal accidents caused by drunken drivers: 1
Fatalities: 1
Persons involved in fatal accidents: 4
Pedestrians involved in fatal accidents: 0
Home Mortgage Disclosure Act Aggregated Statistics For Year 2009 (Based on 2 full and 4 partial tracts)
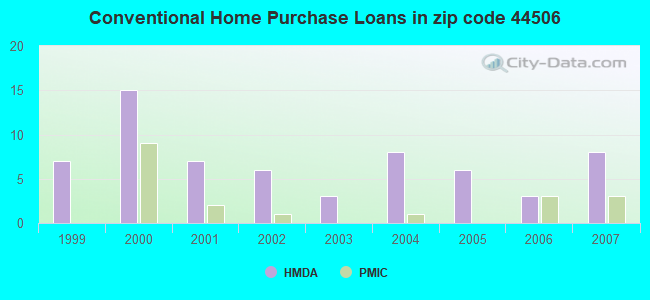
B) Conventional Home Purchase Loans
C) Refinancings
D) Home Improvement Loans
F) Non-occupant Loans on < 5 Family Dwellings (A B C & D)
Number
Average Value
Number
Average Value
Number
Average Value
Number
Average Value
LOANS ORIGINATED
0
$0
3
$10,127
2
$8,790
0
$0
APPLICATIONS APPROVED, NOT ACCEPTED
0
$0
0
$0
6
$10,100
0
$0
APPLICATIONS DENIED
2
$26,375
12
$20,352
23
$9,912
4
$11,428
APPLICATIONS WITHDRAWN
0
$0
3
$28,057
0
$0
0
$0
FILES CLOSED FOR INCOMPLETENESS
0
$0
0
$0
0
$0
0
$0
Aggregated Statistics For Year 2008 (Based on 2 full and 4 partial tracts)
A) FHA, FSA/RHS & VA Home Purchase Loans
B) Conventional Home Purchase Loans
C) Refinancings
D) Home Improvement Loans
F) Non-occupant Loans on < 5 Family Dwellings (A B C & D)
Number
Average Value
Number
Average Value
Number
Average Value
Number
Average Value
Number
Average Value
LOANS ORIGINATED
0
$0
0
$0
6
$18,630
10
$10,244
2
$21,250
APPLICATIONS APPROVED, NOT ACCEPTED
0
$0
2
$12,920
0
$0
7
$4,850
0
$0
APPLICATIONS DENIED
2
$7,950
4
$20,870
23
$35,261
30
$12,016
5
$26,478
APPLICATIONS WITHDRAWN
0
$0
0
$0
0
$0
0
$0
0
$0
FILES CLOSED FOR INCOMPLETENESS
0
$0
0
$0
0
$0
0
$0
0
$0
Aggregated Statistics For Year 2007 (Based on 2 full and 4 partial tracts)
B) Conventional Home Purchase Loans
C) Refinancings
D) Home Improvement Loans
F) Non-occupant Loans on < 5 Family Dwellings (A B C & D)
Number
Average Value
Number
Average Value
Number
Average Value
Number
Average Value
LOANS ORIGINATED
8
$32,726
8
$35,325
8
$14,429
5
$40,884
APPLICATIONS APPROVED, NOT ACCEPTED
1
$14,330
3
$22,530
0
$0
1
$14,330
APPLICATIONS DENIED
1
$87,920
40
$34,945
28
$12,349
8
$37,851
APPLICATIONS WITHDRAWN
0
$0
12
$36,944
0
$0
0
$0
FILES CLOSED FOR INCOMPLETENESS
0
$0
3
$64,327
0
$0
0
$0
Aggregated Statistics For Year 2006 (Based on 2 full and 4 partial tracts)
A) FHA, FSA/RHS & VA Home Purchase Loans
B) Conventional Home Purchase Loans
C) Refinancings
D) Home Improvement Loans
F) Non-occupant Loans on < 5 Family Dwellings (A B C & D)
G) Loans On Manufactured Home Dwelling (A B C & D)
Number
Average Value
Number
Average Value
Number
Average Value
Number
Average Value
Number
Average Value
Number
Average Value
LOANS ORIGINATED
1
$46,560
3
$26,827
27
$27,658
4
$10,378
8
$25,616
0
$0
APPLICATIONS APPROVED, NOT ACCEPTED
0
$0
0
$0
4
$58,468
4
$5,962
0
$0
0
$0
APPLICATIONS DENIED
0
$0
16
$30,470
63
$47,116
29
$13,616
15
$26,696
2
$14,905
APPLICATIONS WITHDRAWN
0
$0
7
$45,489
14
$59,691
4
$43,855
6
$33,607
0
$0
FILES CLOSED FOR INCOMPLETENESS
0
$0
0
$0
6
$53,707
0
$0
0
$0
0
$0
Aggregated Statistics For Year 2005 (Based on 2 full and 4 partial tracts)
B) Conventional Home Purchase Loans
C) Refinancings
D) Home Improvement Loans
F) Non-occupant Loans on < 5 Family Dwellings (A B C & D)
G) Loans On Manufactured Home Dwelling (A B C & D)
Number
Average Value
Number
Average Value
Number
Average Value
Number
Average Value
Number
Average Value
LOANS ORIGINATED
6
$20,913
23
$26,908
9
$16,896
11
$20,977
0
$0
APPLICATIONS APPROVED, NOT ACCEPTED
2
$129,195
14
$104,528
2
$11,895
3
$358,247
0
$0
APPLICATIONS DENIED
10
$33,789
85
$44,912
46
$15,072
14
$35,265
2
$109,320
APPLICATIONS WITHDRAWN
6
$48,033
22
$40,276
3
$50,240
0
$0
0
$0
FILES CLOSED FOR INCOMPLETENESS
0
$0
6
$34,452
0
$0
0
$0
0
$0
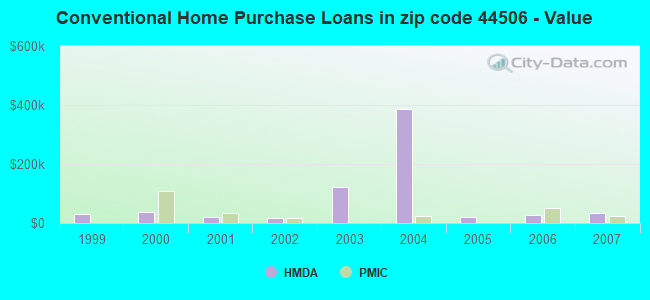
Aggregated Statistics For Year 2004 (Based on 2 full and 4 partial tracts)
B) Conventional Home Purchase Loans
C) Refinancings
D) Home Improvement Loans
E) Loans on Dwellings For 5+ Families
F) Non-occupant Loans on < 5 Family Dwellings (A B C & D)
G) Loans On Manufactured Home Dwelling (A B C & D)
Number
Average Value
Number
Average Value
Number
Average Value
Number
Average Value
Number
Average Value
Number
Average Value
LOANS ORIGINATED
8
$387,121
24
$31,655
10
$21,349
1
$44,480
12
$54,302
0
$0
APPLICATIONS APPROVED, NOT ACCEPTED
4
$49,002
11
$43,382
4
$23,080
0
$0
0
$0
0
$0
APPLICATIONS DENIED
9
$24,374
110
$41,213
62
$15,260
0
$0
0
$0
1
$18,620
APPLICATIONS WITHDRAWN
4
$216,388
34
$42,148
7
$12,383
0
$0
4
$31,305
0
$0
FILES CLOSED FOR INCOMPLETENESS
2
$30,810
10
$56,134
0
$0
0
$0
0
$0
0
$0
Aggregated Statistics For Year 2003 (Based on 2 full and 4 partial tracts)
A) FHA, FSA/RHS & VA Home Purchase Loans
B) Conventional Home Purchase Loans
C) Refinancings
D) Home Improvement Loans
F) Non-occupant Loans on < 5 Family Dwellings (A B C & D)
Number
Average Value
Number
Average Value
Number
Average Value
Number
Average Value
Number
Average Value
LOANS ORIGINATED
2
$17,890
3
$122,060
57
$24,089
8
$10,924
36
$18,815
APPLICATIONS APPROVED, NOT ACCEPTED
0
$0
5
$136,244
22
$43,162
2
$25,860
4
$25,922
APPLICATIONS DENIED
0
$0
1
$9,310
101
$34,803
32
$14,891
11
$29,908
APPLICATIONS WITHDRAWN
0
$0
4
$138,138
27
$59,713
1
$5,970
2
$50,685
FILES CLOSED FOR INCOMPLETENESS
0
$0
0
$0
3
$51,380
4
$5,465
0
$0
Aggregated Statistics For Year 2002 (Based on 2 full and 4 partial tracts)
B) Conventional Home Purchase Loans
C) Refinancings
D) Home Improvement Loans
E) Loans on Dwellings For 5+ Families
F) Non-occupant Loans on < 5 Family Dwellings (A B C & D)
Number
Average Value
Number
Average Value
Number
Average Value
Number
Average Value
Number
Average Value
LOANS ORIGINATED
6
$18,470
62
$29,829
5
$10,654
0
$0
32
$24,282
APPLICATIONS APPROVED, NOT ACCEPTED
1
$41,380
28
$39,310
2
$7,400
0
$0
0
$0
APPLICATIONS DENIED
7
$36,180
153
$37,177
33
$6,426
1
$39,310
7
$16,816
APPLICATIONS WITHDRAWN
5
$27,324
36
$35,391
2
$3,975
0
$0
2
$16,895
FILES CLOSED FOR INCOMPLETENESS
0
$0
7
$38,643
0
$0
0
$0
1
$30,000
Aggregated Statistics For Year 2001 (Based on 2 full and 4 partial tracts)
A) FHA, FSA/RHS & VA Home Purchase Loans
B) Conventional Home Purchase Loans
C) Refinancings
D) Home Improvement Loans
F) Non-occupant Loans on < 5 Family Dwellings (A B C & D)
Number
Average Value
Number
Average Value
Number
Average Value
Number
Average Value
Number
Average Value
LOANS ORIGINATED
1
$37,010
7
$21,899
36
$34,409
23
$5,735
4
$14,422
APPLICATIONS APPROVED, NOT ACCEPTED
0
$0
3
$32,180
39
$37,064
7
$14,493
0
$0
APPLICATIONS DENIED
0
$0
10
$34,853
150
$33,660
87
$11,897
10
$31,009
APPLICATIONS WITHDRAWN
2
$39,750
0
$0
62
$32,013
9
$13,537
0
$0
FILES CLOSED FOR INCOMPLETENESS
0
$0
1
$64,470
10
$41,849
0
$0
0
$0
Aggregated Statistics For Year 2000 (Based on 2 full and 4 partial tracts)
A) FHA, FSA/RHS & VA Home Purchase Loans
B) Conventional Home Purchase Loans
C) Refinancings
D) Home Improvement Loans
F) Non-occupant Loans on < 5 Family Dwellings (A B C & D)
Number
Average Value
Number
Average Value
Number
Average Value
Number
Average Value
Number
Average Value
LOANS ORIGINATED
0
$0
15
$38,572
65
$27,290
16
$7,399
6
$26,295
APPLICATIONS APPROVED, NOT ACCEPTED
1
$17,580
5
$27,870
33
$28,523
10
$7,212
0
$0
APPLICATIONS DENIED
0
$0
18
$26,494
145
$30,274
74
$8,512
7
$17,880
APPLICATIONS WITHDRAWN
1
$29,840
6
$57,307
44
$35,931
7
$9,590
1
$21,720
FILES CLOSED FOR INCOMPLETENESS
0
$0
3
$40,833
19
$29,581
0
$0
0
$0
Aggregated Statistics For Year 1999 (Based on 3 partial tracts)
A) FHA, FSA/RHS & VA Home Purchase Loans
B) Conventional Home Purchase Loans
C) Refinancings
D) Home Improvement Loans
F) Non-occupant Loans on < 5 Family Dwellings (A B C & D)
2003 - 2018 National Fire Incident Reporting System (NFIRS) incidents
According to the data from the years 2003 - 2018 the average number of fire incidents per year is 58. The highest number of reported fire incidents - 99 took place in 2010, and the least - 25 in 2006. The data has a declining trend.
When looking into fire subcategories, the most reports belonged to: Structure Fires (50.4%), and Outside Fires (31.6%).
Fire incident types reported to NFIRS in Zip Code 44506


 Nearest zip codes: 44502, 44503, 44507, 44505, 44405, 44504.
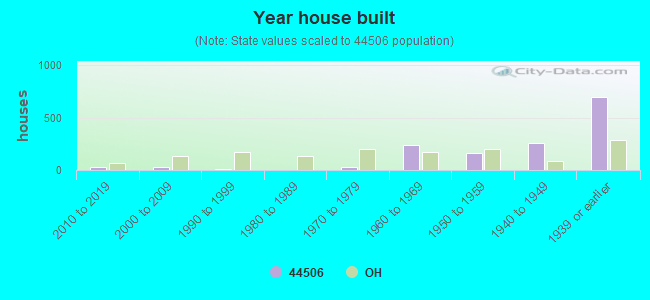


 According to the data from the years 2003 - 2018 the average number of fire incidents per year is 58. The highest number of reported fire incidents - 99 took place in 2010, and the least - 25 in 2006. The data has a declining trend.
 When looking into fire subcategories, the most reports belonged to: Structure Fires (50.4%), and Outside Fires (31.6%).